Rep:MgO:HassanRafiq2016
Introduction
The System - Magnesium Oxide
The system being analysed is that of Magnesium Oxide. It is important to first introduce the lattice structure and lattice parameters of MgO to aid in understanding of discussions found later in the report. The system is assumed to be an ideal, non-defective, periodic system in 3D. The structure of MgO can be described by three types of cells. The primitive cell: The simplest cell that can be used to generate the crystal. The conventional cell: A cube with four times the volume of the primitive cell that more accurately reflects the true symmetry of MgO, and the supercell: A repeating conventional unit cell of the crystal. MgO has a face-centred cubic lattice structure with lattice parameters a = b = c. [1]
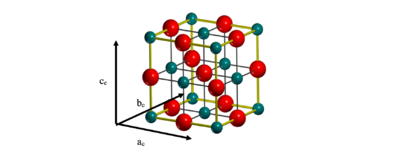
MgO is of significant importance across a wide range of industries & scientific areas, from the Earth sciences and solid-state physics, where it proves to be a very capable prototype material for modelling other ionic oxides, to engineering & construction [8]. The key focus of the investigation was on the thermal expansion of MgO. An understanding of the thermal expansion of a material is of interest as it reflects the material’s inherit strength, with it being an important factor in helping to understand the residual stress in composites and super lattices in addition to being an important parameter in modelling the thermodynamics of the Earth’s interior, with MgO being particularly abundant in the Earth's lower mantle [7].
The Methodology
The focus and core of the investigation was on the atomic motions in the MgO crystal, analysis and evaluation of atomic motions can help divulge a host of properties, including but not limited to thermal properties, transport properties and certain electrical properties. As mentioned, the aim for this investigation was to understand the effects of temperature on the lattice – namely the thermal expansion. The motions are not random, but are instead governed by the forces the atoms exert on each other. The forces between atoms are ultimately electrostatic in origin, however the types of forces will not be discussed in depth. [2] [4]
Computationally, two methods were utilised to calculate the desired properties. This was done using LVisualize, a graphical interface to the modelling code GULP (General Utility Lattice Program). The software utilised the Quasi Harmonic Approximation and Molecular Dynamics. The harmonic approximation, despite being a rather simple model, proves as later discussed, capable of providing accurate results. [4] The harmonic approximation was used to calculate the internal energy and vibrations of the crystal. These vibrational levels were in turn used to calculate the Helmholtz free energy of the MgO crystal to predict how the material expands when heated through the calculation of the thermal expansion coefficient.[5] This was followed by Molecular Dynamics simulations. The core of the Molecular Dynamics simulations is to solve Newton's equations of motion, principally F=ma for the atoms in the lattice structure, which are assumed to interact via an inter-atomic anharmonic potential. [2] [4] The forces on the atoms are computed, atoms are then accelerated using the equations of motion. New atomic positions are generated, meaning the atoms are moved, this being considered a time step. With the procedure being repeated for the new atomic positions. In essence, Molecular Dynamics tries to simulate the actual motion of the atoms in the crystal. [2] The result, as will be discussed later, is a more accurate method for calculating the free energy of the crystal by summing over all of the vibrational modes.
Results & Discussion
Calculating the internal energy of an MgO crystal
As mentioned earlier, the motions of the atoms are not random, but are instead dictated by the forces the atom exert on each other (inter-atomic forces). The forces accounted for include both short range repulsions and coulombic interactions. [4] [5] The total internal energy of the crystal is the sum over the infinite lattice of all the atom-atom interactions, this energy can then be used in the development of a model potential to approximate the interaction between atoms, the potential produced is a Morse-like potential. The internal energy calculated was -41.075 eV, or -3963.134 kJ mol-1 (lit. 3795 kJ mol-1, -39.332 eV [6]), this internal energy is equivalent to the binding energy of the crystal, which details the energy required to pull all of the ions in the crystal to an infinite separation. [5] In comparison to the literature, -39.332 eV, it can be seen that the simulation provides quite accurate results with only a 4.43% difference between predicted and experimental values.
Lattice vibrations – Computing the phonons
Computing the phonon dispersion curves.
In a crystal, there are an infinite number of vibrations or phonons. The crystal can be thought to be made up of an infinite number of repeating unit cells. Each vibration has an associated wavelength λ, or equivalently a wave vector k. Where k = 2π/ λ. For every vibration in the crystal, there is an associated k value. Each vibration has an associated energy, in turn the vibration has a related frequency. A plot of the frequency of vibration against k values is known as a phonon dispersion curve. The dispersion curve shows all of the vibrations in the crystal. [2] [1]

Following this, it is possible to compute an object known as the “Density of States”, the density of states demonstrates a sort of summary of the phonon dispersion curve by averaging over all k points, computing the number of occupied vibrational modes at a given frequency. [5] The more k points averaged over, the more vibrational modes computed. Optimisation simulations were run to find a suitable number of k points to produce a suitable density of states curve considering CPU limitations – The more k points computed, the longer the computations take. The grid of k points on which the average was performed was increased from 2 x 2 x 2 up to 32 x 32 x 32, the larger the grid size, the more k points averaged.
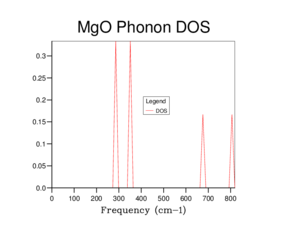
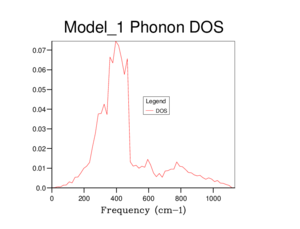
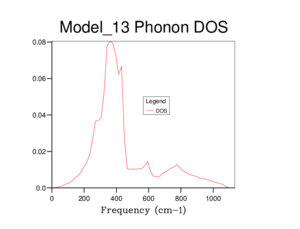
The density of state plots are shown in Figures 3 – 8. As can be seen, as the grid size was increased the density of state graph displays more vibrational modes and appears more continuous. The relationship between the dispersion curve and the density of states can be seen through examination of figures 2 and 3. As mentioned, the density of states is calculated by averaging over all k values in the grid space. In figure 3 for the 1x1x1 grid, only one k point was evaluated, by comparing to the dispersion curve it can be seen that the k value evaluated at was L – The vibrational frequencies being 288.49 cm-1, 288.49 cm-1, 351.76 cm-1, 351.76 cm-1, 676.23 cm-1 and 818.82 cm-1. It was found to be that a minimum grid size for a reasonable approximation to the density of states was 16 x 16 x 16, providing a good representation of the vibrational modes, clearly superior to that of an 8 x 8 x 8 seen in figure 6, although it is clear in figure 8 that a 32 x 32 x 32 provides a better representation albeit at the cost of more computational time.

Calculating the Free Energy in the Quasi Harmonic Approximation


| Grid Size | Helmholtz Free-Energy / eV |
| 2 x 2 x 2 | -40.926609 |
| 4 x 4 x 4 | -40.926450 |
| 8 x 8 x 8 | -40.926478 |
| 16 x 16 x 16 | -40.926482 |
| 32 x 32 x 32 | -40.926483 |
The Helmholtz Free energy quantifies the amount of useful work able to be done by a thermodynamic system. It's possible to model the temperature dependence of the MgO crystal structure by calculating the minimum of the Helmholtz free energy. [4] By computing the free energy at various grid sizes it is found that the free energy converges to -40.9265 eV. Depending on the degree of accuracy one desires the grid size can be adjusted accordingly. For example, for calculations accurate to 1 meV, 0.5 meV and 0.1 meV per cell, it would be suggested to use grid sizes of 4 x 4 x 4, 2 x 2 x 2 and 8 x 8 x 8 respectively.
Using statistical thermodynamics, the Helmholtz free energy can be obtained from the following set of equations:

The entropic advantage of lower frequencies at higher temperatures offsets the energy advantage of having as small a volume as possible, leading to thermal expansion [4], the relationship between the free energy and entropy can be seen in equation 4:
F = U - TS (4) F = Helmholtz Free energy, U = Internal energy, T = Temperature, S = Entropy.
The Thermal Expansion of MgO
The structure of Magnesium Oxide was optimised with respect to the Helmholtz free energy between 0 K - 1000 K through structural optimisation at each temperature, with the lattice parameters a, b and c being optimised at each temperature. The internal energy was found using the Quasi Harmonic Approximation, this is the assumption that the anharmonicity is restricted to thermal expansion - Meaning that the temperature dependence of the phonon/vibrational frequencies arises only from the crystal structure and volume [4]. Another major component of this approximation is that the displacements of the atoms from the equilibrium position are small, this may not hold true for higher temperatures where the potential can no longer be accurately described as harmonic.

As displayed in figure 9, as the temperature increases, the free energy decreases. This can be rationalised through equation 4. The increase in temperature leads to an increase in the entropic term which outweighs any potential increase in the internal energy term.
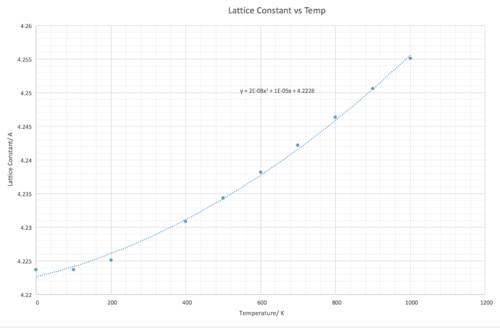
Figure 10 shows how the lattice constant increases as the temperature increases as expected due to the thermal expansion of the lattice. Interestingly, the lattice constant seems to be increasing at a linear rate between 400 K - 1000 K. The lattice constants for each temperature were calculated in the following way: Multiplying the primitive cell volume in the output file by 4 to obtain the conventional cell volume, then taking the cube root of the conventional cell volume to obtain lattice parameters a, b and c.
To better understand the thermal expansion of MgO, the volumetric expansion coefficient was calculated using equation 5, this expansion coefficient describes how the volume of the lattice changes per temperature unit (Kelvin). The volumetric expansion coefficient was converted to the linear expansion coefficient as is generally quoted in literature through division by 3, due to the isotropic behaviour of MgO, meaning that the lattice expands equally in all directions.
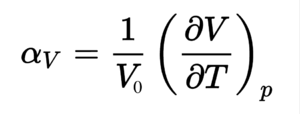
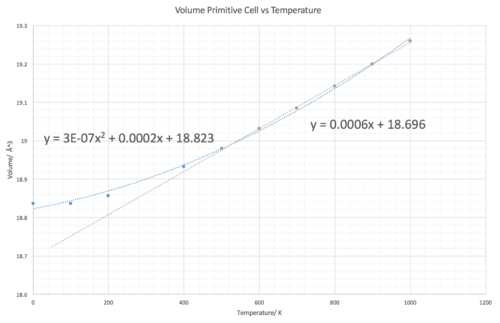
Linear expansion coefficient = 10.71 K-1. 0.0006 (gradient of the linear region) multiplied by 1/initial volume at 0K (1/18.6804 A3) Literature value = 12.8 K-1 [7] measured at 500K, it is at this point that it should be mentioned that the thermal expansion coefficient varies with temperature, however between 500 K-1000 K the coefficient remained fairly constant. This shows that the quasi harmonic approximation provides a reasonable model for calculating the thermal expansion with a percentage difference of 16 %.
Molecular Dynamics
The key parameters needed to be considered when doing the molecular dynamic simulations are the cell size and the time step length. [5] The time step length needs to be of sufficient length to allow for the computation of all vibrational modes whilst still being reasonable in terms of CPU usage. The second factor is in the cell size, the cell needs to be of sufficient size to allow for sufficient sampling of the vibrations, similar to the k grid spacing considerations in the harmonic approximation, with the larger the cell, the more accurate the computations of the vibrations. These two parameters were set at 1 femtosecond (10-15 sec) time step and a 32 unit supercell respectively.
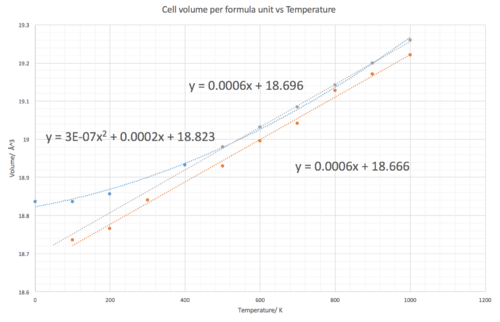
The thermal expansion coefficients predicted by the molecular dynamics tends to have greater accuracy over a larger range of temperature values. At 500 K and above they appear to produce the same results, however below 500 K the Molecular dynamics simulation prove more accurate. For example at 300 K, the Molecular Dynamics approximation provides a value of 10.71 x 10⁻⁶ K-1, only 5% difference from the literature (10.2 x 10⁻⁶ K-1 [7] ) In comparison, at 300 K in the harmonic approximation a value of 16.06 x 10⁻⁶ K-1 is obtained, calculated by differentiating the polynomial line of best fit equation y = 3E-07x2 + 0.0002x + 18.823 and evaluating at 300 K, a 57% difference from literature. Furthermore, despite the expansion coefficients being equal above 500 K due to both graphs having a line of best fit with the same gradient. It could be said that the molecular dynamics results are more reliable considering that it has a better fitting line of best fit. A problem with the molecular dynamics simulation is that for the temperatures measured, a straight linear plot is produced, this then does not allow one to observe that the thermal expansion coefficient actually increases with temperature albeit slowly between 500-1000 K and is not constant.
Conclusion
The two approximations provide different results because they are of different complexities. Using the harmonic approximation provides decent results and is a simpler method, that is cheaper and more time effective than molecular dynamics. There are greater limitations in the temperature range it will be accurate in, falling short at much higher temperatures where atomic displacement becomes larger and so can no longer be described by a purely harmonic description. In comparison, the molecular dynamic simulations are more complex, more CPU intensive and more time consuming - However they provide more accurate results and can do so in a wider range of temperatures but still is not fantastically accurate at all temperatures. The factors one has to consider when deciding on approximation type is the cost, time and desired accuracy of results. There are improvements that could lead to more accurate results in molecular dynamic calculations, by increasing the time stamp or increasing the supercell size, both will allow for more accurate computations of the vibrations. Overall, it is believed that the aims of predicting how MgO would thermally expand have been met though calculation of the thermal expansion coefficient, consideration was also paid to the approximations used in calculating a host of properties, in addition to evaluating the strengths and weaknesses of said methods.
References & Bibliography
1. From Giuseppe Mallia’s Lecture Notes: Introduction to the Computational Laboratory 2. From Prof N. M. Harrison’s Lecture Notes: Vibrations in crystals 3. R. Hoffmann, Angew. Chemie Int. Ed. English, 1987, 26, 846–878. 4. M. Dove, Introduction to Lattice Dynamics, Cambridge University Press, 1993 5. Thermal Expansion of MgO Lab Script 6. L. Glasser and H. D. B. Jenkins, 2000, 632–638. 7. R. R. Reeber, K. Goessel and K. Wang, Eur. J. Mineral., 195, 7, 1039–1047. 8. A. R. Oganov, M. J. Gillan and G. D. Price, J. Chem. Phys., 2003, 118, 10174–10182. 9. Part of MgO conventional cell diagram http://www.theochem.unito.it/crystal_tuto/mssc2008_cd/tutorials/geometry/geom_tut.html, accessed on 20/10/2016.
