Rep:MgO5615
MgO Computational Lab
Abstract:
The properties of structures can be modeled using computational software, and this can be used to predict the properties of structures to be assembled. In this investigation, the General Utility Lattice Program (GULP) was used to examine the behaviour of the crystal MgO. The main findings were the difference in primitive cell volume predicted by the quasi-harmonic and molecular dynamics calculations, the calculation of the thermal expansion coefficient, finding the optimal grid size for generating a density of states graph, and how to approach finding an optimal grid size for performing calculations.
Introduction
In this lab the vibrations of the crystalline solid magnesium oxide (MgO) was analyzed. The calculations were done using the software GULP (general utility lattice program). The software is able to compute the phonon vibrations of magnesium oxide and the properties and parameters of the solid, such as free energy, lattice parameters, through its quasi-harmonic approximation, and also through molecular dynamics.
In molecules, there exists vibrational modes associated with specific frequencies at which the bonds of the molecules undergo oscillation. These oscillations can be determined by formulae, yielding 3N-5 vibrational modes for linear molecules, and 3N-6 vibrational modes for non-linear molecules. If there is an infinite number of atoms, however, there will be an infinite number of vibrational modes, which is assumed in magnesium oxide in the discussion which follows[1].
The approach to build up an energy diagram for the vibrational modes of a solid was illustrated by Roald Hoffman in his paper "How Chemistry and Physics Meet in the Solid State". One can think of this approach as being similar to that used to construct MO diagrams[1]. Very dense energy levels can be thought of as being a continuous band, and in a solid material there are several continuous bands, due to the large numbers of possible vibrational modes that has been combined.
This leads to the concept the phonon dispersion diagram. Due to the principle of wave-particle duality, it is possible to consider waves, such as those transmitted through the solid as it undergoes vibration at above 0 K, as particles, known as phonons. The vibrations of these particles are described in reciprocal space, in which each of the three axes represent vibration in one of the three dimensions. The possible vibrations at each point in the crystal can be summarized in the phonon dispersion diagram, which shows the possible vibrational frequencies at each point in Brouillon space (the space describing all points in the unit cell of the solid). Since several vibrational states exists, another graph, the density of states (DOS) graph is used to show the distribution of these energy levels. This graph plots the wavenumbers of the vibrations against the number of energy levels between E and a small increase in energy, dE[1].
Thermal expansion is also examined in this lab. The thermal expansion coefficient, α, is calculated for MgO. The expansion behaviour of MgO below the melting point, 3073 K [2], is also modeled. The coefficient of thermal expansion is given by:
Methodology
Investigation regarding the properties of magnesium oxide was performed using the Linux operating system. The visualization program dlv was used, whilst the calculations were carried out using GULP. The following properties were investigated.
- The phonon modes of the solid was calculated.
- The optimal grid size for modelling MgO was found. This had to be of a value which will enable subsequent calculations to be accurate, but not so large that it will be too long to compute.
- The behaviour of the solid at different temperatures were modeled, using both the quasi-harmonic approximation and the molecular dynamics simulation.
Initially, the phonon dispersion graph was produced, and the effect of the number of grid points used in generating the density of states graph was investigated. This enabled an understanding of how the grid size affects the accuracy of the calculations.
The optimal grid size for carrying out calculations was then determined for producing data using the quasi-harmonic calculations. This enabled the free energy and primitive cell parameter to be determined. This was done for temperatures from 0 K to 2900 K. The melting point of MgO is 3073 K.
In order to make sure the values obtained are optimized, the gradients of the energy are checked. If optimization has been achieved, then they should be zero, which signifies that a minimum in the energy surface has been reached. This is an example of the output:
 Final cell parameters and derivatives :


--------------------------------------------------------------------------------

       a            3.002588 Angstrom     dE/de1(xx)     0.000000 eV/strain

       b            3.002588 Angstrom     dE/de2(yy)     0.000000 eV/strain

       c            3.002588 Angstrom     dE/de3(zz)     0.000000 eV/strain

       alpha       59.999961 Degrees      dE/de4(yz)     0.000000 eV/strain

       beta        59.999961 Degrees      dE/de5(xz)     0.000000 eV/strain

       gamma       59.999961 Degrees      dE/de6(xy)     0.000000 eV/strain

--------------------------------------------------------------------------------
After it is ensured that the derivatives are zero and no error messages were seen the results were analyzed. Note this does not ensure the structure obtained is correct, unless the input and the initial constraints used to perform the calculations were also checked to be correct.
The molecular dynamics simulation was also ran on MgO. Since simulating it on only one unit cell will result in all the simulations being in phase with each other, which is not meaningful, a greater cell with 32 MgO pairs were investigated. The ensemble used in the MD simulation was NPT, meaning the number of particles, the pressure, and the temperature were fixed at each run of the calculation. The MD simulation calculated the free energy and cell parameters, analyzed below.
Results and Analysis
The Phonon Modes of MgO
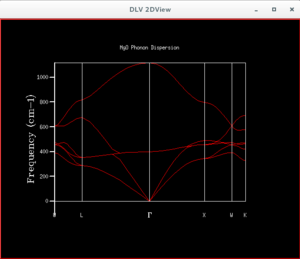
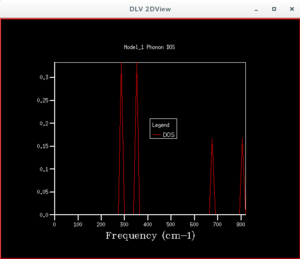
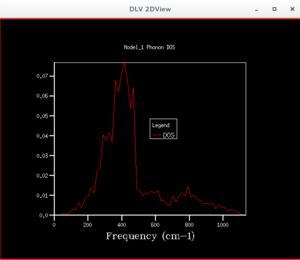

After the phonon dispersion graph was plotted, the density of states (DOS) graph was produced by applying a shrink factor to the lattice. The first shrink factor applied was 1x1x1. This returned a graph with 4 peaks, of which upon inspection 2 had double the height of the others. This suggests the coordinate chosen for this single point was L, as there were also 4 frequencies found at that point, of which the values were the same as that on the DOS graph. Moreover, two of the lower frequencies showed two curves having the same wavenumber. This matches the wavenumbers of the two higher peaks, and explains why they had twice the height of the other peaks. The point L is the point at (0.5,0.5,0.5), with Γ being the coordinate of the origin.
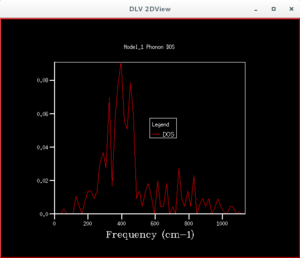
By examining the different DOS graphs produced from different grid sizes, one notices that the height of the peaks changes, as the grid size increases. This is because there are more points in the Brouillon zone whose energies are being calculated, so each point is given a smaller weight, making the heights of peaks that were higher at a smaller grid size shorter. The DOS graphs also become more continuous in appearance as the grid increases, due to the greater number of points being sampled. At smaller grid sizes the graph is less smooth, because there are less points being sampled, so less detail is shown. When the grid size is larger than the optimum grid size, the peak of the DOS graph, and its approximate shape will remain unchanged. At a grid size of 12×12×12 the shape of the DOS graph stops changing significantly. It can therefore be said that this is the grid size at which a approximation of the DOS can be obtained. It is observed that the highest peak appear at a frequency of about 400 cm-1, which corresponds to the frequency where a greater number of lines pass through.
 Brillouin zone sampling points :

 --------------------------------------------------------------------------------
   Point number          x          y          z            Weight
 --------------------------------------------------------------------------------
        1           0.250000   0.250000   0.250000         0.2500
        2           0.250000   0.250000   0.750000         0.2500
        3           0.250000   0.750000   0.250000         0.2500
        4           0.250000   0.750000   0.750000         0.2500
 --------------------------------------------------------------------------------
Brillouin zone sampling points :

--------------------------------------------------------------------------------
  Point number          x          y          z            Weight
--------------------------------------------------------------------------------
        1           0.166667   0.166667   0.166667         0.0741
        2           0.166667   0.166667   0.500000         0.0741
        3           0.166667   0.166667   0.833333         0.0741
        4           0.166667   0.500000   0.166667         0.0741
        5           0.166667   0.500000   0.500000         0.0741
        6           0.166667   0.500000   0.833333         0.0741
        7           0.166667   0.833333   0.166667         0.0741
        8           0.166667   0.833333   0.500000         0.0741
        9           0.166667   0.833333   0.833333         0.0741
       10           0.500000   0.166667   0.166667         0.0370
       11           0.500000   0.166667   0.500000         0.0370
       12           0.500000   0.166667   0.833333         0.0370
       13           0.500000   0.500000   0.166667         0.0370
       14           0.500000   0.500000   0.500000         0.0370
       15           0.500000   0.500000   0.833333         0.0370
       16           0.500000   0.833333   0.166667         0.0370
       17           0.500000   0.833333   0.500000         0.0370
       18           0.500000   0.833333   0.833333         0.0370
--------------------------------------------------------------------------------
In order to find the minimum grid size for which the approximate DOS graph is fairly accurate, the calculation was run several times, increasing the grid size each time from 1x1x1 to 2x2x2, and so on. The accurate approximation can be found when the features of the DOS graph stops changing significantly.
The density of states is related to the dispersion curve. In the solid MgO, there is an infinite number of possible vibrational modes for the molecule. Each of these modes are of a certain amount of energy, but due to their large number, and the small energy barrier between them, these dense energy levels can be considered to be a "branch" or "band". The dispersion curve shows the frequencies of the vibrations at each point in the solid. The density of states graph can be understood as a count of how many degenerate states exist for each wavenumber. This means if there is a frequency for which there is a peak in the DOS graph, we would expect the greatest numbers of energy levels to have that vibrational frequency.
The optimal grid size for...
a similar oxide (eg: CaO)?
The structures of these two solids are expected to be similar. CaO has a lattice parameter of a=4.81 Å, [3]whilst MgO has a lattice parameter of a=4.22 Å[2] . They have the same crystal structure. Since the domain of reciprocal space reaches 2π/a before the values repeat, the calcium oxide structure will possess a smaller dispersion curve compared to magnesium oxide. This means for the same number of lattice points, more detail may be obtained for the DOS graph of calcium oxide compared to that of magnesium oxide. The optimal grid size for MgO would therefore also be suitable for CaO, since a smaller number of points are needed to obtain the same amount of detail, so there will be more shrink points than is needed to generate a sufficiently accurate graph.
a Zeolite (eg: Faujasite) ?
a metal (eg: lithium) ?
We need to take into account the lattice parameters of these compounds. That of a Zeolite will be much larger than magnesium oxide, so it will have a smaller value for the reciprocal space parameter, 2π/a. This means the optimal grid size for MgO can also be used for a zeolite, because more points will be sampled for a given volume. This cannot be done for the metal, since it has a smaller lattice parameter, so the optimal grid size would have to be greater.
Calculating the Free Energy
| Grid Size (a×a×a) | Helmholtz Free Energy (eV) |
|---|---|
| 1 | -40.930301 |
| 2 | -40.926609 |
| 4 | -40.92645 |
| 6 | -40.926471 |
| 8 | -40.926478 |
| 10 | -40.92648 |
| 12 | -40.926481 |
| 14 | -40.926482 |
| 16 | -40.926482 |
| 18 | -40.926483 |
| 20 | -40.926483 |
| 22 | -40.926483 |
| 24 | -40.926483 |
| 26 | -40.926483 |
As seen from the results, as the grid size increased, the value of the Helmholtz free energy quickly converges. After increasing the grid size to 6, the subsequent values for the Helmholtz free energy did not change significantly (see graph), as all subsequent values can be rounded to -40.9265 eV. The value obtained with a grid size of 26x26x26 was -40.926483 eV. As the grid size increased, the value of the Helmholtz energy became less negative.
For calculations accurate to 1 meV, a grid size of 4 is required. For calculations accurate to 0.5 meV, a grid size of 4 is also required, whilst to be accurate to 0.1 meV, a grid size of 10 is required.
The optimal grid size for...
a similar oxide (eg: CaO)?
As explained in the previous section, the optimal grid size can be taken as the same as the optimal MgO grid size. The two structures are also similar, so using the same grid size will not affect the error in the results significantly.
a Zeolite (eg: Faujasite) ?
It should be noted that the Helmholtz free energy is given by the equation F=U-TS. The Zeolite structure is more complex than MgO, and part of the equation requires the calculation of entropy, which is dependent on the possible configurations the structure can have. There will be more possible configurations in the case of the Zeolite, so a larger grid is required before a converging value for Helmholtz free energy can be found.
a metal (eg: lithium) ?
The structure of the metal is simpler than MgO, since there is only one type of atom. Therefore a small grid size can be used to calculate the Helmholtz free energy. The values will be expected to converge quicker.
The Thermal Expansion of MgO
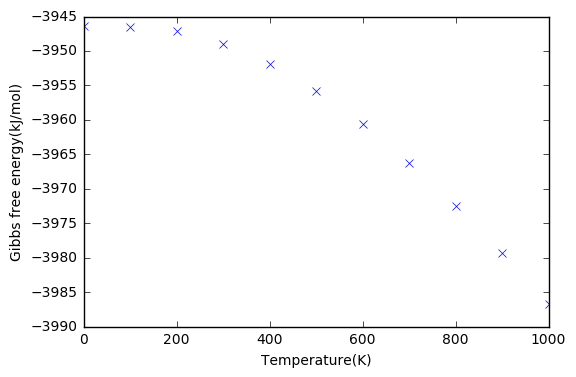
In accordance with previous investigations, a grid size of 26 was selected to calculate the Gibbs free energy of the solid. The temperature was plotted against the Gibbs free energy and primitive cell volume. It can be seen that the Gibbs free energy became more negative as temperature increased, and the primitive cell volume increased with temperature. At low temperatures the curve plateaued, due to reduced motion of the ions.
The coefficient of thermal expansion can be calculated by finding the linear region of the curve, where a linear fit can be done. This gives a value of 2.8128×10⁻⁵ K-1. An experimental value given in literature is 1.04×10⁻⁵ K-1 at 300K[4]. The value is said to change with temperature according to Erba et al[5].
As it is a computed value, approximations have to be made. The main one is to do with the accuracy of the quasi-harmonic approximation at high temperatures, where the contribution of aharmonic terms become significant[6]. This means greater errors are expected when temperature is increased.
Questions
What is the physical origin of thermal expansion ?
The data obtained suggests the following can be seen as the origins:
- The increase in number of energy levels occupied.
- There is a small increase in maxima height of the DOS graphs as the temperature increased, from 0.074 to 0.082 in the temperature range of 0 K to 1000 K. This means at higher temperatures there is a greater number of states vibrating at a certain frequency, 360 cm-1. The change in volume of the unit cell over this temperature range is 2.25%.
- There has also been a significant change in the vibrational contribution to the free energy in the same temperature range, being from 0.1743 eV at 0 K to -0.2570 eV at 1000 K. This has caused the vibrational contribution to reverse from raising the free energy to lowering it.
- The increase in entropy of the solid.
- The increase in cell volume of the solid.
As the temperature approaches the melting point of MgO how well do the phonon modes represent the actual motions of the ions ?
In order to investigate this type of behaviour, the phonon modes and Gibbs free energy near the melting point were investigated, and this included temperatures 2600 K, 2700 K, 2800 K, 2900 K and 3000 K. There is a marked decrease in Gibbs free energy and increase in primitive cell volume. This is accounted by the increase in disorder as a phase transition occurs.
In a diatomic molecule with an exactly harmonic potential would you expect the bond length to increase with temperature ? Why does it increase in the solid when we are using a quasi-harmonic approximation ?
The vibrational frequency of a simple harmonic system depends only upon its reduced mass and spring constant, as it is undergoing simple harmonic motion. Therefore, the bond length will not change as the particle is excited to a higher energy level, in this case comparable to an increase in frequency of the bond vibration. The equilibrium bond length will remain unchanged. In the quasi-harmonic approximation the change in lattice parameter is taken into account as the temperature increases, but the particles are assumed to vibrate in harmonic motion at each length[6]. However, at each different volume the particle is still modeled as undergoing harmonic motion, so it is not accurate at high temperatures, for instance close to the melting point[6].
Molecular Dynamics Simulations
Another way of calculating the primitive cell volume would be to use molecular dynamics. This process applies Newtonian mechanics to the molecule at each time step. This was used to simulate the crystal structure from 300 K to near the melting point. Below are plots of unit cell volume and temperature. In the molecular dynamics simulation, the final volume increases more or less linearly, although there are some irregularities. This can be explained by considering it was the last value of the average volume which was used. In the quasi-harmonic calculation, it was possible to find an exact solution, where it is known for sure that the energy was minimized, because all of the derivatives of energy were zero. In the MD simulation, it is not possible to solve the equations analytically, and there will be an error term associated with each step in time, so the value of volume calculated fluctuates slightly. A small time step is required, since the Verlet leapfrog method is used to solve the equations of motion, and this has a error term of δt4, so a small time step will minimize the error[7].
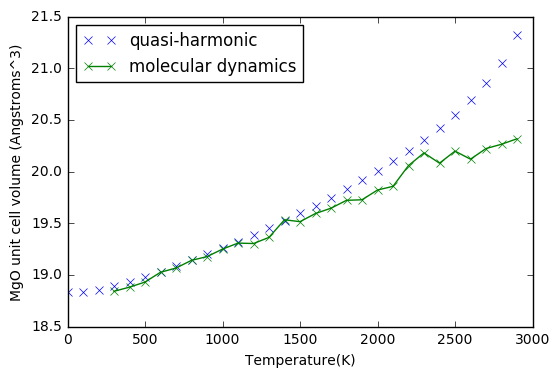
In order to compare the differences between quasi-harmonic and MD cell volumes, the cell volume needs to be converted so to represent the same cell in both cases. This is done by dividing the cell used in the molecular dynamics by 32, since it is essentially a multiple of the unit cell. The resulting graph shows at low temperatures and high temperatures, the volumes calculated by the two methods differ. In the region of ~600 K - 1000 K the volumes calculated by both simulations are nearly equal. Examining the gradient can give a value for the thermal expansion coefficient, and it is observed this value remains constant in the MD plot, whilst in the quasi-harmonic plot it increases with temperature.
It is known that at low temperatures the quasi-harmonic approximation is more accurate, whilst at higher temperatures, such as near the melting point, MD calculations are more accurate.
Questions
What would happen to the cell volume at high temperature in the quasi-harmonic approximation and in the MD ?
As seen from the graph, the cell volume would increase in a non-linear manner at high temperatures. The increase in MD simulations was linear, but there were greater fluctuations at higher temperatures.
Conclusion
This computational experiment has determined the nature of MgO vibrations in the crystal. The grid size found to give a reasonable DOS graph was found to be 12.The optimal grid size for performing quasi-harmonic calculations was determined to be 26 in this case. The behaviour of the two different methods, quasi-harmonic and MD were compared, where it is found that the MD simulation would give a value of α which remains nearly constant, whereas in the quasi-harmonic approximation this value will be lower at low temperatures and higher at high temperatures. The value of thermal expansion coefficient was calculated to be 2.8128×10⁻⁵ K-1.
There are factors not taken into account by this simulation. The presence of impurities was not considered, nor was the existence of grain boundaries, as the calculations have been restricted to a small number of cells, the structure of is assumed to be regular. The behaviour at the boundary of the MgO solid will therefore not be represented well by the data. It is usable on the innermost ions of the structure.
References
- ↑ 1.0 1.1 1.2 R. Hoffman, Agnew. Chem. Int. Ed., 1987, 26, 846-878
- ↑ 2.0 2.1 II-VI and I-VII Compounds; Semimagnetic compounds, Springer, Heidelberg, 1999, Vol 41B
- ↑ "Calcium oxide (CaO) crystal structure", Springer, Berlin, Heidelberg
- ↑ Y.Cho, R.E.Taylor, Thermal Expansion of Solids, ASM International, 1998
- ↑ , A.Erba, The Journal of Chemical Physics,2015,142,044114
- ↑ 6.0 6.1 6.2 J.D.Gale, A.L.Rohl, Mol. Simulat., 2003, 29(5), 291-341
- ↑ V. Brázdová, R. Bowler, Atomistic Computer Simulations: A Practical Guide, Wiley-VCH, Germany, 2013, 75-87


