Rep:MgO(wl5015)
Introduction
The aim of this experiment is to quantify the behaviour of MgO when heated. The thermal expansion coefficient can be calculated using α = 1/V0 (∂V/∂T)P. The thermal expansion coefficient α is an intrinsic property of a material which is also calculated. We applied two methodologies, Quasi-harmonic and molecular dynamics approximation to investigate the vibrational behaviour of MgO, and the two methods were compared.
The internal energy, lattice constant are calculated by computer at various temperature from 0 K to 1000 K. These properties were plotted against temperature to get the thermal expansion coefficient of MgO. The graph of vibrational frequency against wave vector k is called phonon dispersion. k defines the vector in reciprocal space:
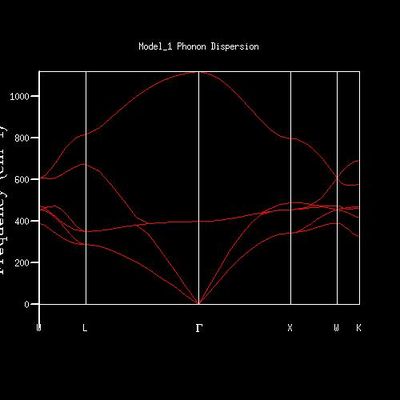
MgO molecule has two atoms in its primitive cell, and they can move in three dimensions. In the phonon dispersion diagram, is shows 6 branches, two types of phonons in w, y, z three directions. The distance between the boundaries at −π/a and π/a, which shows a oscillating pattern.
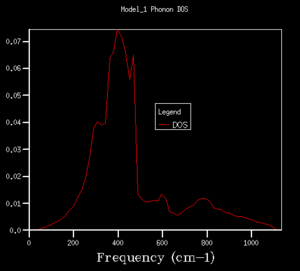
Vibrational density of states is related to the number of vibrational modes at each frequency. The grid size used to generate the DOS graph is a very important factor. The larger the grid size, the smoother the curve, and more populated of various states.
The quasi-harmonic approximation is treated as a collection of independent harmonic oscillators, and they do not interact. It is more adapted than a simple harmonic approximation, but there is limitation. The limitation is that it does not predict bond dissociation. QHA is used to calculate cibrational Helmholtz energy of MgO, with equation:
E0: internal energy j: zero point energy kbT term: temperature dependent free energy
Molecular dynamics approximation(MD) was used to predict the enharmonic behaviour at high temperature. Inside a supercell, which is a replica of conventional cell along a, b, c axis, it simulates the vibrations. The system contains atoms which are allowed to interact for a fixed period of time. Newton’s law,
can be used in the calculation.
Calculating the internal energy of an MgO crystal
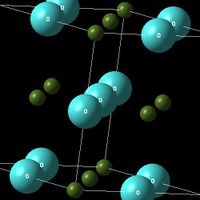
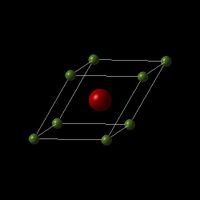
In the experiment, its crystal structure is described using a primitive unit cell, with the cartesian lattice vetors and cell parameters listing below:
| 0.000000 | 2.105970 | 2.105970 |
| 2.105970 | 0.000000 | 2.105970 |
| 2.105970 | 2.105970 | 0.000000 |
| a= 2.9783 | b= 2.9783 | c= 2.9783 |
| alpha=60.0000 | beta=60.0000 | gamma=60.0000 |
MgO crystal is a face-centered cube(fcc). There are 8 atoms in MgO conventional cell, and 2 atoms in primitive cell. The primitive cell contains one Magnesium ion (each Magnesium ion at the corner is shared between 8, 8*1/8=1) and one Oxygen ion (in the centre of the cube). The ratio of atoms in the conventional cell and atoms in the primitive cell is 4:1, and their densities are the same, which indicates the ratio of volume between them is also 4:1. The inter-atomic potential is 6.72119980 eV, and the total lattice energy due to the inter-atomic forces is -41.07531795 eV per primitive unit cell, which includes all the repulsion between same charged ions, and attraction between opposed charged ions. Include Shells option should NOT be selected during calculation settings. This is because each ion is considered as a non-polarisable hard sphere.
Lattice vibrations - computing the phonons
| path in k-space | kx | ky | kz |
|---|---|---|---|
| W | 1/2 | 1/4 | 3/4 |
| L | 1/2 | 1/2 | 1/2 |
| G | 0 | 0 | 0 |
| X | 1/2 | 0 | 1/2 |
| K | 3/8 | 3/8 | 3/4 |
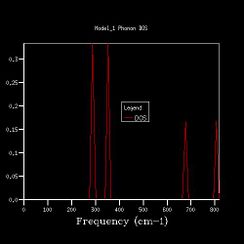
In Fig. , the 1*1*1 grid size gives 4 sharp peaks at 280 cm-1, 350 cm-1 ,670 cm-1 and 810 cm-1. The peaks at 280 cm-1 and 350 cm-1 have similar heights at 0.34, and the other two have similar heights at 0.17. The ratio between different ones is roughly 2:1.
The characteristics are found in the phonon dispersion graph as well. The point L intersects six branches at 810 cm-1, 670 cm-1, 350 cm-1,350 cm-1,280 cm-1 and 280 cm-1. The 350 cm-1 and 280 cm-1 are two sets of degenerated frequencies. The degeneracy frequencies correspond to the 2:1 ratio in the the 1x1x1graph.
The L point is 1/2 in kx, 1/2 in ky and 1/2 in kz; The density of states for 1x1x1 grid was computed for a single k-point. Thus the K point is 1/2 1/2 1/2.
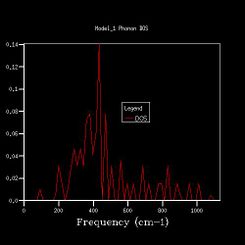
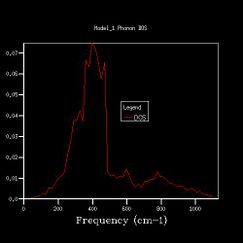
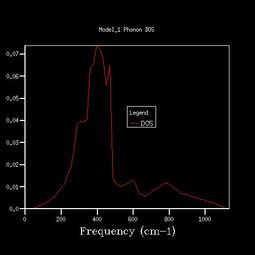
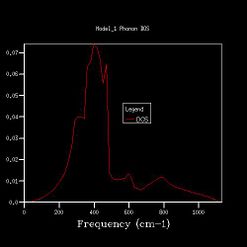
To get more k points, the density of states calculations were reran, and the shrinking factors were increased from 1x1x1, to 2x2x2, 3x3x3, 4x4x4, 8x8x8, 16x16x16, 24x24x24, 36x36x36, 64x64x64. The vibrational density of states diagrams of the other 8 grid sizes are shown below.
As we increased the shrinking factor, an obvious observation was increasing number of peaks at other frequencies. Up to 4x4x4 grid size, the peaks are discrete. When using 8x8x8 of higher grid size, the peaks become continuous, which means more possible vibrations are sampled, and more features appeared. Increasing the grid size means the graphs get more smooth. After 24x24x24, the change in shape of the higher grid graphs is not noticeable, which means the resolution of 24x24x24 is the minimum for the reasonable approximation to the density of states.
 |
 |
 |
 |
|---|---|---|---|
 |
 |
 |
 |
An opportunity to speculate
For a MgO, grid size of 24x24x24 is enough, but might not for other molecules. The minimum grid size depends on two factors: the size of the reciprocal space and the complexity of the phonon dispersion diagram. The reciprocal space is a*=2π/a, and the complexity depends on the number of atoms in the primitive cell, because more atoms means more branches appear in the graph.
For CaO, the lattice constant is 4.8108 Å[2], close to that of MgO, resulting a similar reciprocal space. CaO also has two atoms in its primitive cell. Thus the minumun grid size for MgO is appropriate for a calculation on CaO.
For Zeolite, its primitive cell contains more atoms resulting in more branches in phonon dispersion graph; the lattice size is 15.56 Å[3] which is approximate three times larger than that of MgO, 4.212Å, resulting in a smaller reciprocal space. Thus, a smaller grid size is enough to catch all the features from its phonon dispersion diagram.
Unlike zeolite, metal lithium gives a larger a*. It has one atom in its primitive cell, so only three branches in the phonon dispersion diagram. Lithium also has smaller lattice size, 3.51 Å[4]comparing to 4.212 Å of MgO. Lithium needs a larger optimal grid size to include all features in a density of states diagram.
Computing the Free Energy - The harmonic approximation
| Grid Size | Free Energy/eV | Difference in energy with
the previous grid size/eV |
Accuracy |
|---|---|---|---|
| 1x1x1 | -40.930301 | - | |
| 2x2x2 | -40.926609 | -0.003692 | |
| 3x3x3 | -40.926432 | 0.000177 | accurate to 1 meV |
| 4x4x4 | -40.926450 | -0.000018 | |
| 8x8x8 | -40.926478 | -0.000028 | accurate to 0.5 meV |
| 16x16x16 | -40.926482 | -0.000004 | accurate to 0.1 meV |
| 24x24x24 | -40.926483 | -0.000001 | |
| 32x32x32 | -40.926483 | 0.000000 | |
| 64x64x64 | -40.926483 | 0.000000 |
At given temperature 300 K, and defaulted pressure 0 GPa, the minimum free energy of the systems was calculated from the lattice energy and phonons (entropy and zero-point energy). The Halmholtz free energy is calculated for increasing grid size, and as the grid size gets larger, the free energy increases, and the difference in energy compared with the previous one gets smaller, which means the free energy converges to a specific value. After 24x24x24, there is no change in free energy, which is the same as the previous section.
The Thermal Expansion of MgO
| Temperature/K | Free Energy/eV | Lattice Constant/Å | Volume/Å3 | Volume per formula unit/Å3 |
|---|---|---|---|---|
| 0 | -40.90190628 | 2.986563 | 26.638882 | 18.83649 |
| 100 | -40.90147087 | 2.986657 | 26.64134 | 18.83827 |
| 200 | -40.90937738 | 2.987605 | 26.66672 | 18.85622 |
| 300 | -40.92812471 | 2.989390 | 26.71454 | 18.89003 |
| 400 | -40.95859417 | 2.991629 | 26.77461 | 18.93251 |
| 500 | -40.99943595 | 2.994135 | 26.84195 | 18.98013 |
| 600 | -41.04931542 | 2.99682 | 26.91423 | 19.03124 |
| 700 | -41.10711924 | 2.999643 | 26.99036 | 19.08507 |
| 800 | -41.16453319 | 3.002588 | 27.06994 | 19.26008 |
| 900 | -41.24301814 | 3.005635 | 27.152431 | 19.19967 |
| 1000 | -41.30853404 | 3.008784 | 27.23786 | 19.26008 |
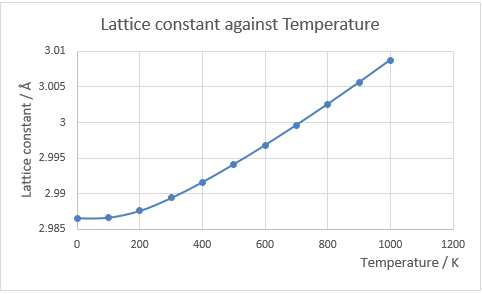
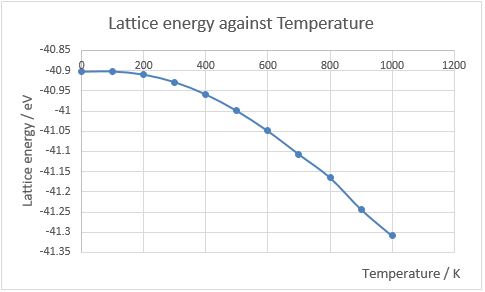
The graph of free energy against temperature is shown in Fig.13, and the plot of lattice constant against temperature is shown in Fig.14. When a material is heated, the kinetic energy of that material increases, which means the molecules will move more vigorously. Thus, each atom will take up more space which leads to expand. The thermal expansion coefficient is the rate of change in volume against temperature normalised by dividing its original volume. In this experiment, temperature is varied from 0K to 1000K in steps of 100K and the variation in the free energy and optimal lattice constant are computed by optimizing the structure (grid size: 24x24x24) at each temperature.
Initially at low temperature, the curve shows in Fig.13 behaves like a parabola, whose gradient increases as temperature increases. As temperature increases further, the gradient gradually becomes constant, which indicates at very high temperature, the free energy converges to a finite value. The reason for this behaviour is that when temperature is very low, between 0 K to 300 K, the Helmholtz free energy is dominated by zero-point energy. Above 300 K, the temperature-dependent entropy part of equation 1 dominates, and gives a smooth linear relationship at lower temperatures.
Fig. 14 shows that as temperature increases, the lattice constant increases, and above 400 K, the graph shows a straight line which has constant gradient. This behaviour is called thermal expansion.
From Fig. 15 (red line), the thermal expansion coefficient of a material is calculated to be:
= 3.213 x10⁻⁵ K-1.
The literature value of thermal expansion coefficient is 4.0 × 10⁻⁵ K−1[5] in the temperature range from 300 K to 1250 K, which is slightly larger than the computed value. Another literature value is 4.38x10⁻⁵ K-1[6] at 900 K. In a real molecule, as temperature increases and vibrational energy increases, the bond between atoms will eventually breaks. However, in the quasi-harmonic approximation, the bond between atoms will elongate to infinity.
Molecular dynamics
| Temperature/K | Cell volume/Å3 | Volume per formula unit/Å3 |
|---|---|---|
| 100 | 599.513295 | 18.73479 |
| 200 | 601.241595 | 18.78880 |
| 300 | 602.899441 | 18.84061 |
| 400 | 604.609431 | 18.89404 |
| 500 | 606.322864 | 18.947759 |
| 600 | 608.166535 | 19.00520 |
| 700 | 610.085241 | 19.06516 |
| 800 | 612.102518 | 19.12820 |
| 900 | 614.060747 | 19.18940 |
| 1000 | 615.63532 | 19.23860 |
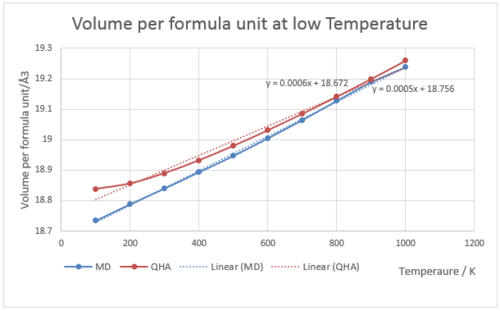
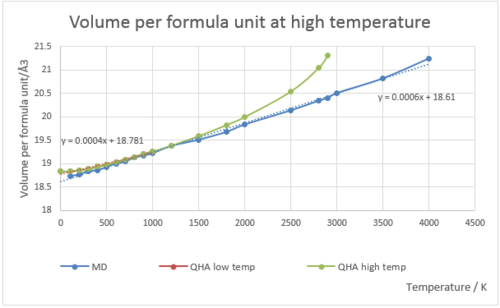
Fig.15 is the graph of volume per formula unit under QHA and MD respectively at low temperatures (0-1000 K). Fig.16 is the graph of volume per formula unit under QHA and MD respectively at high temperatures (1000-3000 K). In the graph of high temperature, few initial orange points were used to draw trend line and calculate thermal expansion coefficient (through gradient), because the points after that were deviate from the straight line at high temperature. points are the ones used to calculate the thermal expansion coefficient. It is clear in the graph that the line deviates from the best fit line at high temperatures. QHA assumes no bond-breaking at very high temperatures, so the line should always be linear. Thus the approximation is invalid at high temperatures.
Fig.15 shows the relationship between volume per formula unit and temperature under QHA and MD respectively at low temperature, and the gradients are indicated on the graph. The calculated thermal expansion coefficient under MD is 3.2, which is apparently larger than that of QHA. This number is closer to the literature value. From the graph, the QHA line is flat initially, and become linearly increasing afterwards. The MD shows very little scatter around the line of best fit, and is linear from beginning. In MD at low temperature, the zero-point motions and quantum nature of the vibrational levels are ignored. At low temperature, the appearances of the two lines are similar in trend and gradients.
Fig.16 shows the relationship between volume per formula unit and temperature under QHA and MD respectively at high temperature. For QHA, the gradient is calculated using first few points, because the deviation from the line of best fit afterwards. From the graph, apparently QHA fails to predict the real behaviour. However, MD is only appropriate below melting point of the material, because from the graph, the line is still linear after 3125 K, which is the melting point of MgO. Above 3125 K, the bonds will break.
For MD calculation, we use an infinite cell (super cell) whose cell size is very large. In order to compute accurate free energy, we should increase cell size to infinity. The reason for this is that in small cells, all atoms move in the same direction, which is not true in reality. When energy is given, all atoms will move randomly. The larger the cell, the system behaves more average. By increasing the cell size, the free energy should converge to a certain value, and the cell size will be the minimum for this calculation.
Conclusions
The first part of this experiment is analysis of the MgO primitive cell which contains two atoms. The primitive cell is a rhombohedron with cell parameter of 2.9783 Angstrom, and angle of 60 degrees. The internal energy of MgO is -41.07531759 eV per primitive unit cell. Then, the relationship between phonon dispersion and vibrational density of states is investigated using QHA. The grid size of 24x24x24 was minimum requirement which captures all important features of the phonon dispersion. The free energy increases and finally converges to -40.926483 eV.
The next step is to calculate the thermal expansion coefficient of MgO. Temperature range was set from 0 to 4000 K at the fixed grid size. Optimized Gibbs free energy and lattice constant are recorded. Initially at low temperature, curves are flat due to strong dependence of the zero-point energy, and after that, the temperature dependence term dominates. Thermal expansion coefficient is 2.6544 x10⁻⁵ K-1 between 0 K and 1000 K for QHA. Above 1000 K, QHA is unable to predict the behaviour because volume per formula unit vs temperature deviates from the best fit line and is no longer linear.
In the MD approximation, we use MgO supercell which contains 64 atoms rather than a primitive cell. In this larger cell size, atoms follow random motion and the calculated properties are averaged. The coefficient of thermal expansion is 3.2024 x10⁻⁵ K-1between both 0 K to 4000 K. In the graph of volume per formula unit vs temperature.
In conclusion, at low temperature, both approximations work fine to predict the molecular dynamics. At higher temperature, the MD approximation is the only valid method, because QHA fails to follow the linear relationship. Linearity is important in calculation of thermal expansion coefficient. From the two calculations, they indicate MD approximation is closer to literature value, which indicates that MD is more realistic.
References
1. Hoffmann, R. (1987), How Chemistry and Physics Meet in the Solid State. Angew. Chem. Int. Ed. Engl., 26: 846–878. doi:10.1002/anie.198708461
2. http://www.matweb.com/search/datasheet.aspx?matguid=225c134dec664c4a9934e76eed06f2a5&ckck=1
3. https://en.wikipedia.org/wiki/Faujasite
4. http://periodictable.com/Properties/A/LatticeConstants.html
5. A. S. Madhusudhan Rao and K. Narender, “Studies on Thermophysical Properties of CaO and MgO by γ-Ray Attenuation,” Journal of Thermodynamics, vol. 2014, Article ID 123478, 8 pages, 2014. doi:10.1155/2014/123478
6. S. K. Srivastava, P. Sinha, and M. Panwar, “Thermal expansivity and isothermal bulk modulus of ionic materials at high temperatures,” Indian Journal of Pure & Applied Physics, vol. 47, no. 3, pp. 175–179, 2009.
