Rep:MgO(em2015)
Introduction
The experiment aims to investigate the coefficient of thermal expansion α of a crystal of MgO, using quasi-harmonic and molecular dynamics approximations under RedHat Linux environment. This intrinsic property, α is calculated as 2.6544 x10⁻⁵ K-1 and 3.2024 x10⁻⁵ K-1 between 100 K and 1000 K for each approximation. The interface is DLV, a package for the visualisation of materials, structures and properties. The calculations are completed by a classical simulation program GULP in DLVisualize.
Energies, vibrations and lattice constants of MgO crystal are computed and are used to plot graphs to decide the thermal expansion coefficient. Vibrations are important in studying thermal properties, phase transitions, electrical properties,etc. The graph of vibrational frequency against wave vector k, generated by the computer, is called Phonon dispersion. The wave vector k is a vector which points in the direction of propagation of the wave. It defines the vector in reciprocal space and is calculated as following:
(1), where λ is wavelength.
The phonon dispersion diagram contains acoustical and optical branches, sharing a similar concept as band structures[1]. For the three-dimensional crystal lattice that has two atoms Mg and O in its primitive cell, the dispersion relations exhibit a total of six branches: two types of phonons in x, y, z directions. The space between the boundaries at −π/a and π/a are called Brillouin zone.
Vibrational density of states is also related. it is an average over all k-points yielding the number of vibrational modes at each frequency (the density of modes). The grid size chosen in the calculation has a strong impact on the shape: generally small grids give discrete DOS and large grids give continuous DOS.
The quasi-harmonic approximation(QHA) is a more adapted hypothesis than the harmonic approximation. The system is equivalent to a collection of independent harmonic oscillators and treats vibrations as if they did not interact. It is not appropriate at high temperatures because of phonon-phonon interactions[2]. It has limitation that it does not predict bond dissociation. QHA is used to compute vibrational Helmholtz energy of MgO, with equation as following:
(2)
where E0 is the internal energy; the sum of ħω for each k, j is the zero-point energy; and the last term is the temperature-dependent free energy, S is the entropy due to the vibrational degrees of freedom. Zero-point energy is the lowest possible energy that a quantum mechanical system may have.
The molecular dynamics approximation(MD) can capture the full anharmonicity at high temperatures. It simulates the vibrations as random motions of atoms inside a supercell. Atoms in primitive cells move perfectly in phase which is not physical. In fact, using a single unit cell is just the same as sampling the phonons at just the k=(0,0,0) point, this is the point at which all cells are in phase. The atoms and molecules are allowed to interact for a fixed period of time, giving a view of the dynamic evolution of the system. The system using classical Newton's Law:
(3)
In the calculation, energy is minimized as a function of the atomic position and of the lattice parameters.
An Initial Calculation for MgO on its Structure and Internal Energy
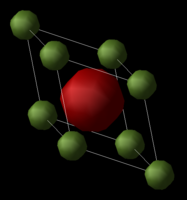
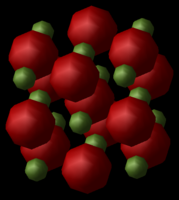
MgO crystal is a face-centered cube as shown on the right hand side. The conventional cell has eight atoms in it.
In the experiment, its crystal structure is described using a primitive unit cell, with cell parameters :a=b=c=2.9783Å ; α=β=γ=60.0000°. The primitive cell include one Magnesium ion (each Magnesium ion at the corner of the cell is shared by seven other cells and there are eight of this Magnesium ions) and one Oxygen ion(each Oxygen ion at the center of the cell is shared by one cell only and there is one of this Oxygen ions). The ratio of atoms in conventional cell and that in primitive cell is 4:1, which indicates that the ratio of volume between conventional cell and primitive cell is also 4:1.
The cell vectors of this cell are (in Angstrom):
0.000000 2.105970 2.105970
2.105970 0.000000 2.105970
2.105970 2.105970 0.000000.
The inter-atomic potential is 6.72119980 eV, and the total energy due to the inter-atomic forces should be -41.07531759 eV per primitive unit cell; it is the "binding energy" of the crystal - ie: the energy required to pull all of the ions of the crystal to infinite separation.
The Include Shells option should NOT be selected during calculation settings. This is because each ion is considered as a non-polarisable hard sphere here.
Phonon Dispersion, DOS and Grid size
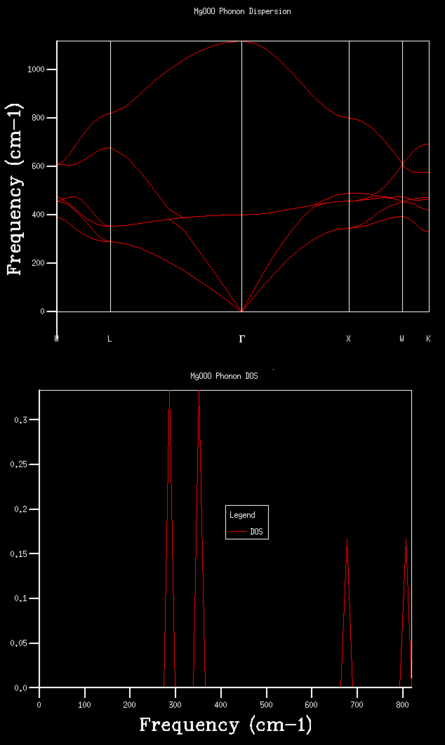
In order to visualise the phonon modes and understand the variation of frequencies with k, the phonon frequencies along a path in k-space is computed.
The essential point is that every possible vibration of the crystal can be labelled with a k-vector which is related to the direction and wavelength of the vibration.The special points along the conventional path in k-space are W-L-G-W-X-K. They are used because it is difficult to display the variation of the frequency over the full 3D k-space.
| path in k-space | kx | ky | kz |
|---|---|---|---|
| W | 1/2 | 1/4 | 3/4 |
| L | 1/2 | 1/2 | 1/2 |
| G | 0 | 0 | 0 |
| X | 1/2 | 0 | 1/2 |
| K | 3/8 | 3/8 | 3/4 |
As mentioned in the introduction, the phonon dispersion diagram of MgO should have six branches. The curve generated is in Fig. 3. The vertical axis is frequency of vibration and the horizontal axis represents the path in k-space. Γ is the origin in the reciprocal space, just like 0 in the direct space.
The shapes of vibrational density of states are predictable from the branches. In general, for a single-branch phonon dispersion curve, density of states curve is proportional to the inverse of the slope of phonon dispersion. The flatter the branch, the greater the density of states at that frequency. Additionally, the more curves pass a frequency, the greater DOS.
In Fig.4, the 1x1x1 grid size gives 4 very sharp peaks, each at 280 cm-1, 350 cm-1 ,670 cm-1 and 810 cm-1 roughly. 280 cm-1 and 350 cm-1 peaks have similar heights at 0.34, and 670 cm-1 and 810 cm-1 peaks are at 0.17. The higher peaks and the lower peaks have a approximate ratio of 2:1 in height.
Similar characteristics can be find in the phonon dispersion graph as well. The point L intersects six branches, each at 810 cm-1, 670 cm-1, 350 cm-1,350 cm-1,280 cm-1 and 280 cm-1. The two 350 cm-1 frequencies are degenerate at point L and so are the two 280 cm-1 frequencies. This, corresponds to the DOS diagram, is the 2:1 ratio in height.
The L point is 1/2 in kx, 1/2 in ky and 1/2 in kz.
The density of states for 1x1x1 grid was computed for a single k-point.
Thus the K point is 1/2 1/2 1/2.
If check with the log. file:
K point 1 = 0.500000 0.500000 0.500000.
This means that the speculation of the relationship between phonon dispersion diagram and DOS diagram is correct.
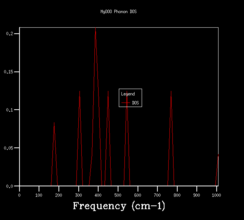
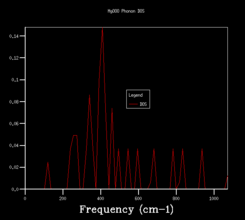
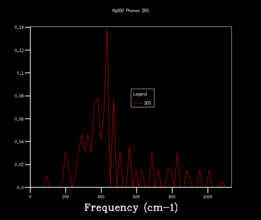
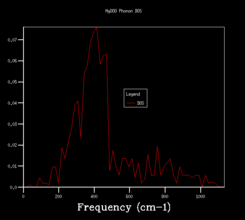
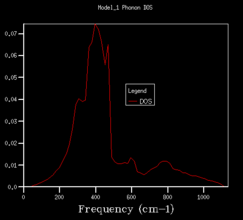
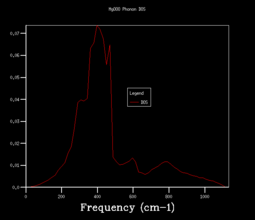
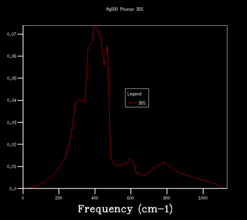
In order to use more k points, the density of states calculation is reran, and increase the shrinking factors from 1x1x1, to 2x2x2, 3x3x3, 4x4x4, 8x8x8, 16x16x16, 24x24x24, 36x36x36, 64x64x64. The vibrational density of states diagrams of the other 8 grid sizes are shown below.
When increase the grid size from 1x1x1 to 4x4x4, a very obvious observation is that there are more peaks at other frequencies. Most peaks isolate and discrete. When using a 8x8x8 grid size, the peaks become continuous. More and more of the possible vibrations are sampled and more features appear. When higher grid size is applied, the shape becomes more and more smooth and no apparent changes in the shape of the diagram after grid size 24x24x24.
This means that the 24x24x24 grid size is the minimum/optimum.
 |
 |
 |
 |
|---|---|---|---|
 |
 |
 |
 |
24x24x24 is the optimal grid size for MgO, but it is not necessarily for other molecules. Three crystals, CaO, Zeolite and lithium metal are compared with MgO and to speculate their optimal grid size. The minimum depends on two factors: the size of the reciprocal space and the complexity of the features of the phonon dispersion diagram. The reciprocal space is inversely proportional to the distance between atoms in the primitive cell:
(4).
And the complexity is decided by the number of the atoms in the cell. The more atoms, the more branches in the graph.
For the similar oxide CaO, its lattice constant is 4.8108 Å[3], close to that of MgO, resulting in an alike reciprocal space. CaO also two atoms in the primitive cell, just as MgO. Thus the optimal grid size for MgO is appropriate for a calculation on Calcium Oxide.
For Zeolite, which its primitive cell contains more atoms resulting in more branches, and larger lattice size (15.56 Å[4] compared to 4.212Å of MgO, conventional cell) resulting in a smaller reciprocal space. Thus a smaller grid size is enough to catch all the features from its phonon dispersion diagram. This is just opposite to a metal like lithium. It has only one atom in its primitive cell so only three branches in the phonon dispersion diagram. Lithium also has smaller lattice size(3.51 Å[5] compared to 4.212 Å of MgO, conventional cell), giving a larger a*. To put all factors together, lithium needs larger optimal grid size to include all features in a DOS diagram.
Free Energy in the Harmonic Approximation
Here the free energy is computed for increasing sizes of grid and its convergence to the infinite grid value monitored. This is to directly minimize the free energy of the system at a given temperature 300 K and the pressure will default to 0 GPa, where the free energy is calculated from the lattice energy combined with contributions from the phonons including the entropy and zero-point energy.
| Grid Size | Free Energy/eV | Difference in energy with
the previous grid size/eV |
Accuracy |
|---|---|---|---|
| 1x1x1 | -40.930301 | - | |
| 2x2x2 | -40.926609 | -0.003692 | |
| 3x3x3 | -40.926432 | 0.000177 | accurate to 1 meV |
| 4x4x4 | -40.926450 | -0.000018 | |
| 8x8x8 | -40.926478 | -0.000028 | accurate to 0.5 meV |
| 16x16x16 | -40.926482 | -0.000004 | accurate to 0.1 meV |
| 24x24x24 | -40.926483 | -0.000001 | |
| 32x32x32 | -40.926483 | 0.000000 | |
| 64x64x64 | -40.926483 | 0.000000 |
Generally speaking, as grid size increases, the free energy increases as well. However, the step of increase becomes smaller and the number converges. No changes after 24x24x24 grid size.
The optimal grid size speculation is similar to that in the previous section.
The Thermal Expansion Coefficient of MgO under Quasi-harmonic Approximation
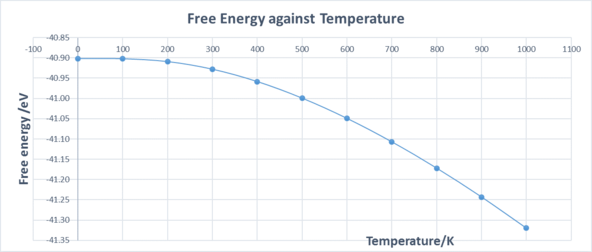
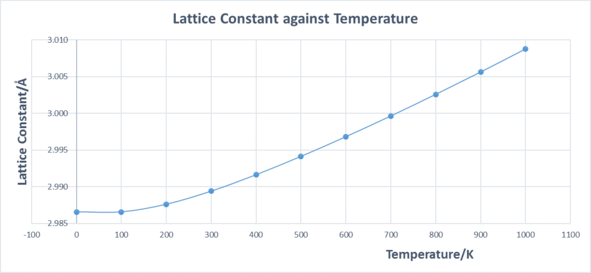
Temperature is a monotonic function of the average molecular kinetic energy of a substance. When a material is heated, the kinetic energy of that material is increased and it's atoms and molecules move about more. This means that each atom will take up more space due to it's movement so the material will expand. Materials which contract with increasing temperature are unusual. The thermal expansion coefficient is the rate of change of volume with temperature with respect to its original volume. In this experiment, temperature is varied from 0K to 1000K in steps of 100K and the variation in the free energy and optimal lattice constant are computed by optimizing the structure at each temperature. The numbers are extracted from the log. files and organized in the table 2.
| Temperature/K | Free Energy/eV | Lattice Constant/Å | Volume/Å3 |
|---|---|---|---|
| 0 | -40.90190628 | 2.986563 | 26.638824 |
| 100 | -40.90241965 | 2.986563 | 26.638824 |
| 200 | -40.90937738 | 2.987605 | 26.666716 |
| 300 | -40.92812471 | 2.989390 | 26.714542 |
| 400 | -40.95859417 | 2.991629 | 26.774613 |
| 500 | -40.99943595 | 2.994135 | 26.841955 |
| 600 | -41.04931542 | 2.996820 | 26.914231 |
| 700 | -41.10711924 | 2.999643 | 26.990362 |
| 800 | -41.17189187 | 3.002588 | 27.069936 |
| 900 | -41.24301814 | 3.005635 | 27.152431 |
| 1000 | -41.31984836 | 3.008784 | 27.237863 |
The graph of free energy against temperature is shown in Fig.13, and the plot of lattice constant against temperature is shown in Fig.14. Fig.13 contains a downward curve and its gradient increases as temperature increases. The gradient gradually becomes constant at higher temperatures, which indicates that the free energy has a fixed number at high temperatures. This is because at very low temperatures(0 K to 300 K), the Helmholtz free energy is dominated by zero-point energy. And after that, the temperature-dependent entropy part of equation 1 dominates and give a smooth linear relationship at lower temperatures. Fig. 14 contains an upward curve and its gradient increases as temperature increases. The line is straight after 400K with constant gradient.
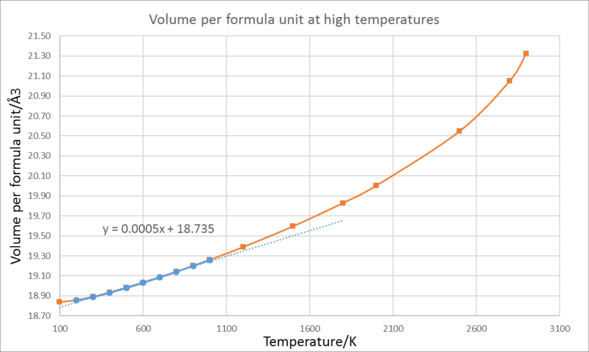
The coefficient of thermal expansion of a material is :
= 2.6544 x10⁻⁵ K-1. (5)
The literature coefficient of volume thermal expansion is 4.0 × 10⁻⁵ K−1[6] in the temperature range from 300 K to 1250 K in A. S. Madhusudhan Rao and K. Narender's paper, which is slightly larger than the computed value. Another literature value is 4.38x10⁻⁵ K-1[7] at 900 K in S. K. Srivastava, P. Sinha, and M. Panwar's work.
 |
 |
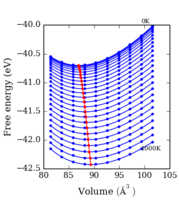
In the Morese potential graph, the bond between atoms will eventually break if temperature is high enough, which indicates that the equilibrium distance between atoms is independent of temperature. However. in the quasi-harmonic approximation, bonds will never break but lengthen to infinite.
In Fig.16 and 17, the center of mass are indicated in red in each approximations. That of quasi-harmonic approximation changes, meaning it's temperature-dependent. Changes in center of mass means that the material expands or contracts in a permanent way, unlike vibration. The expansion or contraction requires kinetic energy from increasing or decreasing temperature. And the center of mass of harmonic approximation is unchanged and therefore it is independent of temperature.
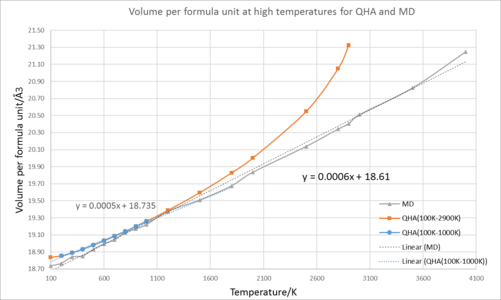
Fig.15 is the graph of volume per formula unit under QHA at high temperatures. The blue points are the ones used to calculate the thermal expansion coefficient. The It is clear in the graph that the line deviates from the best fit line at high temperatures. Since the QHA assumes no bond-breaking between atoms even at high temperatures, the line should be linear. Thus the approximation is invalid at high temperatures.
The Thermal Expansion Coefficient of MgO under Molecular Dynamics Approximation
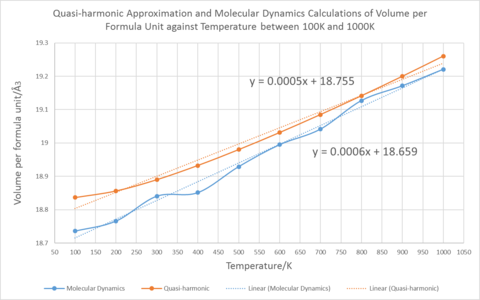
Fig.18 shows the volume per formula unit under two approximations between 100 K and 1000 K. The coefficient of thermal expansion under molecular dynamics approximation is 3.2024 x10⁻⁵ K-1, which is larger than that under quasi-harmonic approximation. However, this number is closer to the measured literature values. From the diagram, it is obvious that the shape of the line of quasi-harmonic is flat at first and becomes linear afterwards. The points from MD are scattered at either side of the best fit line but some points are further away from it. Molecular dynamics is not strictly valid at low temperatures because the zero-point motions and the quantum nature of the vibrational levels is ignored.
The difference between Fig18 and Fig.19 is the range of temperature. Fig.19 expand the temperature range to 4000 K and the MD line still shows well-scattered points at high temperatures. Therefore, at low temperatures, there is only slight difference between QHA and MD approximation; but, at higher temperatures, the QHA fails and the MD approximation works. The cell volume in the QHA is larger than expected and that in the MD approximation is anticipated using its thermal expansion coefficient. Nevertheless, the melting temperature of MgO is 3125 K, and bonds break after that point. The MD approximation shows that even after melting point of MgO, there is still no bond-breaking process. This indicates that MD approximation is only appropriate below melting point of the material, not beyond.
In order to compute an accurate free energy, the best situation is to use a cell size as large as possible, like an infinite cell for MD calculations. This is because in small cells, all atoms move in the same direction and distance when given an energy. Nevertheless, in reality, atoms move randomly and freely. A large cell gives the possibility to average out their random motions and give a unifying result. However, infinite cell requires infinite calculation and this is not achievable. Therefore, the alternative method is to start calculation with small sizes of MgO and then increase the cell size to see how the free energy goes. The conjecture is that the free energy should converge to a fixed number and there will be an optimal cell size. This size is a good choice to perform reliably MD for MgO. The idea is similar to the method used in the quasi-harmonic approximation.
Conclusion
The primitive cell of MgO crystal is a rhombohedron of side 2.9783 Angstrom with internal angle of 60 degrees, and the internal energy is -41.07531759 eV per primitive unit cell. Under the quasi-harmonic approximation, the correlation between phonon dispersion and vibrational density of states is investigated. After increasing the grid size, it is found that the 24x24x24 is the optimal and all features of the phonon dispersion graph can be plotted. The sequence of optimal grid size for three other molecules from small to large is Zeolite < CaO ≈ MgO < lithium, depending on both the distance between atoms and no. of atoms in the primitive cell. The same grid sizes are repeated for the free energy calculation at 300 K. The free energy increases and converges at 24x24x24 grid size as -40.926483 eV.
To calculate the coefficient of thermal expansion of a crystal of MgO, the independent variable temperature is set in the GULP from 0 K to 4000 K and the dependent variables, optimized Gibbs free energy and optimal lattice constant are recorded under the shrinking factor for the k-space 24x24x24. The trends are plotted against temperature. They are both flat at the beginning as the zero-point energy dominates and becomes linear because of the temperature-dependent entropy term. Thermal expansion coefficient is 2.6544 x10⁻⁵ K-1 between 0 K and 1000 K for quasi-harmonic approximation. That beyond 1000 K is unable to be calculated as the curve of volume per formula unit vs temperature deviates from the best fit line and is no longer linear.
Molecular dynamics approximation uses MgO supercell with 64 atoms instead of primitive cell. This is because that atoms follow the random motions and can then compute properties as time averages of their behavior. Newton's second law is used and the velocities will be random but scaled to produce roughly the target temperature between 0 K to 4000 K. The timestep is an important parameter which should be long enough for efficient calculations but shout enough to sample all the possible vibrations. The ideal size of the supercell should be as large as possible but this required time and resources, and this is not practical in the lab. The coefficient of thermal expansion is 3.2024 x10⁻⁵ K-1 between both 0 K to 1000 K and 0 K to 4000 K. In the graph of volume per formula unit vs temperature, most points well-scattered near the best fit line.
Therefore, at low temperature, the quasi-harmonic approximation is favoured because it gives perfect linear relationship but the molecular dynamics approximation fluctuates. At higher temperature, the molecular dynamics approximation excels the quasi-harmonic approximation because it still has a good best fit line and the other approximation becomes non-linear. The linearity is important as the coefficient of thermal expansion is the result of a constant(Vo) and the first power of a single variable(T). The thermal expansion coefficient calculated using molecular dynamics approximation is closer to the literature value than that using quasi-harmonic approximation. This indicates that MD is a more realist model.
References
- Hoffmann, R. (1987), How Chemistry and Physics Meet in the Solid State. Angew. Chem. Int. Ed. Engl., 26: 846–878. doi:10.1002/anie.198708461
- http://indico.ictp.it/event/7921/session/323/contribution/1273/material/0/0.pdf
- http://www.matweb.com/search/datasheet.aspx?matguid=225c134dec664c4a9934e76eed06f2a5
- https://en.wikipedia.org/wiki/Faujasite
- http://periodictable.com/Properties/A/LatticeConstants.html
- A. S. Madhusudhan Rao and K. Narender, “Studies on Thermophysical Properties of CaO and MgO by γ-Ray Attenuation,” Journal of Thermodynamics, vol. 2014, Article ID 123478, 8 pages, 2014. doi:10.1155/2014/123478
- S. K. Srivastava, P. Sinha, and M. Panwar, “Thermal expansivity and isothermal bulk modulus of ionic materials at high temperatures,” Indian Journal of Pure & Applied Physics, vol. 47, no. 3, pp. 175–179, 2009.
- S. P. Ong, S. Cholia, A. Jain, M. Brafman, D. Gunter, G. Ceder, and K. A. Persson, Computational Materials Science, 2015, 97, 209–215. doi:10.1016/j.commatsci.2014.10.037
- https://chem.libretexts.org/Textbook_Maps/Physical_and_Theoretical_Chemistry_Textbook_Maps/Map%3A_Physical_Chemistry_(McQuarrie_and_Simon)/05._The_Harmonic_Oscillator_and_the_Rigid_Rotator%3A_Two_Spectroscopic_Models/5.3%3A_The_Harmonic_Oscillator_is_an_Approximation

