Rep:MW4015.TS
Introduction
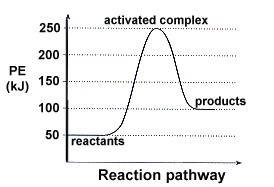
For a reaction to happen, reactants have to gain enough energy to overcome a barrier which is known as the activation energy, transition state is the state of reactants when they are on the top of barrier which is the highest energy point on reaction pathway. Most of time, we use a 2D diagram showing how energy changes with reaction coordinate as shown on figure 1(a)but actual potential energy surface can be explored to more dimensions for andiatomic reaction. In the reaction, there are a lot of motions of atoms that can effect potential energy, in another word, there are a lot of degree of freedom for reactants. That can be explained by vibrational motion, translational motion, rotational motion of atoms etc.
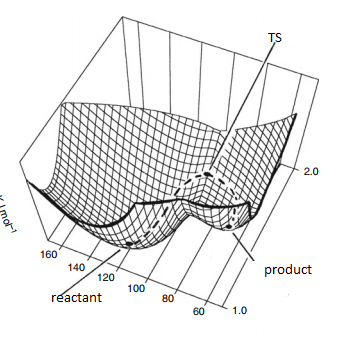
The surface is plotted against q1 and q2, q1 and q2 are order parameter. Order parameter is the coordination used in potential energy surface that can separate reactants and products with same probabilities. It can be bond distance or a mixture of various effects that determine reaction and sometimes it will be the sum of lots of degree of freedom. Potential energy surface is complicated and hard to get the full picture of the reaction. What we could do is to find a small part of the whole potential energy surface which contains reactants, products (local minimum) and transition state (saddle point) as shown on figure 1(b). Transition state is the maximum on the minimum energy pathway. Mathematically, we can recognize reactants, products and transition state because they all have 0 gradient as they are all stationary point.=0 Reactants, products and transition state can be distinguished by second derivative. . At reactants and products they have positive second derivative because they are minimum points, and in transition state, it can have negative value, because along order parameter, energy can goes down to products, the increase curvature gives a positive second derivative and decrease curvature gives the negative.
12:21, 1 December 2017 (UTC) Ok you need to be clearer here. You havent said how many dimensions have what cirvature at the TS. only 1 have negative curvature at and this is the reactuion coordinate
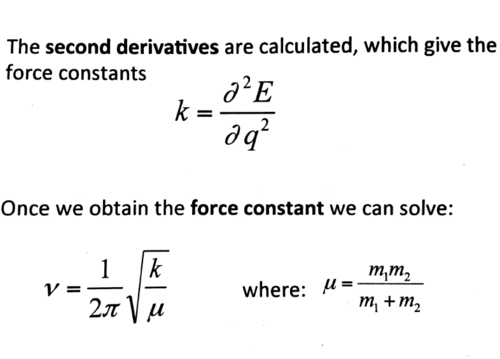
Frequency calculations can indicate transition state in Gaussview. When we take a macroscopic balls-and spring model, we can think of chemical bonds as springs so it is like a harmonic oscillator. We grasp the “atoms” and distort the model by stretching or compressing the “bonds” which increase the potential energy of the molecular model. Second derivative can be calculated as force constant in vibrational model and the formula was shown on the figure1(c) which allows second derivative relates with frequency calculation.
Nf710 (talk) 12:23, 1 December 2017 (UTC) Ok good brief intro but you could have gone into some details about the computational methods used.
Exercise1-Diels Alder Reaction
(Fv611 (talk) Great job! An almost perfect exercise, with an excellent MO and associated discussion.)

One classical Diels-Alder reaction as shown on Figure2 was investigated . One Cis-Butadiene molecule reacts with an ethylene to form cyclohexene. Cis structure of diene is compulsory otherwise orbitals of two reactants won't overlap and reaction cannot happen. The reaction pathway was investigated by providing structures of transition states, reactants and products. The geometry was optimised to minumum and energy was calculated, all these processes were done by Gaussview.
Optimisation
1)Optimise the reactants and TS at the PM6 level.
| Optimized Structure | ||||||||
|---|---|---|---|---|---|---|---|---|
| 1,3-butadiene | Ethylene | Transition State | ||||||
2)Confirm the correct TS with a frequency calculation and IRC

Vibrational frequencies give information about the point properties in potential energy surface which can shows whether the point is a saddle, maximum or minimum. Frequencies represent the curvature of the potential energy. The reactants and products are always local minimum point in potential energy surface, when changing the geometry from them, the energy will always go up which gives positive curvature. However, at transition state, it is a stationary point which means it is a maximum point on the minimum energy pathway but a minimum in potential energy respond to its geometry so it can have negative frequency. As shown on Figure3, One negative imaginary frequency was shown which means a saddle point was detected and geometry of transition state was obtained.
 |
 |
|---|
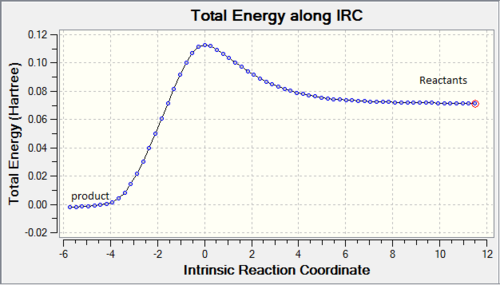
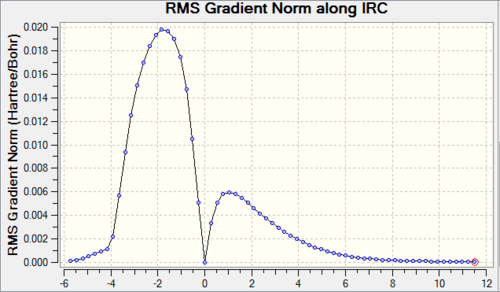
IRC proved we have a correct reaction and transition state geometry by showing the correct minimum energy pathway. As shown on Figure4(a), reactants go up to reach transition state then cross the barrier to form product which is the correct energy pathway. However, because the IRC was measured from transition state, the Gaussview did the calculation form highest energy point then went down, because both reactants and products had lower energy than transition state so Gaussivew did not know which was which so the calculation went with product first then reactants, the final diagram shows from product to reactant. RMS gradient Norm along IRC shows the gradient of energy line on Figure4(a). Products, transition state and reactants are max/min on energy IRC which all have gradient of 0. Comparing Figure4(a) with Figure4(b) three 0 points of coordiations of -6,0,12 on (b)all match the positions on (a).
3) Optimise the products at the PM6 level.
|
|---|
MO Analysis
| TS MO of HOMO-1,MO16,Anti-symmetrical | TS MO of HOMO,MO17, Symmetrical | TS MO of LUMO,MO18, Symmetrical | TS MO of LUMO+1, Antisymmetrical | ||||||||
| HOMO of alkene | LUMO of alkene | HOMO of Diene | LUMO of Diene | ||||||||
MO diagram illustration
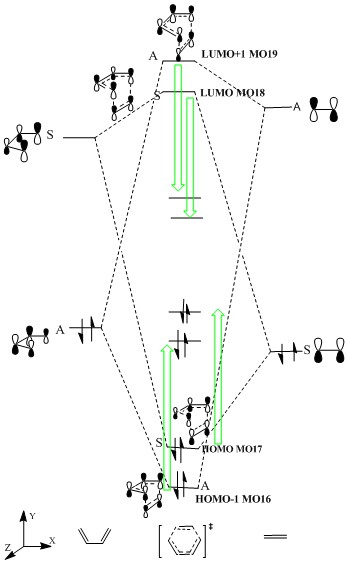
Figure5 is the MO diagram of Diels-Alder Reaction which provides the information of orbitals of reactants and transition state. All orbitals match with the JSmol and the labels are shown on both diagrams. Butadiene on the left has a smaller HOMO-LUMO energy gap than HOMO-LUMO gap of ethylene due to its electron-rich property. LUMO always has higher energy than HOMO because it takes contribution to anti bonding orbital. The destabilisation on antibonding is always larger than the stabilisation of bonding. The MO diagram (without green arrow) shows product MO or TS orbital without mixing which the same symmetry orbitals on reactants combine together to form correct molecular orbitals. All antibonding orbitals of the new combined orbitals are higher than those of reactants and the bonding orbitals are lower in Energy than those of reactants. However, the experimental data of transition state energy (where the green arrow indicate) shows that energy of LUMO and LUMO+1 of transition states are much lower than expected and they are even lower than LUMOs of reactants. Energy of HOMO and HOMO-1 are also higher than expected. That can be explained as following, at transition state, electrons try to organise themselves to correct geometries and spins so molecular orbitals are more delocalised, bonding orbitals will be more likely to mix with antibonding orbitals at transition state which decrease the energy of antibonding. At transition state, HOMO-LUMO energy gap would be smaller because of orbital mixing.
requirements for symmetry for a reaction/ orbital overlap integral
Only orbitals with same symmetry can overlap, that is defined by Woodward Hoffmann. He also states the total number of (4q+2)s + (4r)a must be odd to allow cycloaddition to happen, otherwise they are forbidden. 'q' and 'r' are integer here and 'a' is for antarafacial which means the component form new bonds on opposite faces at both end, 's' is suprafacial means new bonds on the same face at both ends. In this experiment the (4q+2)s + (4r) gives an odd number which means the reaction is allowed.[4]
   (4q + 2)s + (4r)a
   = 1 + 0
   = 1
   = thermally allowed reaction
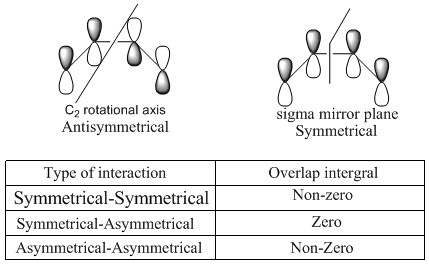
Directly seeing symmetry is an easier way to see whether reaction is allowed or not. Antisymmetrical and Symmetrical can be defined by their symmetry label shown on Figure6. In this experiment, symmetrical HOMO of alkene overlaps with symmetrical LUMO of diene producing symmetrical MO17(HOMO) amd MO18(LUMO) of transition state. Asymmetrical LUMO of alkene interacts with asymmetrical HOMO of diene form asymmetrical HOMO-1(MO16) and LUMO+1(MO19). The produced TS orbitals always have the same symmetry as the combining reactant orbital. Symmetries have to be matched and a combination of A ans S gives a 0 overlap integral.
Bond Length Analysis
| bond length | ||
|---|---|---|
 |
 |
 |
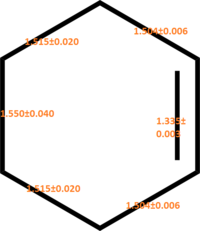 |
Sp2-Sp2 C=C bond length 1.34[6] Sp3-Sp3 C-C bond length 1.54 Sp2-Sp2 C-C bond length 1.47 |
Van der Waal Radius of C atoms:1.7A Van der Waal Radius of 2 C atoms:3.4A |
Bond length comparison
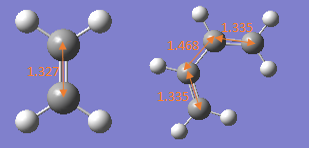
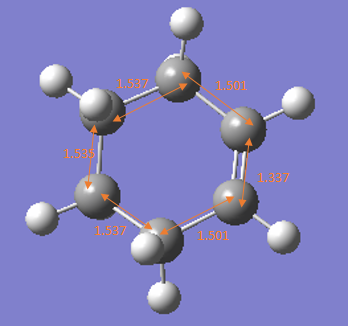
The bond length of reactants, products and transition states are shown on the table 3 above.
Reactant:In the reactants, all carbon atoms on diene and alkene are in sp2 hybridisation and all bonds are very close to reference value.
Transition state: 1. At transition state, the Sp2-Sp2 C=C double bond in ethene, butadiene increase and become longer than standard Sp2-Sp2 C=C bond length. That is because all these double are dissociated to single bond to form product and in product, they all become single bonds which are longer and hybridisation will change from Sp2 to Sp3. 2. Sp2-Sp2 C-C single bond in butadiene decreases at TS and becomes smaller than standard value, that is because its forming double bond in product and double bond has much shorter bond length than single bond due to additional pi bond which hold two carbon atoms together. 3.Van der Waal radius between 2 carbon atoms at TS are 2.115 which is much smaller than standard vander Waal radius 3.4A, that is because at transition state, the bond between two reactants are nor completely forming, they are attracting each other and forming partial bond which is weaker than real bond, the strong tendency of forming the bond makes the distance much smaller than 3.4A.
(Fv611 (talk) How does the length of the bonds being formed compare to a typical sp3-sp3 bond length? What can you conclude from that?)
Product: all bond lengths are similar to standard reference bond lengths.
 |
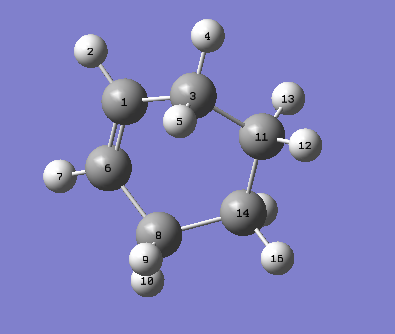 |
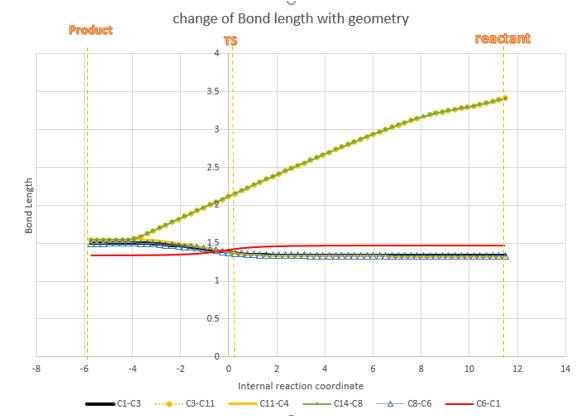
Figure8 is plotted using data extracted form IRC file, because Gaussview calculated reactants and products in opposite way so reactants are on the right and product is on the left. C11-C14 is the ethene on reactant and C3-C1-C6-C8 is the diene in reactant. Because of the symmetry, C3-C11 have same change as C14-C8, C6-C8=C1-C3, so as shown on the line chart. C3-C11(C8-C14) keep decreasing because they are the molecular distance between two reactants, during the reaction, 2 molecules get closer to each other and form bond. C1-C3(C6-C8) bonds increase at TS and further increase to product, that is because they change from Sp2-Sp2 double bond to Sp2-Sp3 single bond. C11-C14 also have the same change due to change of double bond to single, so it coincide with C1-C3(C6-C8). C1-C6 decreases because it changes from Sp2-Sp2 single bond to Sp2-Sp2 double bond. All these trend are explained on the line chart and on the bond length table above.
Vibrational Analysis
Vibration at Transition state |
The vibration frequency to reaction path is -949.5cm^-1, The formation is synchronous, as shown on the vibration, two terminal carbons tend to get close to each other.
Exercise2: Reaction of Cyclohexadiene and 1,3-Dioxole

Another Diles-Alder reaction was investigated in exercise 2, ring structure of 1,3-Dioxole allows 2 different geometries at transition state to form two products, Exo and endo products. Which one is more likely to form at room temperature will be investigated in this exercise .
Optimisation
1.Optimisation at B3lYP level of Endo and Exo TS and frequency calculations
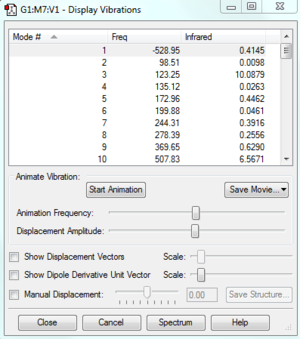
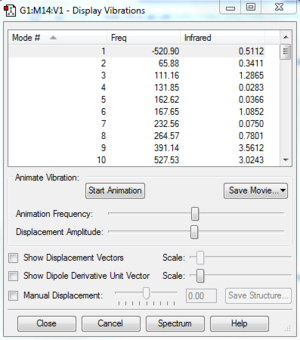
Whether the component has the correct geometry and energy state can be seen from frequency calculation. At transition state, there will be one imaginary frequency which proves it is a saddle point not a minimum, others like products and reactants all have positive frequencies which prove they are local minimum at potential energy surface.
MO analysis
|
|
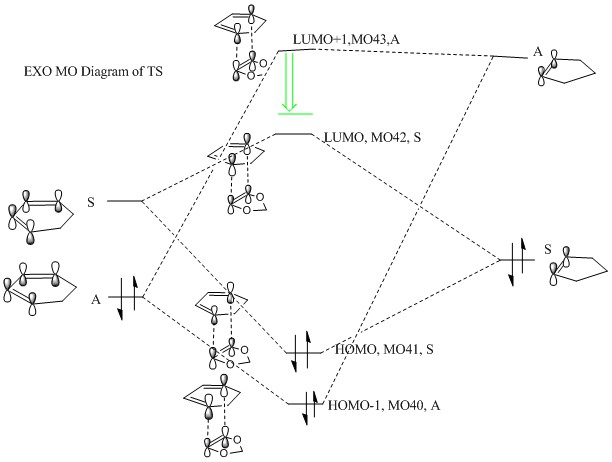
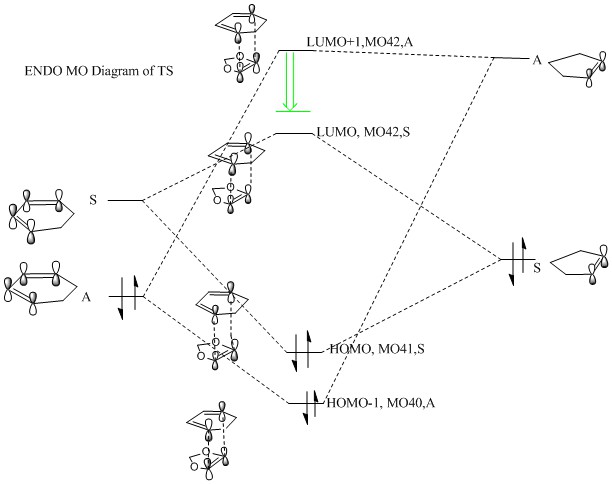
(Fv611 (talk) Your MO pairings are correct, but you didn't place the TS MOs according to their relative energies. Just as you have shown the TS antibonding MOs to be stabilised to a lower energy than the dienophile's LUMO, both the bonding TS MOs are higher in energy than the diene's HOMO.)
| MO structure of EXO TS |
|
|
|
| |||||||||||||||
|---|---|---|---|---|---|---|---|---|---|---|---|---|---|---|---|---|---|---|---|
| MO structure of ENDO TS |
|
|
|
| |||||||||||||||
|---|---|---|---|---|---|---|---|---|---|---|---|---|---|---|---|---|---|---|---|
Normal or inverse demand?
Both reactions are inverse demand. The difference between inverse demand and normal demand is which two HOMO-LUMO orbital between 2 reactants are closer in energy and give better interaction. The normal electron demand occurs when energy gap between HOMO of electron rich diene and LUMO of electron deficient dienophile are smaller compared with energy gap between LUMO of electron rich diene and HOMO of electron deficient dienophile. The inverse electron demand is the energy gap between HOMO of diene and LUMO of dienophile is larger than energy gap between LUMO of diene and HOMO of dienophile. Normally the inverse electron demand happen when when an electron poor diene or electron rich dienophile are involved because less electron rich diene has a lower energy LUMO so it would be closer to HOMO of dienophile and a electron rich dienophile increases the energy of HOMO which makes energy gap smaller. On the reaction here, as shown on the diagram above, the energy gap between LUMO of diene and HOMO of dienophile are closer in energy so they interact strongly to form HOMO41 of TS and LUMO 42 of TS. This proves they are inverse electron demand, and the dienophile here is 1,3-dioxole which is electron rich because of the existence of 2 oxygen atoms, oxygen atoms are electron donating group containing 2 lone pairs of electron, so more electron rich dienophile gives a higher energy HOMO which allow inverse electron demand to happen. Also shown on the MO diagram, only orbitals with the same symmetry can overlap.
Nf710 (talk) 12:26, 1 December 2017 (UTC) If youw anted to prove this quantitatively you could have done a single point energy calculation at the combined react geo and looks at the MOS there.
Energy barrier
| Components | Energy calculated PM6 / Hatress | Energy calculated PM6 / kJmol-1 | Energy calculated B3LYP (6-31G(d)) / Hatress | Energy calculated B3LYP (6-31G(d)) / kJmol-1 |
|---|---|---|---|---|
| Cyclohexadiene | 0.1169 | 306.8685 | -233.3244 | -612593.1932 |
| 1,3-Dioxole | 0.0523 | 137.2559 | -267.0700 | -701192.3934 |
| Sum of reactant energy | 0.0646 | 169.6126 | -500.3944 | -1313785.5870 |
| Exo-TS | 0.1389 | 364.6899 | -500.3292 | -1313614.3306 |
| Exo-Product | 0.0380 | 99.7034 | -500.4173 | -1313845.7737 |
| Endo-TS | 0.1379 | 362.1667 | -500.3321 | -1313622.1573 |
| Endo-Product | 0.0378 | 99.2571 | -500.4187 | -1313849.3733 |
| Method | PM6 | |
|---|---|---|
| Exo | Endo | |
| Activation barrier (Eact) /kJmol-1 | + 195.08 | + 192.55 |
| Reaction energy /kJmol-1 | - 69.91 | - 70.36 |
Nf710 (talk) 12:33, 1 December 2017 (UTC) Why have you not done this for B3LYP!!!!!!!!!!!!!!!!!!!
The activation barrier was calculated by the energy difference between sum of reactant energy and transition state of Exo/Endo. The reaction energy is calculated by the energy difference between Exo/Endo product and sum of reactant energy.
As shown on the table7 above, endo has lower activation energy value at PM6 level which means less energy is required for reactants to get to transition state so it is the kinetically favorable product. This can be explained by secondary orbital interaction at transition state. So endo product forms faster at room temperature. Endo is also thermodynamically favoured product becuse the Gibb's free energy and reaction energy are more negative which means endo product has lower energy than exo product. This happens due to secondary orbital explained below, this interaction only exist at endo product and has a big influence on energy contribution, in the product the effect will be larger compare with transition state becasue orbitals are closer to each other which leads to better overlap. Also as shown on the MO diagram, exo structure might has less steric effect because the bulk part on each molecules are far apart. However, according to Hammond's' postulate, the transition state is more like product, and in product secondary orbital interaction outweighs steric effect which lead to thermodynamically and kinetically more stable endo product.
12:31, 1 December 2017 (UTC) This is a valid argument, but there SOO is not really present in the products as if you look the pi conjugation of the diene is not there in the products. The reaction energy comes from the exo actually being more sterically hindered due to the presences of the sp3 bridge head carbon. contry to typical DA.
Secondary orbital interactions
|
|
|---|
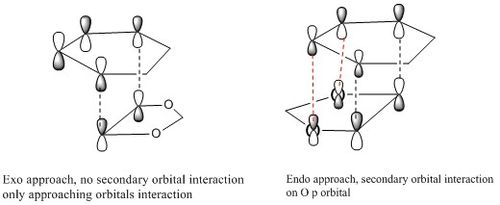
The secondary orbital interaction is more obvious on the diagram, as shown on the figure above, in exo, the p orbital on oxygen are far apart from diene so there is no interaction between them. In endo, the p orbital of oxygen can donate its lone pair to pi* antibonding on diene, it is a strong interaction that stabilise transition state and product. This can be seen on the HOMO of two transition state.
Exercise3.Diels-Alder vs Cheletropic
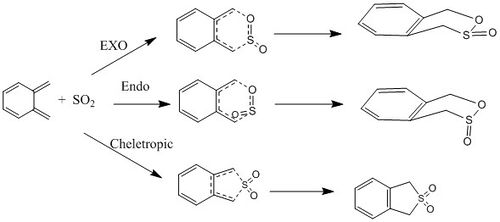
Optimisation of TS
| Optimisation of TS of EXO | Optimisation of TS of Endo | Optimisation of TS of cheletropic | ||||||
IRC analysis
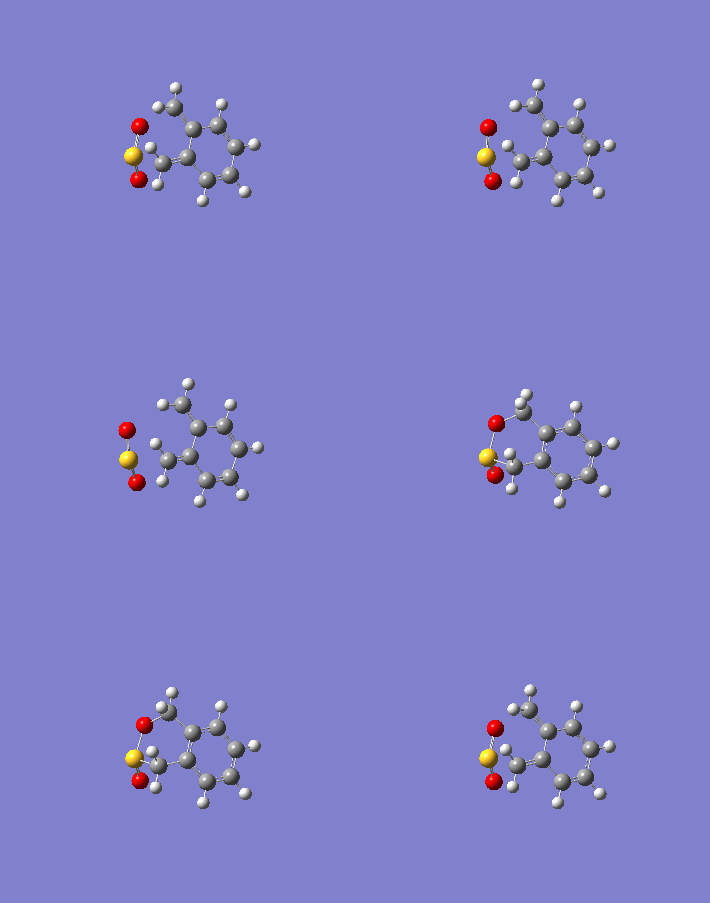
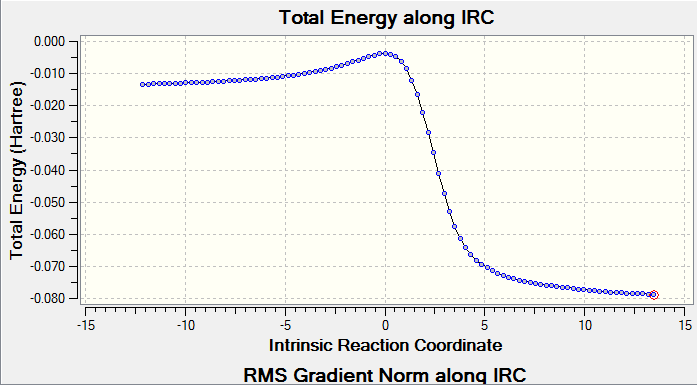
| Approach trajectory of endo product formation | Endo product formation IRC |
|

|
| Approach trajectory of exo product formation | Exo product formation IRC |

|
|
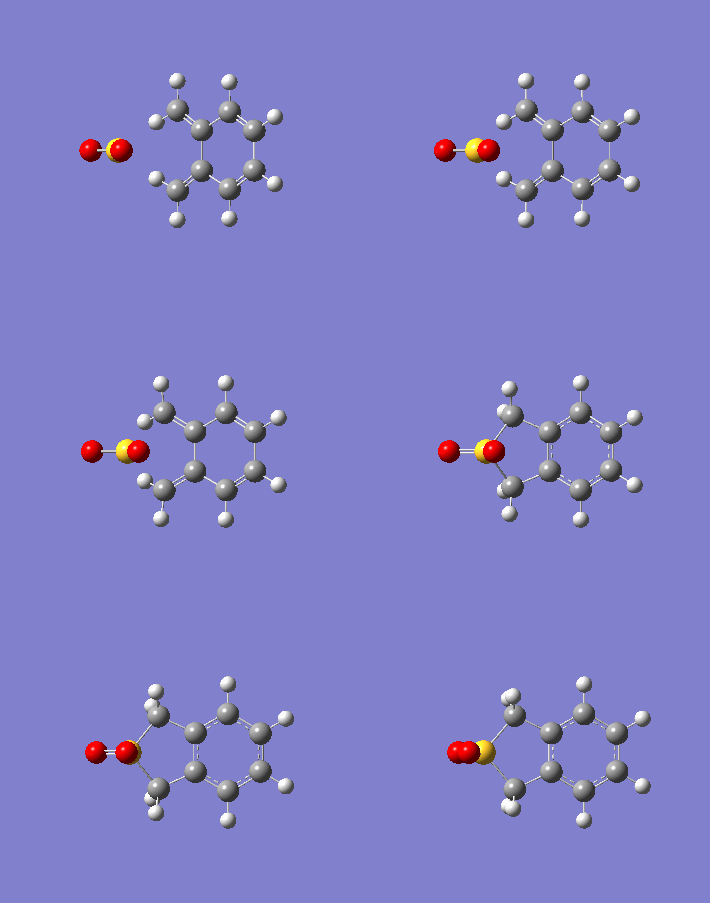
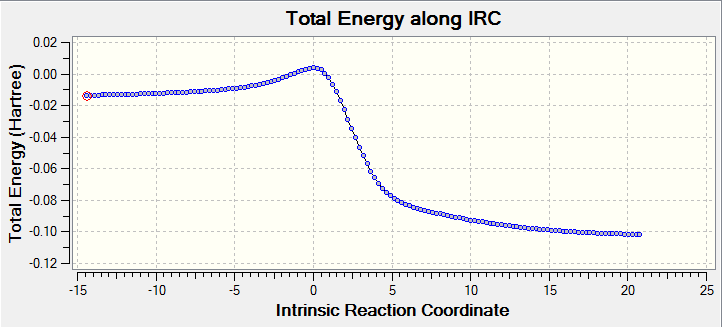
| Approach trajectory of cheletropic product formation | Cheletropic product IRC |
|
|
In the first trajectory, which is the formation of endo product, the IRC did the inverse calculation which calculate reaction process from products to reactants so the approach trajectory is product dissociation to reactant. All IRC and reaction trajectory are clear for how reactants approach each other and how energy changes associated with trajectory.
Reaction barrier and reaction energy
| Components | Energy/Hatress | Energy/kJmol-1 |
|---|---|---|
| SO2 | -0.118608 | -311.405327 |
| Xylylene | 0.178935 | 469.793878 |
| Reactants energy | 0.060327 | 158.388550 |
| ExoTS | 0.092077 | 241.748182 |
| EndoTS | 0.090561 | 237.7679236 |
| Cheletropic TS | 0.099062 | 260.087301 |
| Exo product | 0.021454 | 56.3274813 |
| Endo Product | 0.021699 | 56.9707288 |
| Cheletropic product | -0.000002 | -0.00525100 |
| Exo | Endo | Cheletropic | |
|---|---|---|---|
| Activation energy | 83.3598 | 79.3794 | 101.6988 |
| Reaction energy | -102.0611 | -101.4178 | -158.3754 |
As shown on the table 11, formation of the endo product has the lowest activation energy which means less energy is required for reactants to get into transition state, which makes it kinetically more favorable, under kinetic condition, formation of endo product will be a more favorable way. Cheletropic reaction has the most negative reaction energy which means the product is the most stable one. Cheletropic reaction is thermodynamically more favorable and under thermo condition, this pathway is more likely to happen.
Reaction profile
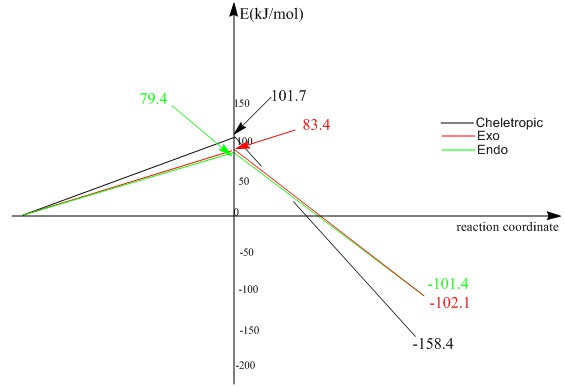 This graph is more obvious way than energy calculation. As shown on the graph, in endo/exo reaction, exo product is slightly more stable than endo product due to less steric repulsion. However, it is such a small effect in this reaction so the difference between two products are not large. Cheletropic product is much stable compare with Diles-Alder reaction product. The ring stain on cheletropic product is relieved by large S atom.
Xylylene is highly unstable. Look at the IRCs for the reactions - what happens to the bonding of the 6-membered ring during the course of the reaction?
Xylylene is highly reactive, it contains two cis-diene which can both react with alkene to undergo cycloaddition. In experiment 3, 3 possible reactions are shown with diene outside the ring. when 6-membered ring is forming, it becomes aromatic because both O and S contains lone pairs, which makes system more stable. Cycloaddition with diene inside the ring will be shown on the extension experiment.
Extension Experiment

Optimisation at PM6
| Optimisation of TS of EXO | Optimisation of TS of Endo | ||||
Reaction barrier and reaction energy
| Components | Energy/Hatress | Energy/kJmol-1 |
|---|---|---|
| SO2 | -0.118608 | -311.405327 |
| Xylylene | 0.178935 | 469.793878 |
| Reactants energy | 0.060327 | 158.388550 |
| ExoTS | 0.105055 | 275.821924 |
| EndoTS | 0.102069 | 267.98218 |
| Exo product | 0.067306 | 176.711916 |
| Endo Product | 0.065611 | 172.2616936 |
| Exo | Endo | |
|---|---|---|
| Activation energy | 117.433 | 109.594 |
| Reaction energy | 18.327 | 13.879 |
As shown on the table 11, the activation energy is much higher compared with any other reactions that using diene outside the ring as one reactants. This means xylylene is more likely to under reaction using diene which is outside the ring, this is kinetically more favrable. Also the reaction energy is positive which means products are less stable than reactants and ΔG is positive which makes reaction thermodynamically less stable. Both cases show the Diels-Alder reaction with ring diene is not favorable.
Conclusion
Gauss view optimise structures to get the minimum energy on all modes and allow reactions along minimum energy pathway being investigated. Reactants and products are minimum energy points with 0 integration and positive second order derivative. Frequency calculation along optimisation can always be used to detect whether we get correct geometry or not because it indicates second derivative, for transition state, there will be one imaginary negative frequency and that is the difference between TS and reactants. Only orbitals with the sane symmetry can interact and the combined MO will always have the same symmetry as reactants. Orbitals with different symmetry have 0 overlap integral. These can be seen from MO diagram, MO diagram also indicates electron demand , when LUMO of diene and HOMO of alkene is closer in energy compare with HOMO of diene and LUMO of alkene, this reaction is inverse demand, in Diels-Alder reaction, inverse demand is more favored, It can be explained by electron deficiency because the energy level can be effected by it. Energy calculations of activation energy and reaction energy allow us to predict thermodynamically more favourable reaction and kinetically more favourable reaction. Endo in [4+2] DA reactions are thermally and kinetically more favourable due to smaller activation and reaction energy. Also when regioselectivities occur like exercise 3 and extension experiment, energy calculations can always be used to see which reaction is more likely to happen, in exercise 3 cheletropic reaction is more likely to happened in thermo condition with diene outside the ring and endo reaction is more likely to happen in kinetic condition. So reactions can be investigated through all different aspects, and when relating all pieces of information together, like MO, energy , frequency .... we can understand more about the detail in reactions.
LOG.File
E1
| Species | Basis Set |
|---|---|
| PM6 | |
| Butadiene | File:OPTIMISEDIENE.LOG |
| Ethene | File:Mw4015ETHENEOPTPM6.LOG |
| Butadiene/Ethene TS | File:E1TSalkene+dienePM6.LOG |
| Cyclohexene | File:Mw4015E1OPTPRODUCTPM6.LOG |
| IRC | File:E1IRCTSPM6.LOG |
E2
| Species | Basis Set | |
|---|---|---|
| B3LYP | PM6 | |
| Cyclohexadiene | File:Mw4015631G CYCLOHEX.LOG | File:CYCLOHEXADIENEPM6.LOG |
| 1,3-dioxole | File:Mw4015.13AND631G.LOG | File:Mw4015.13PM6RUN.LOG |
| TS of EXO | File:Mw4015E2EXO631G.LOG | File:EXO TS PM6 WITHOUT EIGEN.LOG |
| TS of Endo | File:Mw4015E2ENDOTS631G.LOG | File:E2ENDOTSPM6.LOG |
| Exo product | File:PEODUCTEXO631G.LOG | File:PM6PRODUCT.LOG |
| Endo product | File:ENDO PRODUCT OPTMIN B3LYP.LOG | File:E2ENDOPRODUCT.LOG |
E3
| Species | Basis Set |
|---|---|
| PM6 | |
| TS of EXO | File:Mw4015E3.1EXOTSPM6.LOG |
| TS of Endo | File:Mw4015,E3,2ENDOTSPM6.LOG |
| TS of cheletropic | File:E3,3CHELETSPM6.LOG |
Extension
| Species | Basis Set |
|---|---|
| PM6 | |
| TS of EXO | File:Ext.MW4015EXOTS.LOG |
| TS of Endo | File:Mw4015tspm6.LOG |
References
- ↑ E.G. Lewars, Computational Chemistry,DOI 10.1007/978-90-481-3862-3_2, # Springer ScienceþBusiness Media B.V. 2011
- ↑ E.G. Lewars, Computational Chemistry,DOI 10.1007/978-90-481-3862-3_2, # Springer ScienceþBusiness Media B.V. 2011
- ↑ Atkins & De Paula Physical Chemistry, 9 edn., 2010
- ↑ Geerlings, Paul; Ayers, Paul W.; Toro-Labbé, Alejandro; Chattaraj, Pratim K.; De Proft, Frank (2012). "The Woodward–Hoffmann Rules Reinterpreted by Conceptual Density Functional Theory". Accounts of Chemical Research. 45 (5): 683–95. doi:10.1021/ar200192t. PMID 22283422.
- ↑ J. F. Chiang and S. H. Bauer, Journal of the American Chemical Society, 1969, 91, 1898–1901
- ↑ J. F. Chiang and S. H. Bauer, Journal of the American Chemical Society, 1969, 91, 1898–1901

