Rep:MOD:vl915
H + H2 system
What is Transition state (Question 1)
A local minimum on the potential energy-surface can be defined as the position where: ∂V(r1,r2)/∂(r1)= 0 and ∂V(r1,r2)/∂(r2)= 0 and where ∂2V(r1,r2)/∂(r1)2 >0 and ∂2V(r1,r2)/∂(r2)2 >0. The transition state is the saddle point on the potential surface of a reaction i.e. where ∂V(r1,r2)/∂(r1)= 0 and ∂V(r1,r2)/∂(r2)=0 and ∂2V(r1,r2)/∂(r1)2 and ∂2V(r1,r2)/∂(r1)2 are of opposite signs. This definition of the transition state shows that it is a point of which the coordinates cannot be defined with absolute precision. Thus all initial coordinates chosen for calculations might be very close to the transition state but cannot be the exact coordinates of the transition state because these would require infinite precision. It can thus be said that the transition state does not really exist.
(Fv611 (talk) 12:08, 29 May 2017 (BST) The definition of minimum and transition state are correct. However, you cannot say that "the TS does not really exist": just because you cannot pinpoint it exactly it doesn't mean it doesn't exist. Indeed, the system will go through its transition state given the right conditions.)
Estimate of transition state coordinates (Question 2)
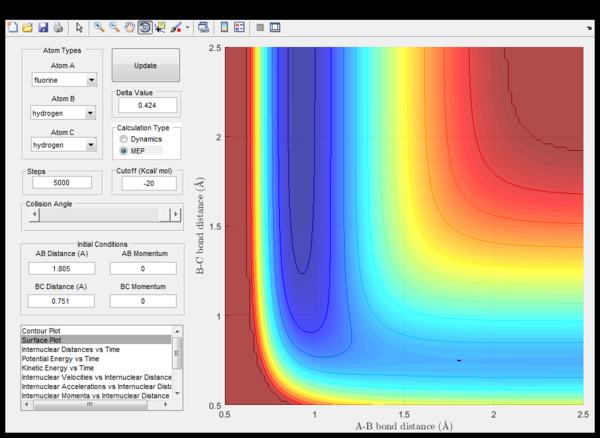
As dV(r1,r2)/d(r1) = -F = dp/dt the change of momentum at the transition state is zero. Thus at the saddle point, the total force on the particles is zero. According to Newton's second law the particles are not accelerated at the transition state. Consequently, if the starting point chosen are coordinates very close to the transition state no trajectory should show up, because the particles do not move. This can be seen in (fig.1). The lack of motion is also underpinned by the fact that internuclear distances don't change over time (fig.2).
 |
 |
Difference between Mep and Dynamic Plot ( Question 3)
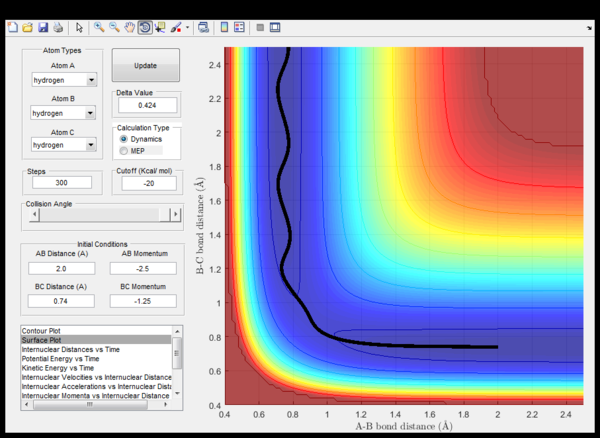
If the initial coordinates are shifted from the transition state and the initial momenta are set to zero, there will be some movement because sufficiently far from the transition state the change in momentum dp/dt is not zero, i.e there is a force acting on the particles. Thus a trajectory can be seen on the potential energy surface, either back to the reactant valley or down the product valley. This can be seen in fig. 3 and fig. 4. Mep stands for Minimum Energy Path. The difference between the dynamic and the mep trajectory is that the latter is a straight line wheres the former is a wavy line. The mep trajectory is a straight line because the velocity is always set to zero in each time step which is why any extra vibrational energy is erased and the mep trajectory follows the ground of the potential energy surface. However, mep is not a realistic account of the motion.
 |
 |
(Fv611 (talk) 12:08, 29 May 2017 (BST) Correct, however "mep is not a realistic account of the motion" doesn't mean much without a context. The mep is a realistic account of the particle's behaviour if the energy of the system is kept to the minimum at all times.)
Not all Initial Conditions and Trajectories lead to Successful Reactions (Question 4)
| p1 | p2 | Reactivity | Comments |
|---|---|---|---|
| -1.25 | -2.5 | Sucessfull | (fig.5) Hydrogen A moves towards the non-vibrating hydrogen molecule (BC) collides with it, a vibrating hydrogen molecule (AB) forms while the C hydrogen moves away from the newly formed molecule. |
| -1.5 | -2.0 | Unscessfull | (fig.6) Hydrogen A approaches the vibrating hydrogen molecule, collides with it and migrates back from where it departed from while the hydrogen molecule maintains its vibration. |
| -1.5 | -2.5 | Sucessfull | (fig.7) Hydrogen A moves towards the vibrating hydrogen molecule (BC) collides with it, a vibrating hydrogen molecule (AB) forms while the C hydrogen moves away from the newly formed molecule. |
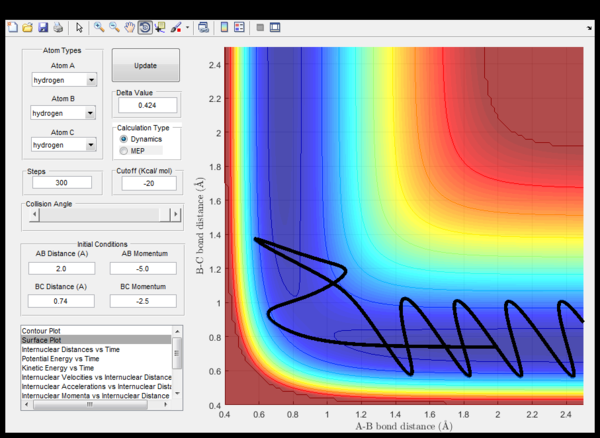
| -2.5 | -5.0 | Unsucessfull | (fig. 8) The incoming hydrogen A directly approaches a non-vibrating hydrogen molecule collides with it and forms a triatomic strongly vibrating activated complex. Eventually, hydrogen A cleaves and the trajectory energy decreases back down to the reactant energy valley, meanwhile the BC hedrogen molecule now vibrates. |
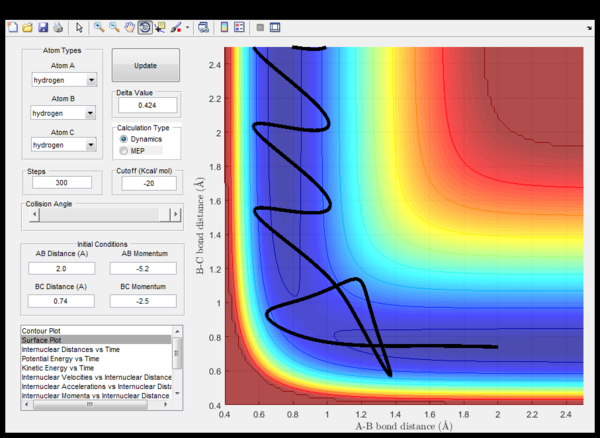
| -2.5 | -5.2 | Sucessfull | (fig. 9) Similar to what happens in the previous case unless this time, eventually hydrogen C cleaves and moves away from a vibrating AB hydrogen molecule. |
Table 1: Different initial momenta (with r1 and r2 fixed)
 |
 |
 |
 |
 |
(Fv611 (talk) 12:08, 29 May 2017 (BST) Correct, but the discussion is very short. Why are reaction 1 and reaction 3 different?)
Transition State Theory and the Calculated Results (Question 5)
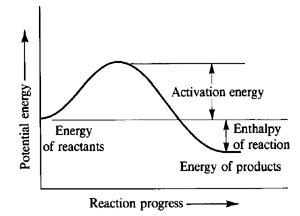
As a reaction event proceeds two molecules come into contact (collide) distort and begin to exchange moelcules. The potential energy of the molecules rises. If the molecues take up a configuration so that the energy rises over a certain energy barrier (the activation energy Ea) then the collision succesfully produces products. This activation energy is the potential energy difference between the initial reactant molecules at their initial positions and the transition state (see fig.10). As only a fraction of moelcules at a given temeprature (given by the Boltzmann distribution) have sufficient kinetic energy that a collision could increase the potential energy by Ea, only a fraction of collisions leads to products (see Arrhenius equation).[1] However, sufficent kinetic energy is not the only requirement for a sucessfull collision. Factors like the angle and duration of collision also have an impact as to whether a collision is successful or not. Moreover the form of kinetic energy the colliding molecules have (translation or vibrational) is relevant for the success of the reaction (see later). These factors are not taken into account by the Arrhenius equation which is why the temperature dependence of rates can be found to be "non-Arrhenius".[2] That sufficent kientic energy is not the only requirement for a succesful collision is mirrored in the calculated data in table 1. Equation (1) shows that the kinetic energy is proportional to the square of momentum and the reactants in the unsuccessful fourth reaction in table 1 have more kinetic energy than in the successful first one.
 |
KE = (1/2)P2/m (equation 1)
(Fv611 (talk) 12:08, 29 May 2017 (BST) You do not answer the question at all. Which parts of your discussion are the assumptions of TST? Which parts contradict TST? Where is the discussion on rates? Additionally, you should have referenced your picture, and probably removed the alternative caption as the reaction path has little to do with a "large clock tower")
F + HF system
Reaction Scheme and Activation Energies (Question 1 and 2)
F+ H2 → HF + H (reaction 2) is an endothermic reaction because the HF bond has a larger dissociation energy (ca. 500 kJ mol-1) than the hydrogen molecule (ca. 400 kJ mol-1). Thus the reaction path in fig. 10 also applies to this reaction.
(Fv611 (talk) 12:08, 29 May 2017 (BST) You are not referencing your values for the bond energies. Would have been better to relate your discussion to the shape of the potential energy surface for each reaction.)
Hammond's postulate gives information about the structure of transition states. It says that two states that interconvert directly and that are close in energy are also similar in structure.[3] As in a exothermic reaction (fig. 10) the transition state is energetically closer to the reactants, the potential energy surface of this reaction will be attractive with an early transition state (i.e. somewhere in the reactant valley). The approximate coordinates of the transition state where found following the same procedure as in question 2 (see fig.11).
(Fv611 (talk) 12:08, 29 May 2017 (BST) Correct. However you could have reported the coordinates of the TS explicitly.)
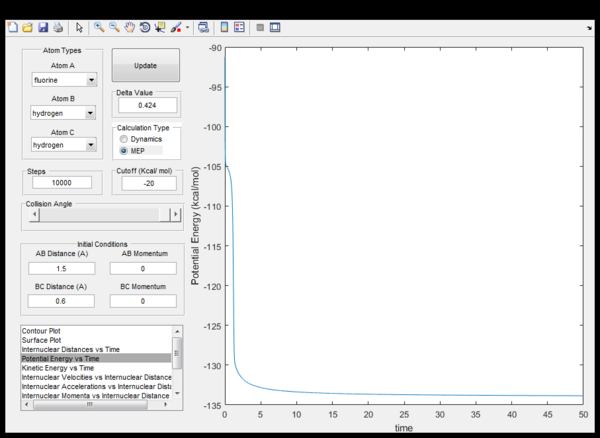
Fig. 11 also applies for the reverse, endothermic reaction of reaction 2 with a late transition state (at the same position as for reaction 2). The activation energies of the endothermic and the exothermic reaction can be determined by displacing the initial conditions from the quasi transition state so that the molecules gain a net change in momentum (dp/dt) which lets the trajectory move down either the product or the reactant valley. The activation energy can be read-off from a potential energy against time plot of the trajectory. The activation energy is the difference between the value at t=0 and a constant value reached towards the end in fig. 12 and 13. The trajectory calculations must be set to mep so that Ea can be read-off easily, otherwise this is inhibited by the strong vibrations of the products which are a consequence of energy-conservation. However, the results in table 2 are not fully accurate only as the initial coordinates are displaced from the transition state.
| Reaction | Activation energy/ kJ mol-1 | Fig. |
|---|---|---|
| exothermic | 1.05 | 13 |
| endothermic | 126 | 12 |
Table 2: Shows activation energies for the exothermic and the endothermic case.
(Fv611 (talk) 12:08, 29 May 2017 (BST) Why in kJ/mol?? As you don't report the energy of the products, reactants nor TS, it is very hard to figure out why your numbers are wrong.)
Potential Energy Surface and Energy Conservation (Question 3)
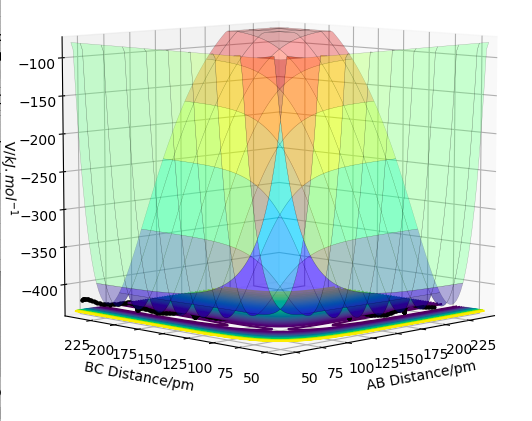
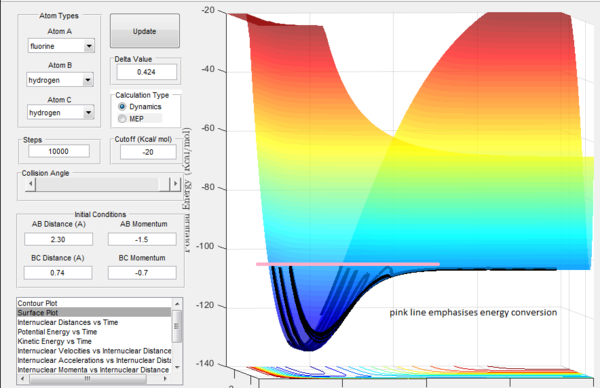
In an exothermic reaction the potential energy is set free by the formation of a stabler bond. The energy is released as heat into the surroundings. Releasing heat into the surroundings means releasing energy to the surroundings that increases the thermal (disordered) motion of the surroundings. On the potential surface (fig.14) it can be seen that the lost potential bond energy is converted into vibrational energy. This vibration of the products will cause disordered motion (thermal motion) in the surroundings.[4] The energy release as heat can be measured by calorimetry.
 |
(Fv611 (talk) 12:08, 29 May 2017 (BST) You are contradicting yourself. Does the hear release increase the motion of the system? Or is the lost potential bond energy converted into vibrational energy increasing the motion of the surroundings?)
Not all Kinetic Energies are Equally Efficient (Question 4)
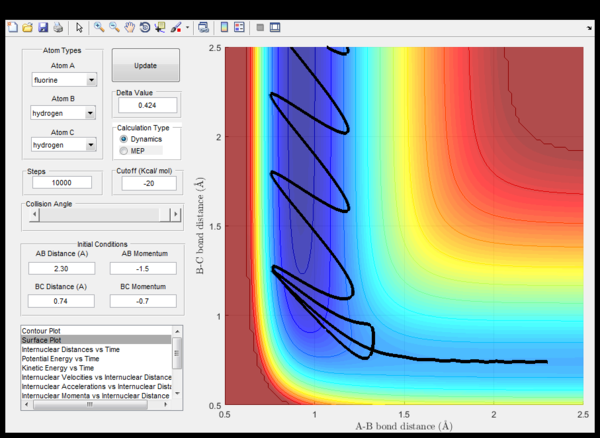
It is an empirical rule that for attractive potential energy surfaces (i.e. with an early transition state) a successful encounter involves reactants with mostly translational kinetic energy and results in vibrationally excited products. If the reactants are vibrationally highly excited the encounter is likely to be unsuccessful. Figures 15 and 16 are consistent with these empirical rules. By analogy the reverse must be true for repulsive potential energy surfaces (i.e. with a late transition state): the reactants should be vibrationally excited whereas the products should not, for an encounter to be successful.[2]
 |
 |
(Fv611 (talk) 12:08, 29 May 2017 (BST) Ok, but should have referenced the "empirical rule".)
References
- ↑ Atkins, P. W, Julio De Paula. Physical Chemistry. 8th ed. p. 809
- ↑ 2.0 2.1 Atkins, P. W, Julio De Paula,. Elements Of Physical Chemistry. 8th ed. p.886-889
- ↑ Clayden, Jonathan, Nick Greeves, and Stuart G Warren. Organic Chemistry. 2nd ed. Oxford: Oxford University Press, 2012. p. 807
- ↑ Atkins, P. W, Julio De Paula. Physical Chemistry. 8th ed. p.29

