Rep:MOD:order66
MgO Thermal Expansion
Introduction
Aim
This investigation aims at studying the thermal expansion of magnesium oxide crystal using quasi-harmonic approximation and molecular dynamics. The investigation will study the phonon modes generated and the relevant calculated results, make comparison and calculate the thermal expansion coefficient of MgO.
System
 |
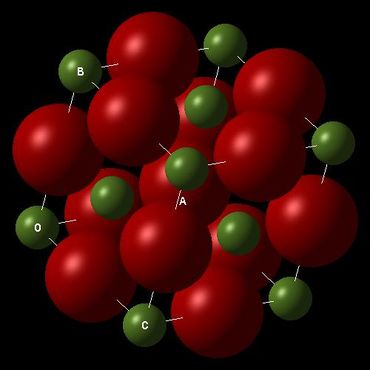 |
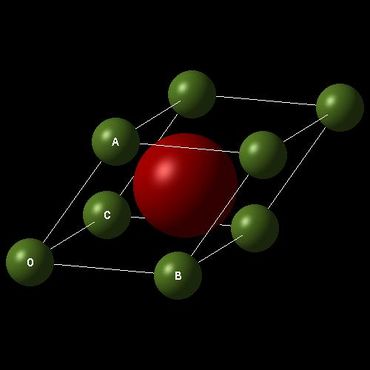
The crystal lattice of MgO has a FCC structure similar to that of NaCl and many simple metal oxides. The primitive cell of MgO has one atom of oxygen sitting in the middle of a rhombohedron and eight atoms of magnesium on all eight corners which contribute to 1/8 * 8 =1 atom. The conventional cell has four times the size of a primitive cell and a supercell contains 32 times the size of a primitive cell. The difference in sizes will determine which cell type is the most appropriate for a certain computational method.
Methodology
Phonon Modes
In solid state physics/chemistry, a phonon refers to a collective periodic and elastic excitation/vibration of atoms or molecules. In a crystal lattice, vibrations can be generalised into vibrations of unit cells along x, y and z axis as 1-D chains (handout). Each vibration is characterised by its specific wavevector k, which can be represented by [1]. k value is also connected to vibrational frequency by equation: (1). Plotting all vibrational frequencies vs k value will produce a dispersion diagram which can then be used to generate density of state diagram, which is essentially showing how many states are present per energy level. The free energy of the system can be calculated using the following equation:
Quasi-Harmonic Approximation
The vibrations of unit cells are generalised into a quasi-harmonic approximation, which is based on complete harmonic approximation. Rather than being treated classically as a simple harmonic oscillator, the vibrational mode is described quantum mechanically so that zero-point energy is considered [2]. On top of that, electrostatic attraction/repulsion is introduced to the system because the particles in the lattice are largely purely ionic [3].
The quasi-harmonic model also enables the calculation of thermal expansion as the free energy is now made volume-dependent, due to the quasi-harmonic approximation and the contribution of volume towards the entropic term: (E_zp being zero-point energy).
Molecular Dynamics
Molecular dynamics is a method based on Newtonian mechanics to simulate particle movements. The method involves computing forces on atoms and solving to obtain new positions of all particles in a crystal and the system will gradually reach equilibrium[4] . The molecular dynamics approach is essentially simulating the real vibrations inside a crystal classically, which vastly differs from quasi-harmonic approach. The two approaches will produce significantly different results in certain conditions and the appropriate range of each method also differs.
Software
Linux platform was chosen over windows due to its efficiency in performing calculations. The lattice structure was displayed using DLV, which also helps with illustrating lattice properties. The calculations were performed using General Utility Lattice Program (GULP).
Results and Discussion
Phonon Modes
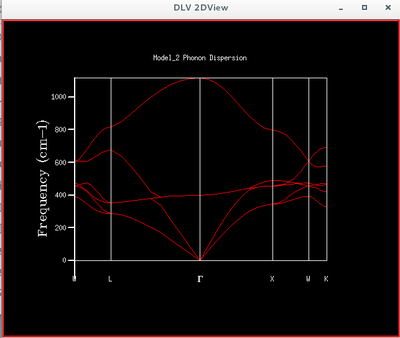 |
The phonon modes of MgO lattice in k-space along the conventional path is simulated by GULP to support the calculation of free energy by quasi-harmonic model. The dispersion curves are formed by sampling the frequency at each k value and together they form the band diagram of MgO lattice.
Density of States (DOS)
The density of states is defined by , i.e. distribution of states between energies. It can be roughly described as a 90 degree rotation of a dispersion diagram, because each point on a dispersion curve is a state defined by its k value and frequency, i.e. energy. This is to say, the flatter the dispersion curve, the higher the density of states, i.e. more states on the same energy level.
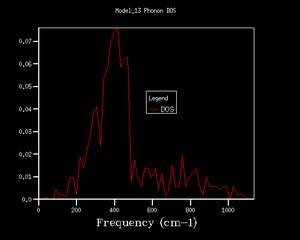
For the 1*1*1 DOS, the peaks are located near 280, 350, 670 and 810 cm-1 and these correspond to point L in the dispersion curve. To obtain a reliable display of DOS, input shrinking factors are varied until the resulted density of state diagram shows all necessary details because the shrinking factor is the number of k values computed within a brillouin zone. Larger shrinking factor will naturally give more data points within the brillouin zone and hence more details about the density of states. The DOS obtained showed a decent amount of consistency and details since 16*16*16 grid size.
Free Energy Calculation by Harmonic Approximation
| Shrinking Factors | Phonon Helmholtz Free Energy (eV) | Difference compared with grid size 32^3 (meV) |
|---|---|---|
| 1x1x1 | -40.930301 | 3.818 |
| 2x2x2 | -40.926609 | 0.126 |
| 4x4x4 | -40.926452 | 0.033 |
| 8x8x8 | -40.926478 | 0.005 |
| 16x16x16 | -40.926482 | 0.001 |
| 32x32x32 | -40.926483 | 0 |
As shown in the table above, the difference between two consecutive Helmholtz Free Energy steadily decreases as the shrinking factor grows. A 2*2*2 grid is sufficient for accuracy to 0.5 meV and a 4*4*4 grid is decent enough for 0.1 meV accuracy.
The change in free energy when different shrinking factors are used is due to the addition of more details with increasing number of shrinking factor, due to the reason that energy is computed by summing up the energy related to each k value, and the shrinking factor directly changes the number of k values sampled during calculation.
The MgO model simulated above would be suitable for computing properties for crystals of similar structures such as most simple oxides as they mostly have fcc structure and comparable lattice parameters and hence similar brillouin zone and naturally k values. However, simulating other crystal structures that drastically differ from MgO while still using MgO model will be largely inaccurate as they will take different spatial arrangement in reciprocal space and hence different k values. For example, Faujasite type zeolite has a large cubic unit cell with a>24 angstrom[5] and hence has vastly different brillouin zone representation and can not be simulated using MgO model.
Thermal Expansion
 |
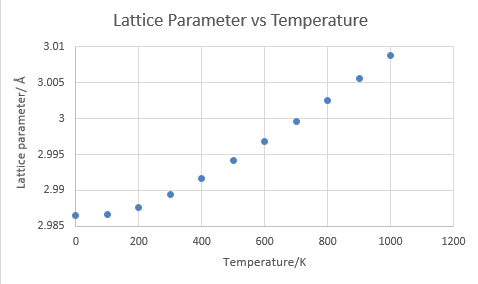 |
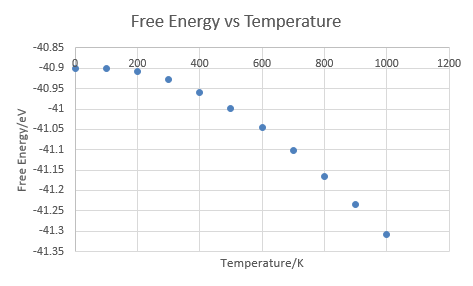
The free energy and lattice parameters were computed using quasi-harmonic approximation rather than harmonic approximation since harmonic approximation does not incorporate volume change and hence no thermal expansion can be simulated. Using quasi-harmonic model, which is a combination of harmonic oscillator, Coulombic repulsion, etc., the slight shift in equilibrium position of phonons will be simulated and only then can the thermal expansion, which is essentially the change in bond distance, be fully illustrated.
Free Energy
The Helmholtz Free Energy increases substantially with an increasing temperature as predicted by its definition: . The actual value is computed by The definition of Helmholtz Free Energy indicates that at low temperature, Helmholtz Free Energy is dominated by internal energy term and any change in temperature, which contributes to the entropy term, is insignificant. This explains why the curve of free energy vs temperature shows a flat curve at low temperature before becoming steeper. The entire curve illustrates how temperature, i.e. entropic term gradually becomes dominating in Helmholtz Free Energy.
Lattice Parameter
As temperature increases, the unit cells receive more energy and can therefore populate higher vibrational states and shift from their original equilibrium position. This shift in equilibrium position constitutes in the change in bond distance and hence the expansion of lattice.
As temperature increases near the melting point of MgO, it is obvious that the distance between two neighbouring atoms will reach the dissociation limit and the harmonic approximation will break down as the vibrating atom will no longer return to its equilibrium position but drift away. This is demonstrated by the fact that the calculation could not be achieved in 3200 K (melting point of MgO is 3125 degree Celsius) because the vibration is no longer possible.
Expansion Coefficient
The expansion coefficient is defined as: and in this study the expansion of MgO is obtained by applying this equation to the linear region of volume vs temperature diagram. The result differs slightly from literature value [6] as expected since the assumption does not include any consideration to the actual lattice structure of a crystal, which must contain a certain level of defects and impurities.
Molecular Dynamics
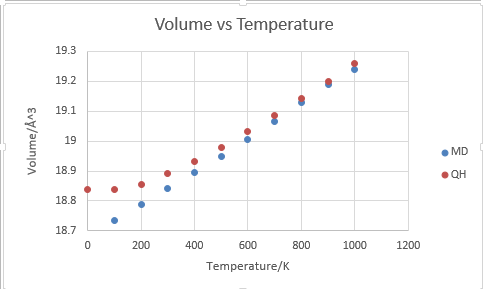
The thermal expansion predicted by molecular dynamics is generally in good agreement with that by quasi-harmonic approximation in higher temperatures, but the results do differ significantly in lower tempeartures. The difference can be rationalised by the fact that QH has taken into consideration of zero energy of a harmonic oscillator and the effect of zero energy is more pronounced in lower temperatures. As molecular dynamics approximation is totally Newtonian, it does not take into consideration of zero point energy when T=0 and hence has no zero energy contribution to the volume of the lattice. In higher temperatures, the contribution of zero point energy becomes insignificant.
It must be noticed that since MD is totally Newtonian and does not consider the dissociation of bonding as QH does, the cell volume simulated by MD will keep increasing with temperature even when the calculation by QH is no longer possible due to bond dissociation. A simulation run at 3200 K showed that cell volume had increased to 19.99 angstrom^3.
Conclusion
The phonon modes of MgO crystal were computed by GULP and its dispersion diagram and density of state probed at different grid sizes. The density of states were evaluated qualitatively and an appropriate grid size was consequently determined. Based on the established grid size, the free energy and lattice parameter of MgO lattice at different temperatures were computed using quasi-harmonic approximation and molecular dynamics respectively. The calculation demonstrated that both methods generally produce resembling results but would differ in lower temperatures when zero-point energy becomes significant and temperature becomes insignificant in determining free energy. The two methods also differ in higher temperature as quasi-harmonic approximation will break down after surpassing melting point of the crystal while molecular dynamics still stands.
Reference List
- ↑ A. Sutton, Electronic Structure of Materials, Oxford Science Publications, 2nd edn., 1993.
- ↑ Dove, Martin T. (1993). Introduction to lattice dynamics, Cambridge university press)
- ↑ T. S. Bush et al. J. Mater. Chem., 1994, 4(6), 831-837
- ↑ J. P. Mesirov, K. Schulten and D.W. Sumners, Mathmatical Applications to Biomolecular Structure and Dynamics, Springer, New York, 1996.
- ↑ Faujasite. Handbook of Mineralogy.
- ↑ M. Matsui, J. Chem. Phys., 91, 489 (1989)


