Rep:MOD:jh6215TransitionStates
Introduction
This investigation will explore the use of computational chemistry to model transition states and reaction profiles.
Potential Energy Surfaces and Transition States
A potential energy surface shows how the energy of a molecule changes with respect to one or more reaction coordinates. A transition state is most easily described with two reaction coordinates, however the reality is that there can be multiple reaction coordinates to form the potential energy surface in Hilbert space. The potential energy surface has 3N-6 dimensions, where N is the number of atoms in the molecule. For a potential energy surface with two reaction coordinates, stable reactants and products are at minima on the surface, here the first derivative of both reaction coordinates is 0 and the second derivative for both is greater than 0. A reaction pathway is a minimum pathway between two structures on the potential energy surface and the transition state is found at the maximum point along this minimum path. This is a saddle point, the first derivative of both reaction coordinates will still be 0 but the second derivative will be positive in one direction and negative in another.
Nf710 (talk) 12:26, 16 January 2018 (UTC) Negative in all others
Using multiple reaction coordinates allows the vibrations of a structure on a potential energy surface to be properly evaluated. For a reaction coordinate where the second derivative (corresponds to the force constant of a harmonic vibration) is positive, a normal positive vibration will be found in this direction. For a reaction coordinate where the second derivative is negative, a negative or imaginary vibration will be found as the computer models the vibration oscillating over a maximum. Therefore, a single negative vibration is an indication of a saddle point and a transition state.
Nf710 (talk) 12:26, 16 January 2018 (UTC) Good understanding of the fact we work in a Hilbert space. be get the second derivatives by looking at the eigenvalues of the Hessian matrix. (Matrix of second derivatives).
Computational Methods[1]
There were 2 computational methods used in this experiment: the semi-empirical PM6 and the DFT B3LYP/6-31G(d). Both utilise Hartree-Fock theory, which creates a set of optimal occupied orbitals in order to calculate the Slater determinant of the ground state. Other unoccupied orbitals are used depending on the basis set chosen. The Slater determinant is used to solve the Schrodinger equation (below) and find the Hamiltonian. The energy of each point on the potential energy surface can be found using this method.
Schrodinger Equation
Slater Type Electron Density Model
Gaussian Type Electron Density Model
Linear Combination of Atomic Orbitals
Gaussian is called Gaussian because it uses multiple Gaussian functions (above) to model the Slater type function (above), which is a much better representation of electron density. Slater functions are very difficult to compute so multiple Gaussian functions are used to approximate it. A certain number of Gaussian functions are assigned to represent each atomic orbital.
Nf710 (talk) 12:32, 16 January 2018 (UTC) Good understanding here of the basis functions. You are correct. You need to be careful as you have used the Time dependent Schrodinger equation and Gaussian only solves the time independent one at each step of the optimization.
PM6 being semi-empirical uses experimentally determined approximations combined with the Hartree-Fock method to increase the calculation speed and reduce the computational cost.
The DTF B3LYP/6-31G(d) method uses a hybrid of exchange correlation from density functional theorem and exact exchange from the Hairtree-Fock method. The basis set here is given as 6-31G(d). The basis set defines how many terms there are in the LCOA and how many Gaussian functions represent each term. The higher the basis set the more accurate the calculation because more orbitals are considered to a greater accuracy. This method is able to accurately calculate experimental data.
Nf710 (talk) 12:32, 16 January 2018 (UTC) This is correct, B3LYP uses DFT to calculate most of the Hamiltonian and then the hybrid bit to do the exchange correlation.
In this investigation the PM6 method was always used before the B3LYP/6-31G(d) method to reduce the computational running time. B3LYP/6-31G(d) was only used for exercise 2 because the more accurate the computation the greater the run time.
Method of Finding the Transition State
The method used to find the transition states requires knowledge of the products and reactants. Either the products or the reactants are chosen to start with, the choice is made on which has the fewer molecules. This structure is then optimised to a minimum. The resulting structure is broken the smaller fragments corresponding to either the reactants or products by deleting the bonds linking the fragments and elongating them to resemble a transition state length bond. These elongated bonds are then frozen and the structure is optimised to a minimum again. This structure should be similar to the transition state, and so a transition state optimisation is run. The force constant is calculated 'once' to allow for a more accurate calculation of the transition state. Calculating the force constant 'always' would cause the calculation to run for significantly longer.
The transition state should now be found. To check for the correct formation of the transition state check that the single negative vibration resembles the bonds being made between the reactants and products.
Other methods were proposed but this method was the most accurate and was used throughout. It must be noted that 'opt=noeigen' was often used in the transition state optimisation to prevent Gaussian from stopping the calculation when more than one negative force constant was found.
Exercise 1 - Diels-Alder Reaction between Butadiene and Ethene
All calculations in this exercise were executed at the PM6 level. The method outlined in the introduction was used to locate the transition state. The product was optimised, the bonds between the reactant parts were then broken and frozen at a distance similar to that of the transition state. This structure was then optimised to minimum and a transition state calculation was then attempted on the result. In this case, this method worked first time and the transition state was found. Then, an IRC and frequency calculation were run. The reaction mechanism is outlined below in figure 1.
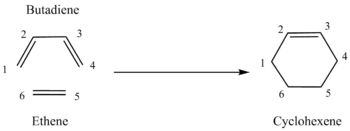
(Fv611 (talk) Great work across the whole exercise! Very well done.)
Molecular Orbitals
The molecular orbital diagram in figure 2 shows the interaction between the HOMOs and LUMOs of the reactants (the frontier molecular orbitals) to form the transition state. It is important to note that this molecular orbital diagram is only an approximation as other orbitals of the same symmetry can have an effect (through mixing) and only the pi systems of the reactants are drawn. However, this frontier molecular orbital model is a good model to visualise how the transition state forms and predict reactivity. The letters a and s correspond to antisymmetric and symmetric respectively.
To find the molecular orbitals from the results of the computational calculation, a single point energy calculation was conducted to the same accuracy as the optimisation. Using the checkpoint file from the optimization to visualise the orbitals and the single point energy calculation results to compare the energy between orbitals from different files.
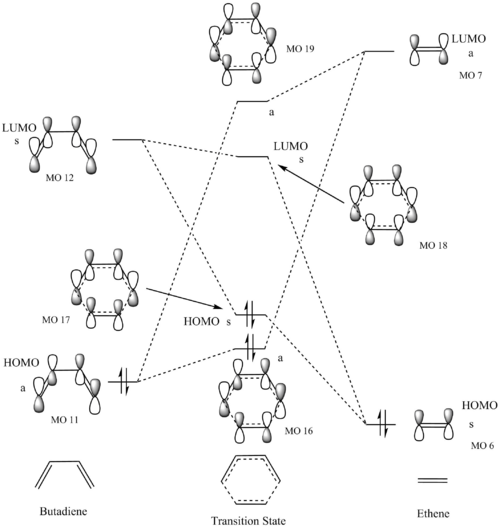
The MO numbers in figure 2 correspond to those in figures 3 and 4 so the complete computational representation of each orbital can be seen. Only interactions between orbitals of the same symmetry are considered because if the orbitals are not of the same symmetry the overlap integral (the net overlap between two orbitals) will be zero. This is because the constructive overlap is equal to the destructive overlap for two orbitals of different symmetry, which results in a net overlap of 0. For two orbitals of the same symmetry the overlap integral is non-zero because there is either greater constructive or destructive overlap. Therefore, a symmetric-symmetric interaction and an antisymmetric-antisymmetric interaction will result in a non-zero overlap integral and an antisymmetric-symmetric interaction will result in an overlap integral of zero.
This molecular orbital diagram represents normal electron demand, which will be discussed in more detail in exercise 2, because the LUMO of ethene and the HOMO of butadiene are closest in energy.
| Molecule | HOMO | LUMO | ||||
|---|---|---|---|---|---|---|
| Ethene | Relative Energy = -0.392 (MO 6)
|
Relative Energy = 0.043 (MO 7)
| ||||
| Buta-1,3-diene | Relative Energy = -0.359 (MO 11)
|
Relative Energy = 0.019 (MO 12)
|
| Molecule | Antisymmetrical Orbital | Symmetrical Orbital | ||||
|---|---|---|---|---|---|---|
| Filled Orbitals | Relative Energy = -0.328 (MO 16)
|
Relative Energy = -0.325 (HOMO - MO 17)
| ||||
| Unfilled Orbitals | Relative Energy = 0.031 (MO 19)
|
Relative Energy = 0.017 (LUMO - MO 18)
|
Carbon-Carbon Bond Length
The change in bond lengths between neighbouring carbons during the reaction was analysed. Figure 5 shows how the bond lengths change as the reaction progresses. The carbons shown in the key of the graph are the same as those numbered in figure 1.
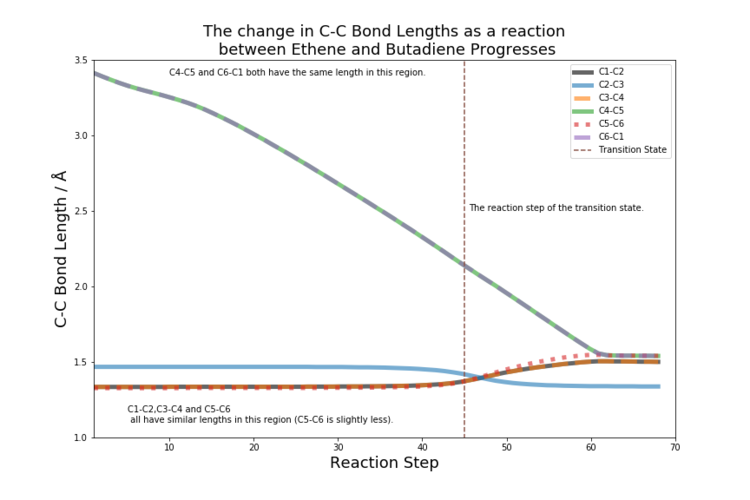
A single carbon-carbon bond is 1.54 Å and a double carbon-carbon bond is 1.33 Å. [2] The van der Waal's radius is 1.70 Å [3] and is the maximum range the atom's electron cloud is deemed to have significance. As the reaction progresses the double bonds lengthen to 1.54 Å. The carbons that join to form the ring C4-C5 and C6-C1 shorten 1.54 Å to from 3.4 Å (the first point at which they interact as it is within the maximum range of two van der Waal's radii). The transition state shows all bonds of similar lengths apart from C4-C5 and C6-C1, which are 2.12 Å and well within the range of van der Waal's interaction but the distance is too great for a single bond to be fully formed.
| Bond Length / Å | |||
|---|---|---|---|
| Carbons Involved | Reactants | Transition State | Products |
| C1-C2 | 1.335 | 1.380 | 1.501 |
| C2-C3 | 1.468 | 1.411 | 1.338 |
| C3-C4 | 1.335 | 1.380 | 1.501 |
| C4-C5 | 3.414 | 2.115 | 1.540 |
| C5-C6 | 1.327 | 1.382 | 1.541 |
| C6-C1 | 3.414 | 2.115 | 1.540 |
Vibration
The vibration below shows the formation of the products from the reactants. Vibrations such as this have a negative or imaginary wavenumber and signal that a transition state is likely to have been formed. This 'test' was used through the investigation to help confirm a transition state had been reached.
The vibration shows synchronous bond formation because both bonds that are formed during the reaction are formed simultaneously.
Exercise 2 - Pericyclic Reactions between Cyclohexa-1,3-diene and 1,3-Dioxole
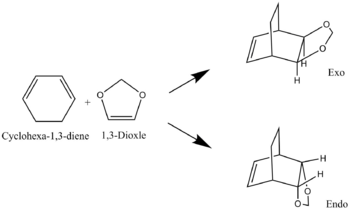
In this experiment the same method was used as previously mentioned, starting from the products and working backwards. In this case however, once the PM6 method had been run for each calculation a more accurate BL3YP/6-31G(d) method was to further optimise each structure. For the IRC calculation, it was run as PM6 calculation and the crucial frames (products and transition states) were optimised using BL3YP/6-31G(d) to ensure the the direct comparison between all structures was reliable. The reaction scheme for the two cycloadduct products is shown in figure 1.
Molecular Orbitals
(Fv611 (talk) As before, very good MO diagram. Would have been nice to add some discussion about the difference in relative energies between the exo and endo cases.)
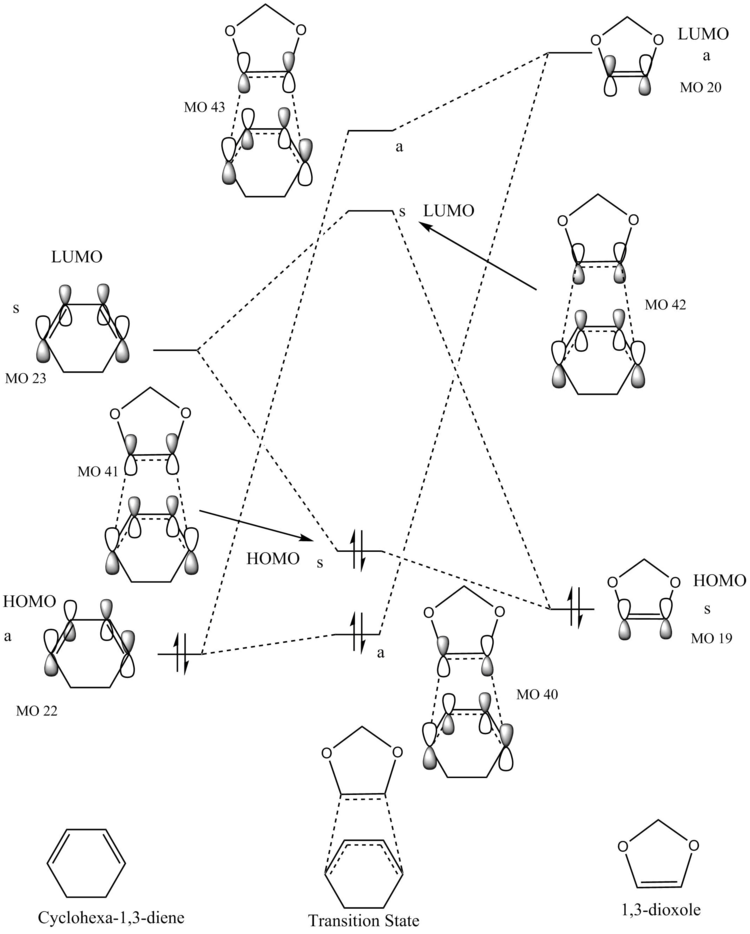
The MO numbers given in figures 8,9 and 11 correspond to those in the molecular orbital diagram in figure 12. The same method for constructing the molecular orbital diagram as before was used.
| Molecule | HOMO | LUMO | ||||
|---|---|---|---|---|---|---|
| 1,3-Dioxole | Relative Energy = -0.192 (MO 19)
|
Relative Energy = 0.042 (MO 20)
| ||||
| Cyclohexadiene | Relative Energy = -0.206 (MO 22)
|
Relative Energy = -0.171 (MO 23)
|
| Molecule | Antisymmetrical Orbital | Symmetrical Orbital | ||||
|---|---|---|---|---|---|---|
| Filled Orbitals | Relative Energy = -0.196 (MO 40)
|
Relative Energy = -0.191 (HOMO - MO 41)
| ||||
| Unfilled Orbitals | Relative Energy = 0.015 (MO 43)
|
Relative Energy = -0.005 (LUMO - MO 40)
|
| Molecule | Antisymmetrical Orbital | Symmetrical Orbital | ||||
|---|---|---|---|---|---|---|
| Filled Orbitals | Relative Energy = -0.198 (MO 40)
|
Relative Energy = -0.186 (HOMO - MO 41)
| ||||
| Unfilled Orbitals | Relative Energy = 0.010 (MO 43)
|
Relative Energy = -0.007 (LUMO - MO 42)
|
Normal electron demand in a [4+2] cycloaddition is from the diene to the dieneophile, the LUMO of the dieneophile (electron deficient) and HOMO of the diene (electron rich) are HOMO-LUMO pair closest in energy. The opposite is true for inverse electron demand, the LUMO of the diene and the HOMO of the dieneophile are closest in energy. As can be seen in figure 10, there is inverse electron demand as the LUMO of cyclohexadiene and the HOMO of 1,3-dioxole (the dieneophile) are closest in energy. This inverse electron demand occurs because the double bond in 1,3-dioxole has become more electron rich and increased in energy due to the oxygens donating their electrons into the bond.
Nf710 (talk) 12:36, 16 January 2018 (UTC) If you want to show this quantitatively you have do an energy calculation of the geometry of the last step on the IRC and then looks at the energies of the MOs when they are both on the same potential energy surface.
Thermochemistry
The thermochemistry data can be found inside the log file of each structure. The free energy of each species is given in this file and so it is possible to calculate the free energy of activation and reaction. The data is given in atomic units (Hartrees) and is only comparable to other energies calculated using the same method and basis sets.
| Quantity | Free Energy / | Energy / |
|---|---|---|
| Free Energy of Activation (Endo) | 0.06036 | 158.48 |
| Free energy of Reaction (Endo) | -0.02618 | -68.75 |
| Free Energy of Activation (Exo) | 0.06334 | 166.56 |
| Free energy of Reaction (Exo) | -0.024815 | -65.15 |
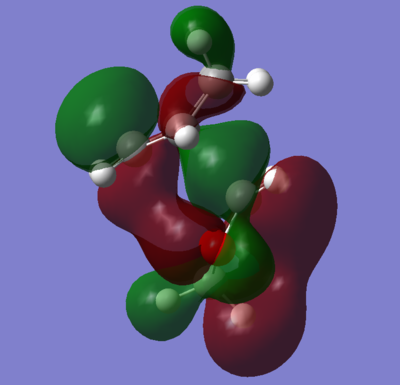
As can be seen from the values above, the endo product has a lower activation energy and final free energy. Therefore, the endo product is both kinetically and thermodynamically favoured. The endo transition state is lower in energy than the exo. This is due to the secondary orbital effects seen in figure 14. The p orbitals on the oxygen are interacting with the pi orbitals from the diene pi system, which leads to a favourable and stabilising interaction. This interaction is also present in the products, albeit to a lesser extent. The secondary orbital effect could account for the difference in the energy between the endo and exo products. However, there is a possibility that in the exo product, there are unfavourable interactions between the bridging carbons and the carbon bonded to the two oxygens. This may have also affected the exo transition state and caused a premature distortion to either ring.
| Log File of Species Used |
|---|
| 1,3-Dioxole |
| Cyclohexadiene |
| Endo Transition State |
| Exo Transition State |
| Endo Product |
| Exo Product |
Nf710 (talk) 12:39, 16 January 2018 (UTC) Your energies are correct well done and therefore you have come to the correct conclusions. You could have used a diagram to aid your discussion on sterics.
Exercise 3 - Cycloaddition Reactions between Sulfur Dioxide and o-Xylylene
All calculations in this experiment were done using at the semi-empirical PM6 level, using the same method for finding transition states as before.
Reactions at the Exocyclic cis-Butadiene Site
The reaction between sulfur dioxide and o-xylylene at the exocyclic site can yield one of 3 products, the reaction scheme is shown below in figure 15.

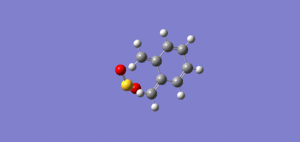
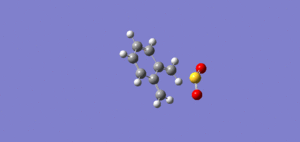
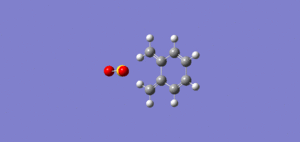
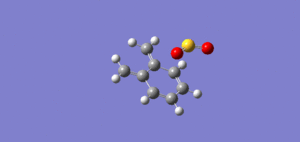
The GIF files show how the structure of the reactants changes as reaction progresses along the lowest energy potential energy surface from reactants to products and are found by performing an IRC (intrinsic reaction coordinate) calculation. The GIF files below give a computational mechanism for the corresponding reactions. For the reactions in figure 16, the an aromatic 6-membered ring is formed early in the reaction. This accounts for the high reactivity of o-xylylene because the formation of this aromatic ring is very energetically favourable.
| Reaction | Free Energy of Activation / | Free Energy of Activation / | Free Energy of Reaction / | Free Energy of Reaction / |
|---|---|---|---|---|
| Endo | 0.03099 | 81.37 | -0.03788 | -99.45 |
| Exo | 0.03251 | 85.34 | -0.03811 | -100.06 |
| Cheletropic | 0.03950 | 103.69 | -0.05958 | -156.42 |
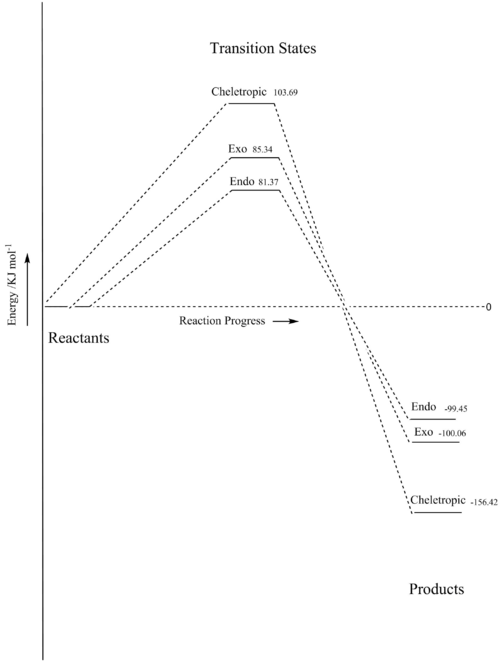
Figures 17 and 18 show the differences in the free energy of activation and reaction. The exo product has a higher energy transition state compared to the endo product because it has less stabilising secondary orbital overlap interaction because the second oxygen approaches from outside of the ring. The endo product has higher energy because the oxygen outside of the ring is in an axial position which is less favourable than the equatorial position the same oxygen occupies in the exo product. The cheletropic transition state has the highest energy due to the unfavourable formation of a strained 5-membered ring. However, it has the lowest free energy of reaction because the cheletropic product has not broken either of the strong S=O bonds.
| Log File of Species Used |
|---|
| Sulfur Dioxide |
| o-Xylylene |
| Endo Transition State |
| Exo Transition State |
| Cheletropic Transition State |
| Endo Product |
| Exo Product |
| Cheletropic Product |
Reactions at Endocyclic cis-Butadiene Site
The reactions at the alternative endocyclic cis-butadiene site were also tested using the same method for the first part of exercise 3.

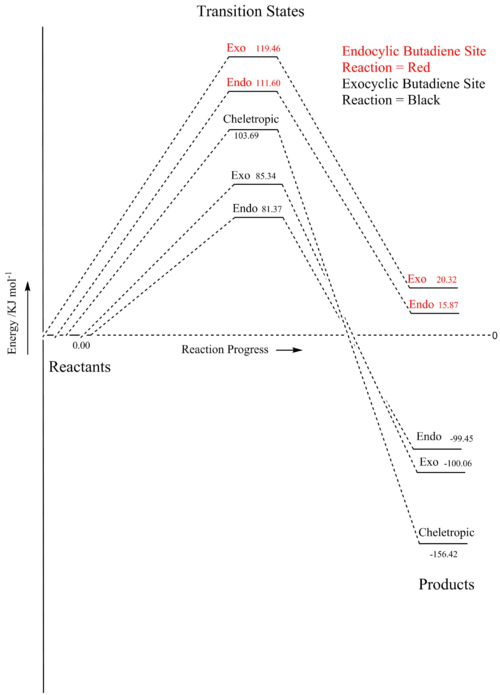
| Reaction | Free Energy of Activation / | Free Energy of Activation / | Free Energy of Reaction / | Free Energy of Reaction / |
|---|---|---|---|---|
| Endo | 0.04251 | 111.60 | 0.00604 | 15.87 |
| Exo | 0.04550 | 119.46 | 0.00774 | 20.32 |
In figures 22 and 23 the free energies of activation and reaction are found. The free energies of both the transition states and the products are much higher for the endocyclic than exocyclic reactions. In comparison to the exocyclic cis-butadiene site the endocyclic site is very kinetically and thermodynamically unfavourable. This is due to the aromatic ring not being formed and the resulting stabilising effect is not achieved. The approach for the exocyclic reaction is sterically more favourable as the exocyclic cis-butadiene site has fewer surround atoms to block the approach of an incoming sulfur dioxide molecule.
| Log File of Species Used |
|---|
| Endo Transition State |
| Exo Transition State |
| Endo Product |
| Exo Product |
(Good section and diagrams Tam10 (talk) 16:18, 9 January 2018 (UTC))
Extra Exercise - Aziridine Ring Opening (4th Reaction on the Electrocyclic Reactions Page)
The aziridine ring opening reaction was occurs via the breaking of a carbon-carbon single bond to relieve a strained heterocyclic three membered ring system. The product is a linear molecule with a delocalised pi system around the nitrogen and the two neighbouring carbon atoms. All the calculation in this section are only done to the PM6 level. The reaction scheme is shown below.

In forming the transition state of the reaction many pre-transition state structures were attempted to be optimised. It was more successful in this case to work forward from the reactants, rather than backwards from the products. The final breakthrough was made when the symmetry of the molecule was broken. This allowed the calculations to become 'unstuck' from a different area of the potential energy surface.
Reaction Profile and Thermochemistry
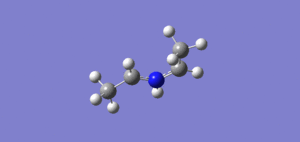
The structures along the reaction pathway are given in Figure 26 and show the conrotation of methyl groups near the complete formation of the product. The rotation of the carbons that neighbour the nitrogen is more difficult to see but they too are conrotory. Conrotorary reactions occur in 4 pi systems that are antarafacial as the pi orbitals rotate to become more stabilised.
| Reaction | Free Energy of Activation / | Free Energy of Activation / | Free Energy of Reaction / | Free Energy of Reaction / |
|---|---|---|---|---|
| Endo | 0.05655 | 148.47204 | -0.00244 | -6.40622049 |
The activation energy of this reaction is high. This is because the ring must be opened to release the electrons in the carbon-carbon bond before the pi system can be established. This can be seen in figure 29, where there is no ring present in the transition state. This reaction is also likely to be in equilibrium due its low free energy of reaction.
| Log File of Species Used |
|---|
| Aziridine Reactant |
| Transition State |
| Linear Product |
Molecular Orbitals
It is difficult to create simplified molecular orbitals from the computationally generated orbitals. However, in the HOMO of the aziridine reactant, there are orbitals on the central nitrogen and two neighbouring carbons that resemble pi orbitals. These can be seen to turn inwards in the HOMO of the transition state, creating a larger area of bonding orbital beneath the nitrogen atom.
| Molecule | HOMO | LUMO | ||||
|---|---|---|---|---|---|---|
| Aziridine Reactant | Relative Energy = -0.356
|
Relative Energy = 0.099
| ||||
| Transition State | Relative Energy = -0.28147
|
Relative Energy = 0.0162
| ||||
| Product | Relative Energy = -0.264
|
Relative Energy = 0.040
|
Analysis
The computational results have shown that that the carbon-carbon bond is broken before the pi system has established. The 2 released electrons then occupy the newly formed stabilising pi system in the product. The reaction will undergo both these steps simultaneously and so the empty orbitals in the HOMO, modelled as p orbitals in figure 30, of the reactants will turn towards a similar orbital on the nitrogen containing the lone pair. This process will require a significant amount of energy input, but once the orbitals have been distorted enough, the energy to form the pi system is less than to keep the 3-membered ring and the reaction goes to the products. The same is true for the reverse as the activation energies are similar (if the pi system is distorted enough the 3-membered ring will form).

The Woodward-Hoffmann analysis for this molecule is difficult because there are no sp2 atoms until the carbon-carbon bond is broken. I have decided to model the analysis on the HOMO of the reactants and as if the reaction is uniting two end of the same 4 pi system. According to this analysis the reaction is thermally allowed and conrotatory, which confirms the information given in the task. [4]
(Nice section. If you're having trouble tracking the orbitals, take intermediate geometries of the IRC. What makes this system difficult is the swapping of orbitals and rotation of sigma orbitals into pi orbitals and vice versa Tam10 (talk) 16:26, 9 January 2018 (UTC))
(+10%)
Conclusion
In exercise 1 the method for finding the transition state was tested on a simple reaction. The molecular orbital diagram was drawn to visualise the frontier orbitals. Key carbon bond lengths were plotted as the reaction progressed and the findings were verified using literature values for different carbon bond lengths. The final vibration allows for the visualisation of the formation of the products from the reactants.
The same techniques were applied in exercise 2 at a more accurate computational level. The thermochemistry of the computational reaction was then compared and molecular orbitals generated in the computation were used to justify the results. Similar thermochemistry conclusions were reached in exercise 3, where 5 reactions were compared.
The techniques and analysis from the main exercises was stretched to accommodate for the aziridine ring opening extension. Finding the transition state proved more difficult in this unimolecular reaction but a reduction of symmetry allowed the Gaussian programme to find the correct transition state. Using the GIF files to visualize the structure and further analysis, the ring opening proceeds with conrotation.
To improve any computational investigation, it is possible to conduct the calculation at a higher accuracy and verify the results with experimental laboratory work. This said, both the PM6 and B3LYP/6-31G(d) calculation levels proved to be a very powerful tool for finding molecular orbitals, thermochemistry values and many other useful reaction properties.
References
- ↑ McDouall J., Computational Quantum Chemistry, Royal Society of Chemistry, 2013, 1-62
- ↑ P. Pyykkö, M. Atsumi, Molecular Single-Bond Covalent Radii for Elements, Chemistry: A European Journal, 2009
- ↑ Rowland RS, Taylor R, Intermolecular nonbonded contact distances in organic crystal structures: comparison with distances expected from van der Waals radii, J. Phys. Chem., 1996, 7384–7391
- ↑ Examples Of Electrocyclic Reactions, http://www.ch.ic.ac.uk/local/organic/pericyclic/p1_electro.html

