Rep:MOD:Year201390203
Inorganic Computational Lab
Borane
Basis set
B3LYP/6-31G level
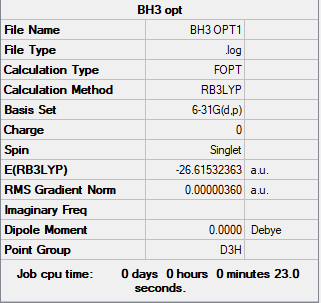
Summary table
Copy of borane summary table image
Link to original LOG file
Link to log/frequency file for Borane
Convergence and low frequency verification data
Item               Value     Threshold  Converged?
 Maximum Force            0.000004     0.000450     YES
 RMS     Force            0.000003     0.000300     YES
 Maximum Displacement     0.000017     0.001800     YES
 RMS     Displacement     0.000011     0.001200     YES

Low frequencies ---   -1.1800   -1.0028   -0.0054    4.1927   11.0182   11.0637
Low frequencies --- 1162.9912 1213.1792 1213.1819
Image of borane
Borane molecule in Jmol |
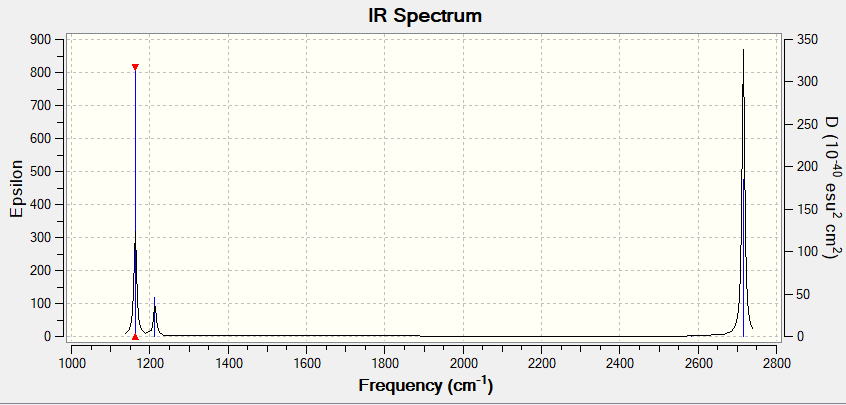
Vibrations of the borane molecule
| Mode | Frequency | Infrared | Type |
|---|---|---|---|
| 1 | 1162 | 92 | Symmetric bend |
| 2 | 1213 | 14 | Symmetric wag |
| 3 | 1213 | 14 | Asymmetric wag |
| 4 | 2582 | 0 | Symmetric stretch |
| 5 | 2715 | 126 | Asymmetric stretch |
| 6 | 2715 | 126 | Asymmetric stretch |
Why are there not three peaks in the spectrum even though there are six vibrations?
Although there are six vibrations for borane, according to the 3N-6 rule for non-linear molecules, because of the degeneracy of some of the vibrational modes only three peaks appear in the IR spectrum. In mode 4 there is not a change in dipole and thus violates the selection rule that there must be a change in dipole. Modes 2 and 3 are degenerate as well as modes 5 and 6 whilst mode 1 is non degenerate.
Correct explanation of the 3 visible peaks which could have been a little clearer in terms of the writing. You've correctly assigned the type of frequency for each mode but the symmetries are missing from the information presented. Smf115 (talk) 21:54, 13 May 2019 (BST)
MO diagram of BH3 with calculated molecular orbitals
Reference: 1. Hunt, P. (2019). Lecture_4_Tut_MO_diagram_BH3. [ebook] Available at: http://www.huntresearchgroup.org.uk/teaching/teaching_comp_lab_year2a/Tut_MO_diagram_BH3.pdf [Accessed 2 May 2019].
Answer to questions on MO diagram
There are subtle differences between the LCAO MOs and the real MOs. The shapes of the MOs are consistent with the LCAO approach but looking at the real MOs we can see electron density is localised over larger regions of space and this is due to the orbital overlap. In the LCAO approach, the atomic orbitals or fragment orbitals are not merged to form a larger MO. This allows for humans to easily decipher the fragments used to create the MO. Thus, the qualitative MO diagram is a useful guide to the general shapes of the real MO diagram but this qualitative approach does not fully visualise the forms of the MOs. Nevertheless, it is a useful tool for understanding where the real MOs come from.
Ammonia
Basis set
B3LYP/6-31G level
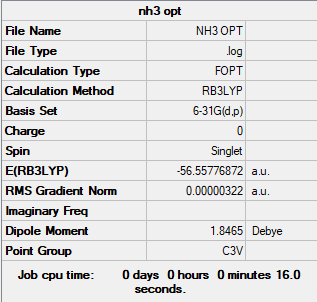
Summary table
Link to original LOG file
Link to log/frequency file for Ammonia
Convergence and low frequency verification data
         Item               Value     Threshold  Converged?
 Maximum Force            0.000006     0.000450     YES
 RMS     Force            0.000004     0.000300     YES
 Maximum Displacement     0.000012     0.001800     YES
 RMS     Displacement     0.000008     0.001200     YES

Low frequencies ---   -8.5223   -8.4750   -0.0029    0.0335    0.1918   26.4067
Low frequencies --- 1089.7616 1694.1862 1694.1866
Image of ammonia
Ammonia molecule in Jmol |
Borane-Ammonia adduct
Basis set
B3LYP/6-31G level
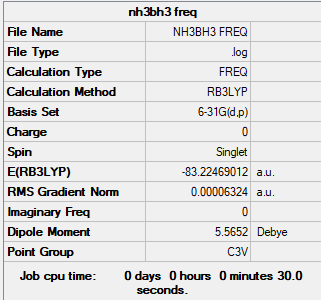
Summary table
Copy of the summary table for the borane-ammonia adduct
Link to original LOG file
Link to log/frequency file for Borane-Ammonia adduct
Convergence and low frequency verification data
Item               Value     Threshold  Converged?
 Maximum Force            0.000114     0.000450     YES
 RMS     Force            0.000063     0.000300     YES
 Maximum Displacement     0.000621     0.001800     YES
 RMS     Displacement     0.000355     0.001200     YES

Low frequencies ---   -0.0617   -0.0457   -0.0066   21.6779   21.6838   40.5363
Low frequencies ---  266.0165  632.3610  640.1359
Image of borane-ammonia adduct
Borane-Ammonia adduct molecule in Jmol |
Reaction energetics
The following values are given in atomic units, au, to 8 dp to avoid rounding errors:
E(NH3)= -56.55776863
E(BH3)= -26.61532362
E(NH3BH3)= -83.22468814
The reaction energy, calculated as follows:
ΔE=E(NH3BH3)-[E(NH3)+E(BH3)]
and is calculated below:
-83.22468814 - [-26.61532362 + -56.55776863] = -0.05159589 a.u.
Now using the conversion factor of 2625.5 to convert to kJ/mol and attain -135. We find that the adduct is a stable form evidenced by the more stable energy. However, upon comparison to the B-N bond dissociation energy, tabulated as 389 kJ/mol we can suggest that the dative bond is weak.
Nicely presented energy values, correct calculation and consideration of the accuracy of the final reported value. To improve you should have a reference for the literature value! Smf115 (talk) 21:50, 13 May 2019 (BST)
NI3
Basis set
B3LYP/GEN
Summary table
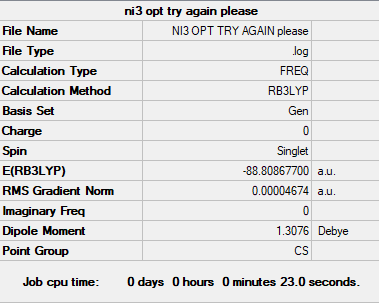
Copy of the summary table for the NI3
Link to original LOG file
Link to log/frequency file for NI3
Convergence and low frequency verification data
         Item               Value     Threshold  Converged?
 Maximum Force            0.000061     0.000450     YES
 RMS     Force            0.000037     0.000300     YES
 Maximum Displacement     0.000606     0.001800     YES
 RMS     Displacement     0.000357     0.001200     YES
Low frequencies ---   -5.5587   -5.4901   -0.0003   -0.0002    0.0004    6.5130
Low frequencies ---  101.1565  101.2827  148.4562
Image of NI3
NI3 molecule in Jmol |
Al2Cl4Br2
Isomerism of Al2Cl4Br2
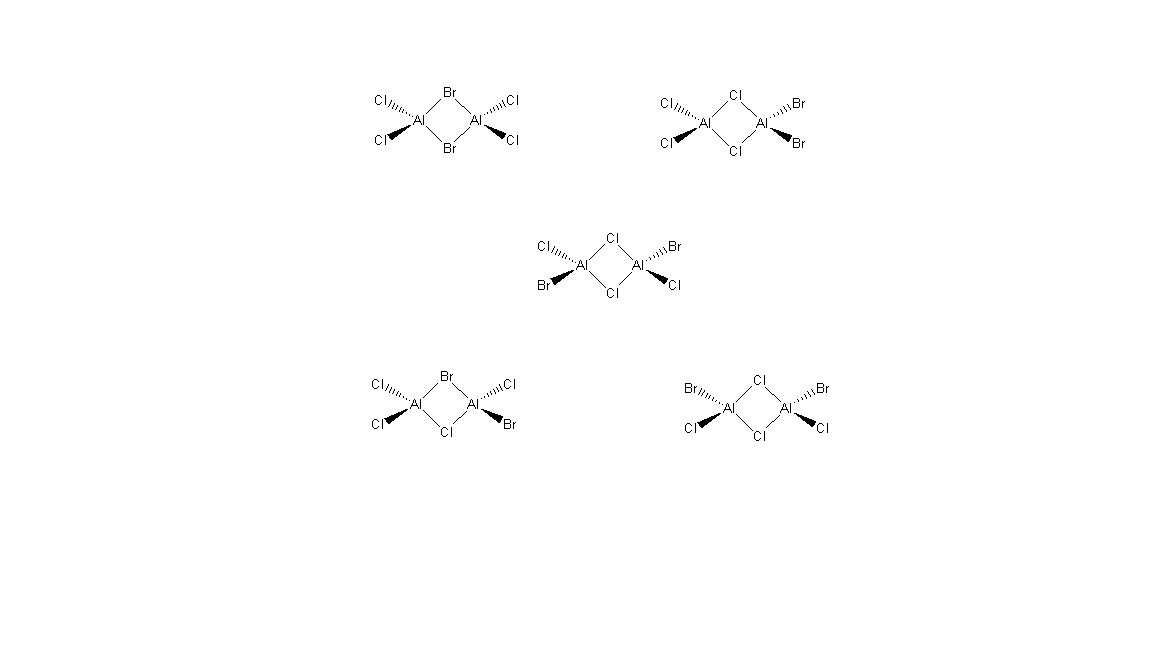
The five isomers of Al2Cl4Br2 can be seen below, drawn with Chemdraw. The isomer with both bromine in the bridging positions will be analysed, as well as the isomer with the bromines occupying the terminal trans positions.
AlCl2Br monomer
Convergence and low frequency verification data
        Item               Value     Threshold  Converged?
 Maximum Force            0.000084     0.000450     YES
 RMS     Force            0.000033     0.000300     YES
 Maximum Displacement     0.001205     0.001800     YES
 RMS     Displacement     0.000690     0.001200     YES
Low frequencies ---   -0.0009    0.0008    0.0019    1.3337    2.3401    4.2420
Low frequencies ---  119.7829  132.7164  182.6113
Summary table
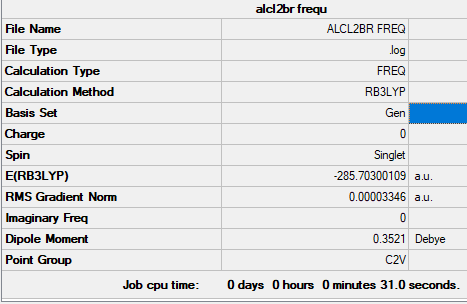
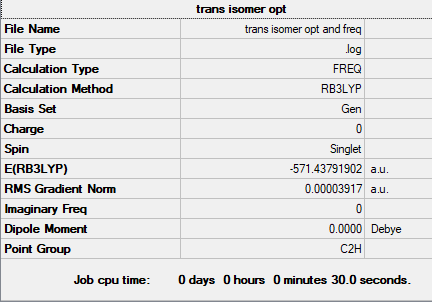
Copy of the summary table for trans Alcl2Br
Link to original LOG file
Image of Alcl2Br
AlClBr in Jmol |
Energetics and comparison to the monomer, AlCl2Br
The following values are given in atomic units, au, to 8 dp to avoid rounding errors:
E(Trans isomer of Al2Cl4Br2)= -571.43791902 au
E(Al2Cl4Br2 isomer with bromines in bridging position)= -571.43283091 au
Energy difference between:
E(Trans isomer of Al2Cl4Br2) - E(Al2Cl4Br2 isomer with bromines in bridging position)
= (-571.43791902) - (-571.43283091)
= -0.00508811 au
In kJ/mol this is -13 kJ/mol. This suggests that the trans isomer is more stable than the isomer with the bromines in the bridging positions. A possible explanation for this observation is that there is significant steric hindrance of the bromines in the bridging position due to its large molecular size. This will make the trans isomer more stable as the bromines are on different faces and maximally distant from eachother. Furthermore, with the chlorines in the bridging positions, given that chlorine has more compact orbitals this will maximise the overlap integral Sab, bromine with larger and more diffuse orbitals will have a poorer overlap integral. Thus, stabilisation will be worse and hence why the isomer with the bromines trans and the chlorines in the bridging position is favoured.
E(AlCl2Br)= -275.70300109 au
2xE(AlCl2Br)= -571.4060022 au
The energy difference is calculated as follows:
ΔE=2xE(AlCl2Br)-E(Trans isomer of Al2Cl4Br2)]
and is calculated below:
(-571.4060022) - [-571.43791902] = 0.03191684 au
This equates to 84 kJ/mol, which implies the monomer is significantly less stable than the dimer. Aluminium is electron deficient and although it benefits from hyperconjugation between its empty p orbital and the filled p orbitals of the bromine and chlorine it is bonded to, it is still significantly electron deficient. However, upon dimerization the atoms in the bridging ligand provide stabilisation to the molecule as they form molecular orbitals with the AlClBr fragments which stabilise the molecule significantly more than would if the bromines were bridging for the same reasons as above. The overlap integral will be poorer due to the more diffuse orbitals and thus resulting in weaker interactions and less stabilisation when forming the MO.
Correct calculation of the dissociation energy and great attempt at justifying the resulting stability of the dimer. The ideas raised are good with technical terms used but haven't been explained too well in places - the Cl/Br and Al in the monomer would still form MOs, so the idea presented need a little more clarity. Smf115 (talk) 21:59, 13 May 2019 (BST)
Analysis of molecular orbitals
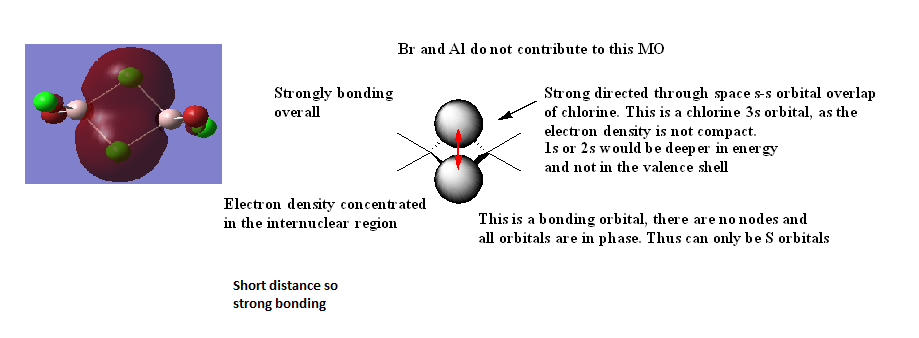
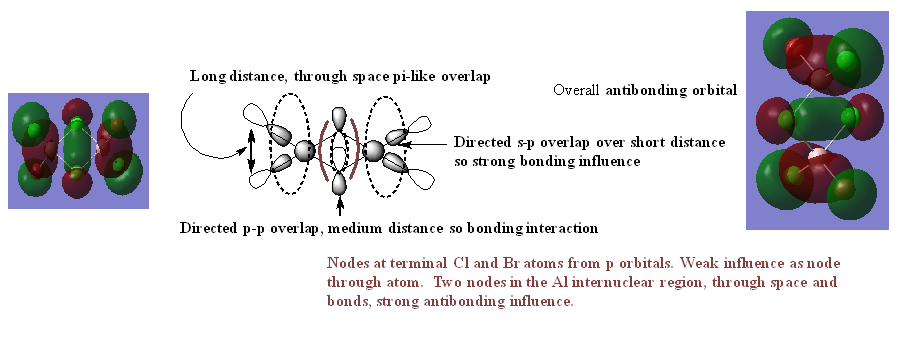
MO 21
Nice range of MOs selected, technical terms are used well and the overall character has been evaluated correctly. The presentation lets the information down in places with the LCAOs for MO20, in particular, not being too clear and Al seems to be omitted. Smf115 (talk)
Basis set
B3LYP/GEN
Summary table
Copy of the summary table for trans Al2Cl4Br2
Link to original LOG file
Link to log/frequency file for Al2Cl4Br2
Convergence and low frequency verification data
         Item               Value     Threshold  Converged?
 Maximum Force            0.000094     0.000450     YES
 RMS     Force            0.000027     0.000300     YES
 Maximum Displacement     0.001461     0.001800     YES
 RMS     Displacement     0.000457     0.001200     YES

Low frequencies ---   -4.5471   -2.4668    0.0011    0.0018    0.0019    2.2399
Low frequencies ---   18.6151   47.5783   71.2358
Image of Al2Cl4Br2
AlClBr in Jmol |
Good inclusion of a pseudopotential in the structure calculations presented, however, the pseudopotential should have only been used on the Br and not the Cl, resulting in incorrect energies. You are also missing the structure information and log file for the D2h isomer. Smf115 (talk) 22:07, 13 May 2019 (BST)
Overall, a good report! Very good first section and the project section is just let down by some missing sections Smf115 (talk) 22:07, 13 May 2019 (BST)

