Rep:MOD:YCInorganicCompLabFinal3
Yash Chawla Inorganic Computational Lab
EX3 Section
Optimization Calculations
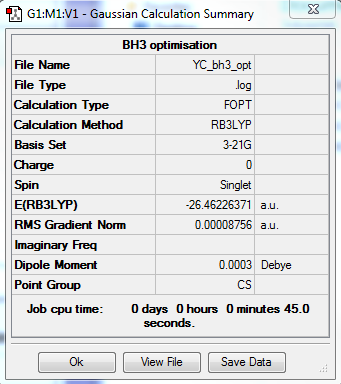
BH3 Optimization: Using B3LYP/3-21G
The optimization file is linked to here
BH3 Optimization: Using B3LYP/6-31G(d,p)
The optimization file is linked to here
| Summary Data | Convergence | Jmol | |||
|---|---|---|---|---|---|
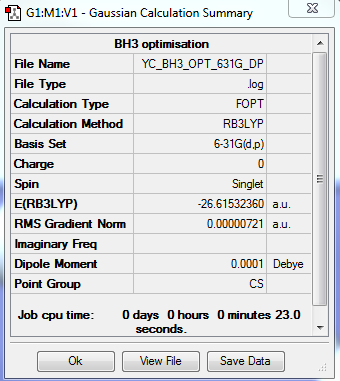 |
Item Value Threshold Converged? Maximum Force 0.000012 0.000450 YES RMS Force 0.000008 0.000300 YES Maximum Displacement 0.000064 0.001800 YES RMS Displacement 0.000039 0.001200 YES |
|
GaBr3 Optimization: Using B3LYP/LANL2DZ (Pseudo-Potentials)
The optimization file is linked to DOI:10042/31150
| Summary Data | Convergence | Jmol | |||
|---|---|---|---|---|---|
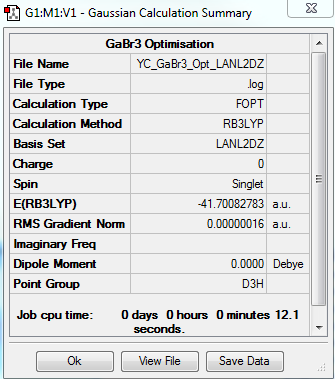 |
Item Value Threshold Converged? Maximum Force 0.000000 0.000450 YES RMS Force 0.000000 0.000300 YES Maximum Displacement 0.000003 0.001800 YES RMS Displacement 0.000002 0.001200 YES |
|
BBr3 Optimization: Using GEN (Pseudo-Potential for Br atoms and full Basis Set for B
The optimization file is linked to DOI:10042/31167
| Summary Data | Convergence | Jmol | |||
|---|---|---|---|---|---|
 |
Item Value Threshold Converged? Maximum Force 0.000013 0.000450 YES RMS Force 0.000008 0.000300 YES Maximum Displacement 0.000061 0.001800 YES RMS Displacement 0.000036 0.001200 YES |
|
Chemical Bonding Discussion
Chemical bonding is a physical phenomenon that holds species (e.g. atoms or molecules) together. In a classical sense, we may say a chemical bond refers to a net electrostatic attraction, which is the result of interplay between attraction of opposite charges and repulsion of like charges. However, in a quantum mechanical sense we can refer to the fact that a Hamiltonian (energy operator) takes into account the kinetic energy of electrons, the kinetic energy of nuclei, the electrostatic interaction between electrons, the electrostatic interaction between between nuclei and the electrostatic interaction between nuclei and electrons. [1] Chemical bonds can be characterized by bond dissociation energies, vibrational frequencies and bond lengths (although this relationship isn't as robust) and in this wiki report - we go on to explore all three.
[[File:Potential_Energy_Curve.jpg|thumb|Figure 1: A Potential Energy Curve[2]
Bond strength can be characterized by bond dissociation energy (energy required to separate atoms to infinity). Intramolecular bonds (covalent or ionic bonds) are much “stronger” than “weaker” intermolecular bonds (dipole-dipole interactions, London dispersion forces and hydrogen bonding).
Figure 1 shows a potential energy curve. The strength of the bond is indicated by the depth of the well at the minimum. The corresponding internuclear distance indicates the bond length.
"Weak", "Medium" and "Strong Bonds"
"Weak Bond": Intramolecular bonds may be generally considered "weak" bonds. Typically Hydrogen bonds are stronger than dipole-dipole interactions, which are again stronger than London dispersion forces. London dispersion forces are typically <2.4 kJ/mol, permanent Dipole-Dipole interactions are typically between 5-25 kJ/ mol and hydrogen bonds are typically 10 – 40 kJ/mol in strength. The stronger Hydrogen bonds (around 40 kJ/mol) may even be considered as "medium" strength bonds. [3]
"Medium Bonds": Many covalent and ionic bonds can be considered as "medium" strength bonds. There is great variation in strength even within covalent bonds. Below are three examples of covalent bonds, all of which can be considered as "medium" strength bonds.
Example 1: I – I single bond: 151 kJ/mol (A "weaker" type covalent bond), Example 2: H – Br single bond: 366 kJ/mol, Example: C=C double bond: 720 kJ/mol (C=C double bond may be considered as a relatively stronger type "covalent bond")[4]
"Strong Bonds": We would consider some ionic species and covalent species to have "strong" bonding. An example of a "strong" bond would be: N-N triple bond: 945 kJ/mol
Bonds on Gaussview
As aforementioned, the internuclear distance at the potential energy minimum indicates the equilibrium bond length (as in Figure 1). Gaussivew has access to stored information regarding typical equilibrium bond lengths and draws bonds where the distance between bonds is similar to the predefined bond lengths. If a bond is shorter or longer than than the predefined bond length ranges stored within Gaussview, then Gaussview may thus not draw bonds where we expect. (Peter Atkins 2010)
Geometry Comparison and Discussion
In the previous section, we discussed the variation in the strengths of bonds. Bond lengths are generally related to bond strengths. Stronger bonds tend to have a higher bond order and tend to be shorter, and weaker bonds tend to have a lower bond order and tend to be longer.
Furthermore, bonds are not perfectly "ionic" or perfectly "covalent". In reality, every bond has a degree of "ionic" character and degree of "covalent" character. "Covalent" character is well described by VB theory or MO theory. In MO theory, the strength of the bond is dependent on the exchange integral which is proportional to the overlap integral which is dependent on extent of orbital overlap. Orbital overlap is dependent on the relative location of the atoms, the orientation of the orbitals and the diffusivity of the orbitals. "Ionic" character is well described by classical physics. The strength of attraction between oppositely charged charges is dependent on the magnitude of charges and the distance between the charges. In Chemistry, we can use electronegativity difference between atoms as an indication of the polarity of a bond. A more polar bond is one with higher "ionic" forces. Overall, it is the interplay between the polarity of a bond and the extent of orbital overlap that determines the strength of a bond.
Below, we present the bond angles bond lengths of the three molecules studied and compare the results keeping our earlier discussion in mind:
| BH3 | BBr3 | GaBr3 | |
|---|---|---|---|
| r(E-X) (in Angstroms) | 1.19 | 1.93 | 2.35 |
| θ(X-E-X) (in Degrees) | 120.0 | 120.0 | 120.0 |
All three molecules have D3h symmetry and have bond angles of 120 degrees.
BBr3 has a higher bond length than BH3 - therefore, the effect of changing the ligand from H to Br is that the metal-ligand bond is weaker and longer.
H (2.1) and Br (2.8) are both similar in the respect that they are both more electronegative than Boron (2.0). However, Br is more electronegative than H and thus the B-Br bond is more polar than the B-H bond with a greater degree of "ionic character" (an effect that would imply that the bond should be stronger).
However, at the same time, as Br is in Period 4 and H is in Period 1 - the atomic orbitals of Br are much more diffuse than the orbitals of H. Therefore, the overlap of the more diffuse Br orbitals with Period 2 Boron orbitals (e.g. Br 4p - B 2p) is weaker than the overlap of the B atomic orbitals with the more contracted H atomic orbitals (e.g. H 1s - B 2p interactions). This effect is very significant and overall the B-Br bond is weaker and longer than the B-H bond.
GaBr3 has a higher bond length than BBr3 - therefore, the effect of changing the metal from B to Ga is that the metal-ligand bond is weaker and longer.
B (2.0) and Ga(1.6) are both similar in the respect that they are both less electronegative than Bromine (2.8). However, Ga is less electronegative than B and thus the Ga-Br bond is more polar than the B-Br bond.
However, at the same time, as Ga is in Period 4 and B is in Period 2 - the atomic orbitals of Ga are much more diffuse than the orbitals of B. Therefore, the overlap of the more diffuse Ga orbitals with the Bromine orbitals (e.g. Ga 4p - Br 4p) is weaker than the overlap of the Br atomic orbitals with the more contracted B atomic orbitals (e.g. B 2p - Br 4p interactions). This effect is very significant and overall the Ga-Br bond is weaker and longer than the B-Br bond.
Frequency Calculations
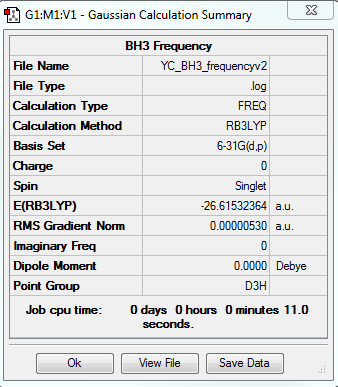
BH3:B3LYP/6-31G(d,p) Frequency Calculation
The frequency file is linked to here
| Summary Data | Low Modes |
|---|---|
|
Low frequencies --- -14.5183 -14.5142 -10.8197 0.0008 0.0169 0.3454 Low frequencies --- 1162.9508 1213.1230 1213.1232 |
Vibrational spectrum for BH3
| Wavenumber | Intensity | IR active? | type |
| 1162 | 93 | Yes | Bend |
| 1213 | 14 | Very slight | Bend |
| 1213 | 14 | Very slight | Bend |
| 2583 | 0 | No | Stretch |
| 2716 | 126 | Yes | Stretch |
| 2716 | 126 | No | Stretch |
Note: All wave-numbers are in cm-1.
There are 6 vibrations: at 1162, 1213, 1213, 2583, 2716 and 2716 respectively. However, only 5 vibrational modes are IR active - This is because a vibrational mode must involve a change in dipole moment if it is to be IR active and one vibration (the one corresponding to 2583) does not involve a change in dipole moment. Furthermore, out of the remaining 5, there are two degenerate vibrations (bond angle deformation at 1213 and bond stretch 2716) and they give rise to a single peak each in the spectrum. Therefore, overall we observe 3 vibrational peaks in the spectrum.
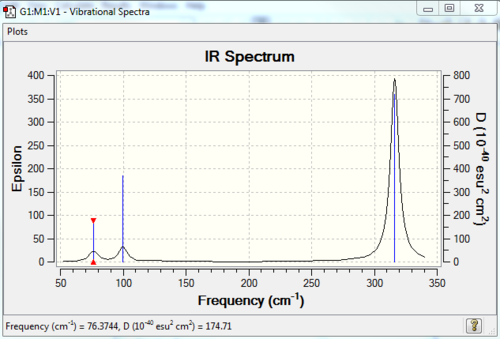
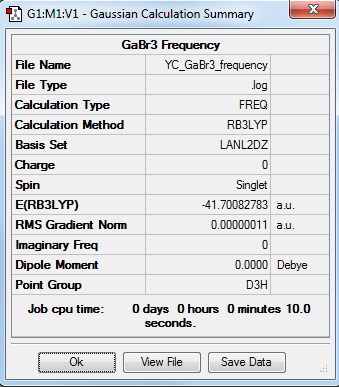
GaBr3:B3LYP/LANL2DZ (Pseudo-Potentials) Frequency Calculation
The optimization file is linked to DOI:10042/31233
| Summary Data | Low Modes |
|---|---|
|
Low frequencies --- -0.5252 -0.5247 -0.0024 -0.0010 0.0235 1.2010 Low frequencies --- 76.3744 76.3753 99.6982 |
Vibrational spectrum for GaBr3
| Wavenumber | Intensity | IR active? | type |
| 76 | 3 | Very slight | Bend |
| 76 | 3 | Very slight | Bend |
| 100 | 9 | Very slight | Bend |
| 197 | 0 | No | Stretch |
| 316 | 57 | Yes | Stretch |
| 316 | 57 | Yes | Stretch |
Comparing the vibrational spectra of GaBr3 and BBr3>
The frequency is given by the equation: v=(1/2c(pi)) * sqrt (k/u) ; where v is the frequency (cm<sup1, c is the speed of light (cm/s), k is the force constant (erg/cm2) and u is reduced mass (g). We can see that all the corresponding vibrations are of a much lower frequency for GaBr3 as compared to the BH3/.
We know already know that the reduced mass of GaBr3 is actually higher than BH3 (due to the presence of the heavier Ga (69.72u) and Br (79.90u) atoms compared to B (10.81u) and H (1.01u), which according to our equation, should result in lower frequencies for GaBr3.
Using the equation, we can also infer that the large difference in the values of the frequencies must be because the force constants for GaBr3 are much lower than the force constants for BH3. The force constant, k, is the second derivative of the energy. Thus the higher frequency values for vibrations for BH3 indicate that BH3 has very steep curvature (in all directions of vibrational coordinates) on its energy curve near the minimum.In an analogy to a spring, the higher force constant thus indicates that the molecule is much more rigid (in terms of bending and stretching) and this is why it takes much more energy (higher wave-number of IR radiation) to bend or stretch it.
We discussed earlier that the BH3 has much stronger bonds than GaBr3 and thus our conclusions regarding the rigidity of BH3 are consistent with the bond strengths (a higher bond strength indicates that it will be more rigid and it may be more difficult to bend or stretch it).
We also notice that there is a rearrangement of the A2 umbrella motion. In the BH3 spectrum, this vibration is at 1162 cm-1 with an intensity of 93 and in the GaBr3 spectrum, this vibration is at 100 cm-1 with an intensity of 9. By animating the vibrations, we can see that in BH3 the displacement vectors are associated with the Hydrogen atoms (they move much more than the B atom and cause the change in dipole moment needed). However, in the GaBr3, the main motion is that of the Ga atom and the main displacement vector is associated with the Ga atom. This follows from the fact that H has a lower atomic mass than B and Ga has a lower atomic mass than Br.
The value of the frequency associated with this vibration is still much higher in BH3 because (as we discussed earlier) the force constants in BH3 are generally higher and its reduced mass is lower. However, in BH3 the umbrella motion is the vibration with the lowest frequency out of the 6 vibrational modes while in GaBr3 the umbrella motion is only the third lowest frequency (this refers to the reordering of the modes). This can be rationalized by the fact that in BH3, the umbrella motion only involves the movement of light H atoms and has a lower force constant than the other vibrational modes. However, in GaBr3, it is the central atom mainly associated with the displacement vector and thus the force constant for this vibrational mode is higher (this vibration is more rigid) than the 2 below it in frequency.
As aforementioned, a vibration is IR active if it involves a change in dipole moment. Furthermore, the greater the change in dipole moment involved and the more specific bonds present, the more intense the IR peak. In this case, both molecules have the same number of specific bonds. However, in the umbrella motion of BH3 because of the more elaborate movement of the H atoms (indicated by the large displacement vectors) - there is a greater change in dipole moment and thus the intensity of the peak associated with the umbrella motion vibration is much in BH3 than in GaBr3.
General Questions on Frequency Calculations
Why must you use the same method and basis set for both the optimisation and frequency analysis calculations?
This is because the total energy for any calculation is highly dependent on the quality of the basis set. Therefore, this means that we can never compare the total energy of structures computed using different basis sets (or pseudo-potentials) because if we did, the comparison is meaningless!
When we optimize a molecule, we find an energy minimum. When we do a frequency calculation, we are exploring the energy surface around the minimum to check it really is a minimum (second derivative is positive and energy rises in all directions) - therefore both calculations involve energy calculations. If we use a different method and basis set for the frequency, not only will the optimized molecule now have a different energy for this new method and basis set but the surrounding energy surface will be different too. Therefore, the frequency calculation will now be inconsistent with the optimization calculation. The fact that the optimised molecule might not even be a minimum using the new method and basis set means that the frequency calculation is not valid (as the frequency calculation is only valid at stationary points).
What is the purpose of carrying out a frequency analysis?
One purpose of carrying out a frequency calculation is to check that the second derivative of the energy is positive and thus that the energy rises in all directions on the energy surface. The vibrational frequencies are computed by determining the second derivates of E with respect to qn and then transforming to mass-weighted coordinates. Therefore if all the frequencies computed are positive - this means that the energy rises in all directions on the energy curve when we deviate from our optimized molecule - therefore we have found a minimum. If only one of the frequencies is negative (imaginary)- then the energy only falls in one direction (i.e. the reaction coordinate) and we have a transition structure.
The second purpose to carrying out a frequency analysis is because it provides data regarding IR and Raman modes than we can use to compare with experimental results.
What do the "Low frequencies" represent?
Every molecule has 3N-6 vibrational frequencies. The "Low frequencies" represent the "-6". These are the frequencies associated with the motion of the molecule's center of mass.
You can only compare energies for molecules computed with exactly the same method, AND the same number of atoms each computed with exactly the same basis-set (on every atom) This is because if you use a different method and basis set you will be carrying out a completely different calculation
BH3 MO Computations
Below, is a MO Diagram of BH3. The diagram is an adapted version of Patricia Hunt's MO Diagram of BH3 [5]
I have added my computed MOs (the ones with blue backgrounds) side by side to the predicted "LCAO" MOs derived by Patricia Hunt.

NH3 Calculations: Using B3LYP/6-31G(d,p)
NH3 Optimization
The optimization file is linked to DOI:10042/31238
| Summary Data | Convergence | Jmol | |||
|---|---|---|---|---|---|
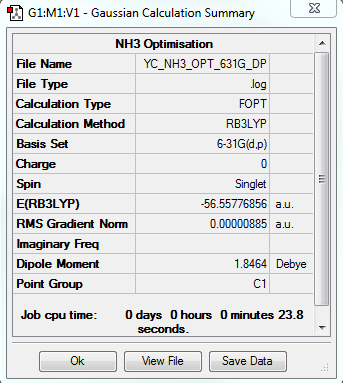 |
Item Value Threshold Converged? Maximum Force 0.000024 0.000450 YES RMS Force 0.000012 0.000300 YES Maximum Displacement 0.000079 0.001800 YES RMS Displacement 0.000053 0.001200 YES |
|
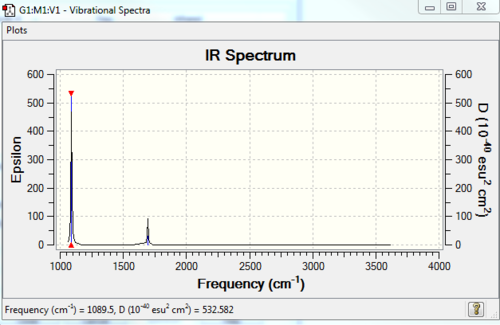
NH3 Frequency Calculation
The frequency file is linked to DOI:10042/31242
| Summary Data | Low Modes |
|---|---|

|
Low frequencies --- -31.6906 -0.0013 -0.0004 0.0010 13.0031 25.5425 Low frequencies --- 1089.5009 1694.1076 1694.1682 |
Vibrational spectrum for NH3
| Wavenumber | Intensity | IR active? | type |
| 1090 | 145 | Yes | Bend |
| 1694 | 14 | Very slight | Bend |
| 1694 | 14 | Very slight | Bend |
| 3461 | 1 | No | Stretch |
| 3590 | 0 | No | Stretch |
| 3590 | 0 | No | Stretch |
NH3 Population Analysis
The MO calculation file is linked to here
NH3 NBO Analysis
The MO calculation file is linked to here
NH3BH3 Calculations: Using B3LYP/6-31G(d,p)
NH3 Optimization
The frequency file is linked to here
| Summary Data | Convergence | Jmol | |||
|---|---|---|---|---|---|
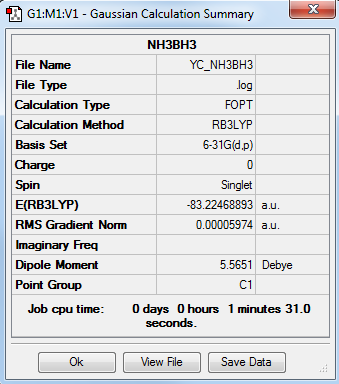 |
Item Value Threshold Converged? Maximum Force 0.000123 0.000450 YES RMS Force 0.000058 0.000300 YES Maximum Displacement 0.000515 0.001800 YES RMS Displacement 0.000296 0.001200 YES |
|
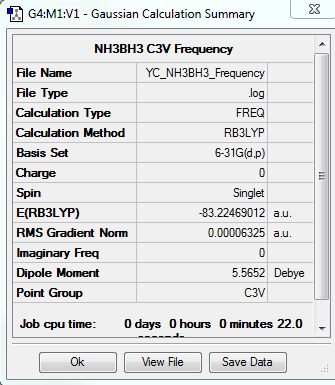
NH3 Frequency Calculation
The frequency file is linked to here
| Summary Data | Low Modes |
|---|---|
|
Low frequencies --- -0.0617 -0.0457 -0.0065 21.6783 21.6842 40.5403 Low frequencies --- 266.0169 632.3610 640.1360 |
Vibrational spectrum for NH3BH3
| Wavenumber | Intensity | IR active? | type |
| 266 | 0 | No | Bend |
| 632 | 14 | Very slight | Bend |
| 640 | 4 | No | Bend |
| 640 | 4 | No | Bend |
| 1069 | 41 | Yes | Bend |
| 1197 | 109 | Yes | Bend |
| 1204 | 3 | No | Bend |
| 1204 | 3 | No | Bend |
| 1330 | 114 | Yes | Bend |
| 1677 | 28 | Very slight | Bend |
| 2470 | 67 | Yes | Stretch |
| 2530 | 231 | Yes | Stretch |
| 2530 | 231 | Yes | Stretch |
| 3463 | 3 | No | Stretch |
| 3579 | 28 | Very slight | Stretch |
| 3579 | 28 | Very slight | Stretch |
Energy Calculations
E(NH3)= -56.55776856 au
E(BH3)= -26.61532360 au
E(NH3BH3)= -83.22468893 au
Energy of products - Energy of reactants should give us the energy involved in the reaction. Because the reaction only involves the formation of B-N bond (acid-base pairing) - the energy of product - energy of reactants should give us the energy of the B-N bond: the stabilization due to the formation of the bond. The bond dissociation energy (BDE)(amount of energy required to break the bond) will simply be the negative of this number.
(B-N bond) = E (NH3BH3) - [E(NH3) - E(BH3)] = -83.22468893 au - [-56.55776856 au + -26.61532360 au] = -0.051596770 au
Using conversion factor, 1 au = 2626.50 kJ/mol:
E (B-N bond) = -135.4673169 kJ/mol
BDE (B-N bond) = -135.4673169 kJ/mol
Since, energy can have an error of about 10 kJ/mol (my calculation can have this error), we can report the final energy value of our calculation to the nearest ten:
BDE (B-N bond) = -140 kJ/mol
This falls in the "medium" range of bond strength as according to our earlier discussion. 140 kJ/mol also sounds like a sensible answer because it is comparable to the strength of a I – I single bond: 151 kJ/mol (A "weaker" type covalent bond). We can expect the B-N bond to have energy similar to that of a "weaker" type covalent bond, because heterolytic cleavage of the B-N bond would yield two stable molecules (BH3 and NH3).
References
- ↑ Peter Atkins, Julio De Paula. Atkins' Physical Chemistry. Oxford: Oxford University Press, 2010.
- ↑ This diagram was taken from http://www.britannica.com/nobelprize/art-947.
- ↑ Bond Strengths from: Washington University. Liquids and Solids. http://depts.washington.edu/chemcrs/bulkdisk/chem162A_aut04/handout_Lecture_10.pdf (accessed October 17, 2014).
- ↑ Jonathon Clayden, Nick Greeves, Stuart Warren. Organic Chemistry 2nd Edition. Oxford: Oxford University Press, 2001.
- ↑ The original diagram (without added computed MOs) was taken from Patricia Hunt's website: http://www.huntresearchgroup.org.uk/teaching/teaching_comp_lab_year3/Tut_MO_diagram_BH3.pdf .
Project Section: Part 1
Optimisations
[N(CH3)4]+ Optimization: Using B3LYP/6-31G(d,p)
The optimization file is linked to DOI:10042/31256
| Summary Data | Convergence | Jmol | |||
|---|---|---|---|---|---|
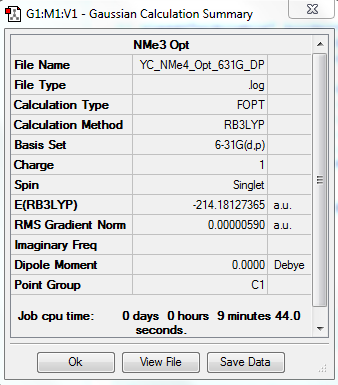 |
Item Value Threshold Converged? Maximum Force 0.000016 0.000450 YES RMS Force 0.000004 0.000300 YES Maximum Displacement 0.000534 0.001800 YES RMS Displacement 0.000115 0.001200 YES |
|
[P(CH3)4]+ Optimization: Using B3LYP/6-31G(d,p)
The optimization file is linked to DOI:10042/31257
| Summary Data | Convergence | Jmol | |||
|---|---|---|---|---|---|
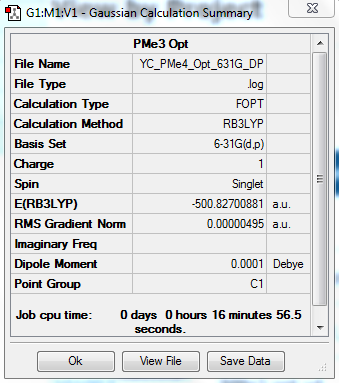 |
Item Value Threshold Converged? Maximum Force 0.000024 0.000450 YES RMS Force 0.000005 0.000300 YES Maximum Displacement 0.000465 0.001800 YES RMS Displacement 0.000169 0.001200 YES |
|
[S(CH3)3]+ Optimization: Using B3LYP/6-31G(d,p)
The optimization file is linked to DOI:10042/31258
| Summary Data | Convergence | Jmol | |||
|---|---|---|---|---|---|
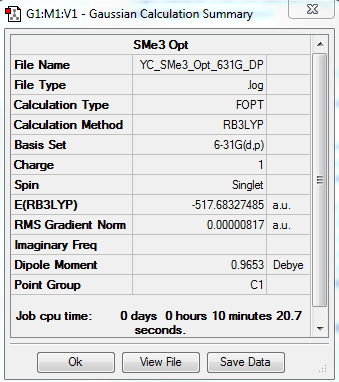 |
Item Value Threshold Converged? Maximum Force 0.000027 0.000450 YES RMS Force 0.000007 0.000300 YES Maximum Displacement 0.000771 0.001800 YES RMS Displacement 0.000316 0.001200 YES |
|
Frequency Calculations
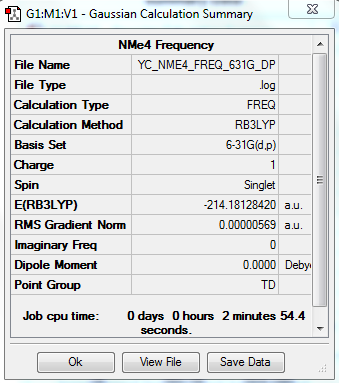
[N(CH3)4]+ Frequency Analysis
Optimized molecule was constrained to Td symmetry.
The optimization file is linked to DOI:10042/31259
| Summary Data | Low Modes |
|---|---|
|
Low frequencies --- -0.0011 -0.0008 -0.0002 21.5008 21.5009 21.5009 Low frequencies --- 188.4104 292.5534 292.5534 |
All "3N-6" frequencies are positive, therefore we have a minimum.
[P(CH3)4]+ Frequency Analysis
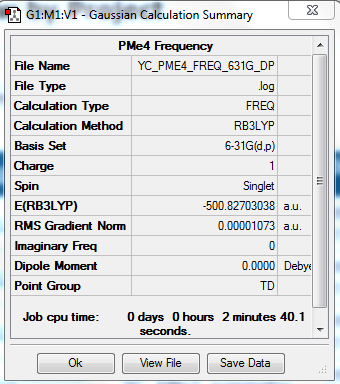
Optimized molecule was constrained to Td symmetry.
The optimization file is linked to DOI:10042/31260
| Summary Data | Low Modes |
|---|---|
|
Low frequencies --- 0.0028 0.0033 0.0038 25.1930 25.1930 25.1930 Low frequencies --- 160.8220 195.3995 195.3995 |
All "3N-6" frequencies are positive, therefore we have a minimum.
[S(CH3)3]+ Frequency Analysis
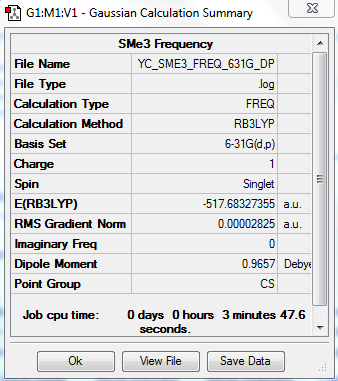
Optimized molecule was constrained to C3V symmetry.
The optimization file is linked to DOI:10042/31261
| Summary Data | Low Modes |
|---|---|
|
Low frequencies --- -9.4352 -3.8738 0.0031 0.0035 0.0042 3.2998 Low frequencies --- 161.2487 198.8507 199.0389 |
All "3N-6" frequencies are positive, therefore we have a minimum.
Geometry Comparison
| [N(CH3)4]+ | [P(CH3)4]+ | [S(CH3)3]+ | |
|---|---|---|---|
| r(C-X) (in Angstroms) | 1.51 | 1.82 | 1.82 |
| θ(X-C-X) (in Degrees) | 109.5 | 109.5 | 102.7 |
In [N(CH3)4]+ and [P(CH3)4]+, the central atoms have tetrahedral geometry and thus the X-C-X angles are 109.5 degrees as expected. [S(CH3)3]+ has trigonal pyramidal geometry and thus the X-C-X angle is lower as expected (as according to VSEPR theory, the repulsion between the lone pair and the bonding electrons causes contraction of the X-C-X).
As aforementioned, the bond length is the result of interplay between the polarity of a bond (ionic forces) and the extent of orbital overlap that determines the strength of a bond.
Electronegativities of Atoms (Pauling Scale): N: 3.04, P: 2.19, S: 2.58 C: 2.55, H: 2.20
As the electronegativity difference between N and C is the greatest, we expect this bond to have the largest ionic term. Moreover, this bond involves overlap of similarly sized 2p-2p orbitals - very strong orbital overlap resulting in a greater overlap integral and greater exchange integral - which again indicates that this bond will be stronger and shorter than the other C-X bond. This is exactly what we find.
The electronegativity difference between C and P is greater than the electronegativity difference between C and S (S is more electronegative than C and P is less electronegative C), which indicates that the C-P bond has a greater degree of "ionic bonding". However, both S and P are in Period 3 with 3p valence orbitals. The 3p orbitals of S will be slightly more contracted and of a lower in energy than those of P - i.e. closer in size and shape to the C 2p orbitals. Overall, this would result in slightly better overlap between S and C orbitals than P and C orbitals.
Overall, if we take into account the interplay between "ionic" effects and orbital overlap effectiveness - we may expect the C-P and C-S bonds to be similar in length and this is what we find in our calculations.
MO Calculation
[N(CH3)4]+ MO Analysis
The MO calculation file is linked to here
The calculation shows that there are 21 occupied MOs for NMe4+. MOs 6 - 21 are occupied non-core orbitals (we can tell this the case because MOs 1 - 5 are significantly lower in energy than the other MOs and consist of purely localized AOs (non-bonding) when visualized). Out of MOs 6 - 21, I have chosen MOs: 6, 9, 11, 14 and 16 to analyze:
MO6:
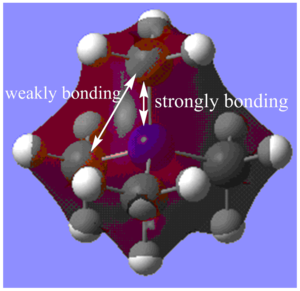
The major contributions to this MO are from AOs: Nitrogen 2s and Carbon 2s orbitals.
Through bond and through space interactions:
There are strongly bonding through bond interactions between the Nitrogen 2s and Carbon 2s orbitals (4 in total). Furthermore, there are weakly bonding through space bonding interactions between the Carbon 2s orbitals.
De-localization: Orbitals from all the 12 H atoms are not contributing to the MO, and the MO is not completely delocalized over all the Hydrogen atoms. However, otherwise, the MO is delocalized over other larger atoms with more diffuse orbitals and overall the MO is fairly delocalized.
Nodes: More nodes generally indicate increasing anti-bonding character of a MO. However, in this MO, there are no nodes whatsoever which indicates the MO is strongly bonding.
Overall, due to the presence of only bonding interactions and the lack of nodes, I would say that the MO is strongly bonding.
MO9:

The major contributions to this MO are from AOs: Nitrogen 2p, Carbon 2s orbitals and H 1s orbitals. I have drawn in a 2p orbital on the diagram to indicate where that there is a node on Nitrogen to help visualize the bonding interactions (of course, my 2p orbital is much smaller than reality in order to aid visualization of the entire MO).
Through bond and through space interactions:
Within methyl fragments, all the through bond interactions between Carbon and Hydrogen orbitals (C 2s - H 1s orbitals) (12 in total) are strongly bonding and the through space interactions between Hydrogen orbitals are weakly bonding (overall forming pyramid-like shaped one-phase orbitals for each methyl fragment).
The through space interactions (4 in total) between Nitrogen 2p lobes and methyl fragment orbitals are also strongly bonding.
We can consider methyl pairs C1 & C2 (Pair 1) and C3 & C4 (Pair 2). There are weakly bonding through space interactions (2 in total) between methyl fragment orbitals within the pairs specified. Furthermore, there are weakly anti-bonding through space interactions (4 in total) between methyl fragment orbitals from different pairs, e.g. between orbitals from methyl fragment C1 & orbitals from methyl fragment C4.
De-localization: Orbitals from all atoms are contributing to the MO and the MO is delocalized over the entire molecule.
Nodes: In this MO, there is only one node: on the N atom. As the node is on the atom, it is less important.
Overall, I would thus say that the MO is strongly bonding.
MO11:
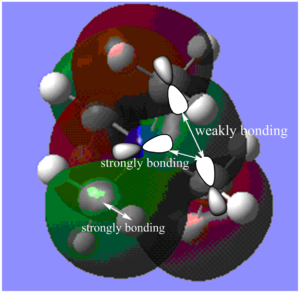
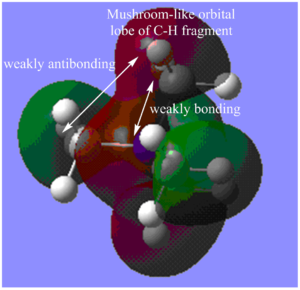
The major contributions to this MO are from AOs: Nitrogen 2p, Carbon 2p orbitals and H 1s orbitals. I have drawn in a 2p orbital on the Nitrogen and 2 Carbon atoms to aid visualization.
Through bond and through space interactions:
Shown in Diagram C:
Within each methyl fragment, there is one strongly bonding through space interaction between Carbon and Hydrogen orbitals (C 2p - H 1s orbitals).
The through space interactions (4 in total) between Nitrogen 2p and carbon 2p orbitals (one of the lobes) are also strongly bonding (if 2p - 2p interaction had been along the same axis, the through bond interaction would have been very strong).
Shown in Diagram D:
Because of the relative orientation of the Carbon and Nitrogen 2p orbitals, there is also weak through space bonding interactions between the other lobes of the Nitrogen 2p orbital and the other lobe of Carbon 2p orbital (or rather the mushroom-like orbitals of the C and H fragments - which also takes the interactions of H1s orbitals into account).
Furthermore, there are also weakly anti-bonding through space interactions between different C-H fragments orbitals.
De-localization: Orbitals from 8 H atoms are not contributing to the MO, and the MO is not delocalized over these atoms. However, overall, the MO is still fairly delocalized over the molecule.
Nodes: There are nodes on each of the Carbon atoms and on the Nitrogen atom.
Overall, due to the presence of strong bonding interactions and only few weakly anti-bonding interactions, I would say that the MO is weakly bonding.
MO14:
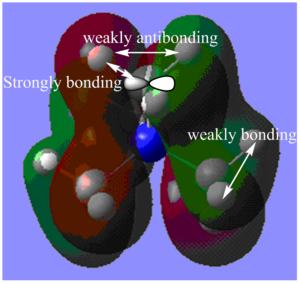

The major contributions to this MO are from AOs: Carbon 2p orbitals and H 1s orbitals. I have drawn in a 2p orbital on the Carbon to aid visualization.
Through bond and through space interactions:
Shown in Diagram E:
Within each methyl fragment, there are three strongly bonding through space interaction between Carbon and Hydrogen orbitals (C 2p - H 1s orbitals). Also, within each methyl fragment, two H 1s orbitals are of same phase and 1 H 1s orbital is of the other phase. This results in one weakly bonding though space interaction between the in-phase orbitals and two weakly anti-bonding interactions between orbitals that are out-of-phase.
Shown in Diagram F:
There are also through space weakly bonding interactions between each of the methyl fragment orbitals (combination of Carbon 2p orbitals and H 1s orbitals) and two other methyl fragments orbitals and through space weakly anti-bonding interactions between orbitals of each of the methyl fragments and orbitals of the one other remaining methyl fragment.
Nodes: It is between the borders of these out-of-phase orbitals of the methyl fragments (resulting in the weakly anti-bonding interactions) that there are nodes (some are shown in Diagram F). Due of the lack of the necessary symmetry, the result is not a nodal plane but many nodes along the border of the methyl fragment orbitals. There are also nodes on each of the Carbon atoms and on the Nitrogen atom.
De-localization: Orbitals from N atoms are not contributing to the MO, and the MO is not delocalized over the N atom. However, otherwise, the MO is still fairly delocalized over all the methyl groups.
Overall, I would say that the MO is weakly anti-bonding.
MO16:
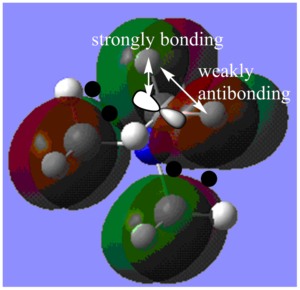
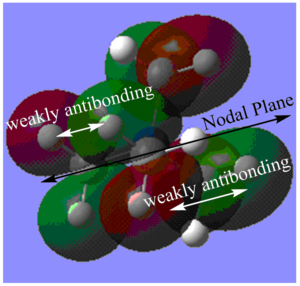
The major contributions to this MO are from AOs: Carbon 2p orbitals and H 1s orbitals. I have drawn in a 2p orbital on the Carbon to aid visualization.
Through bond and through space interactions:
Shown in Diagram G:
Within each methyl fragment, there are two strongly bonding through space interaction between Carbon and Hydrogen orbitals (C 2p - H 1s orbitals). In other words, in each methyl fragment, the AO from one H is not contributing to this MO. Furthermore, the two H 1s AOs contributing to the MO are out-of-phase and have weakly anti-bonding through space interactions.
Shown in Diagram H:
There are also through space interactions between methyl fragments. There are through space weakly anti-bonding interactions between each of the methyl fragment orbitals with the other three methyl fragment orbitals. Two of these interactions only involve one lobe of the methyl fragment orbital interacting with one lobe of another methyl fragment orbital (as shown on bottom right of Diagram H) and one of these interactions involve both lobes interacting with both lobes of another methyl fragment orbital (as show on top left of Diagram H).
De-localization: Orbitals from the N atom and 4 H atoms are not contributing to the MO, and the MO is not delocalized over these atoms. Overall, the MO is fairly localized only to the methyl fragments.
Nodes: There are nodes on each of the Carbon atoms and on the Nitrogen atom (5 in total). Furthermore, there are nodal lines along the border of the balloon-shaped parts of the MO as shown in Diagram G and a nodal plane as shown in Diagram H.
Overall, due to the presence of many anti-bonding interactions and nodes, I would say that the MO is weakly anti-bonding.
[P(CH3)4]+ MO Analysis
The MO calculation file is linked to here
[S(CH3)3]+ MO Analysis
The MO calculation file is linked to here
NBO Analysis
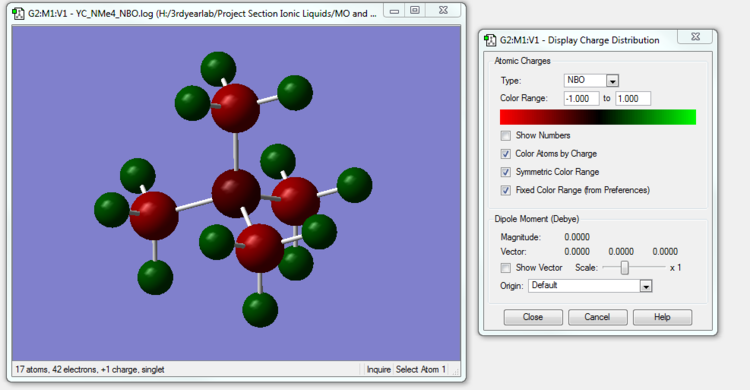
[N(CH3)4]+ NBO Analysis
The NBO calculation file is linked to here (same as the MO calculation file but in .log format)
[P(CH3)4]+ NBO Analysis
The NBO calculation file is linked to here
[S(CH3)3]+ NBO Analysis
The NBO calculation file is linked to here
Charge Comparison
| Molecule | Charge on Hetero-atom (N or P or S) | Charge on Carbon Atoms | Charge on Hydrogen Atoms |
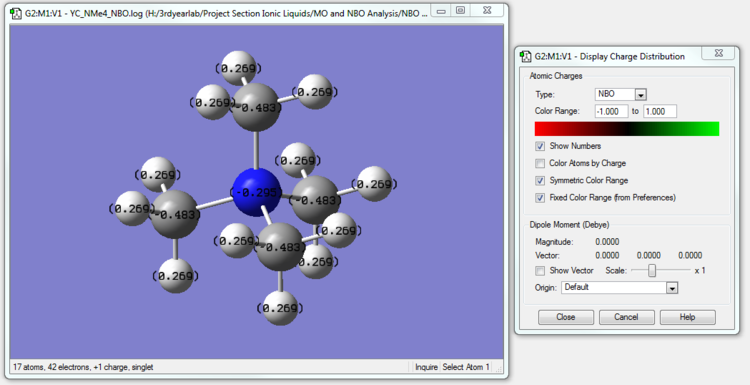
| [N(CH3)4]+ | -0.295 | -0.483 | 0.269 |
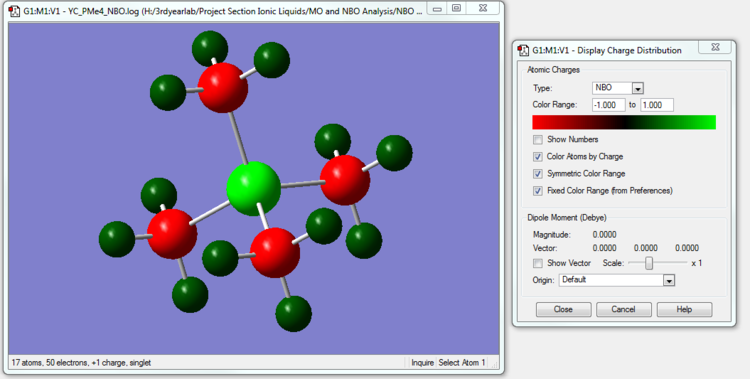
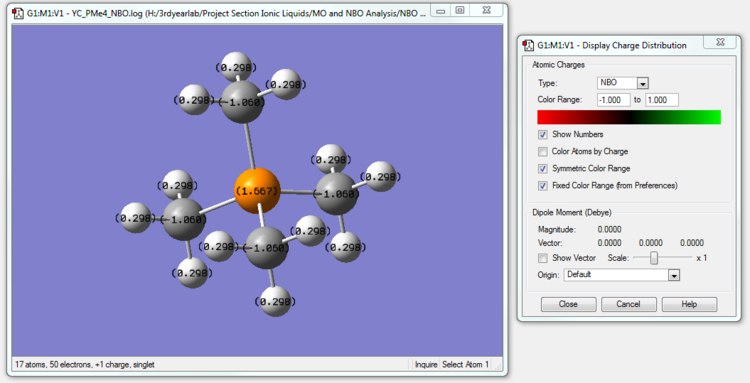
| [P(CH3)4]+ | 1.667 | -1.060 | 0.298 |
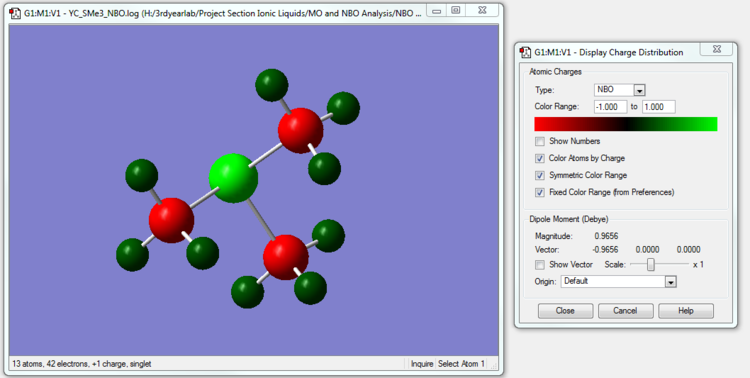
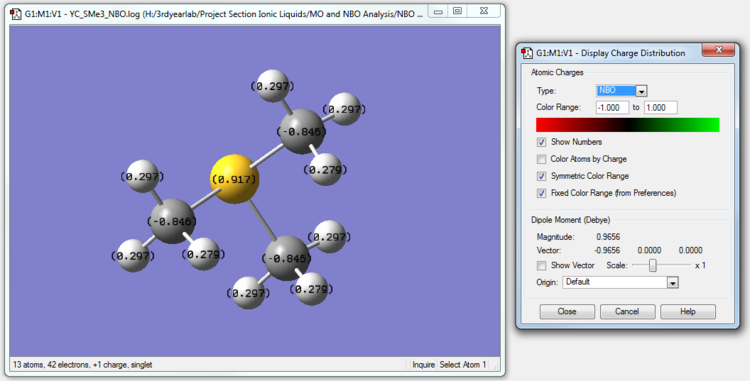
| [S(CH3)3]+ | 0.917 | -0.846 | 0.297 |
The charge distributions across the trio of cations can be rationalized by considering electronegativity. The electronegativity of a bonded atom describes its tendency to attract the bonded pair of electrons.
Electronegativities of Atoms (Pauling Scale): N: 3.04, P: 2.19, S: 2.58 C: 2.55, H: 2.20
Carbon is more electronegative than Hydrogen, and thus in all the three cations, the Carbon atoms are able to pull electron density more strongly towards itself compared to H and thus have a lower charge than H. In fact, in all three cations, the Carbon atoms have negative charges on our scale.
We see that in [N(CH3)4]+, the Nitrogen atom also has a negative charge. Even though N is more electronegative than Carbon, the Carbon atoms have a more negative charge. This is because every Carbon atom is bonded to one N atom (with high electronegativity) and three H atoms (with relatively low electronegativity) while the N atom is bonded to 4 relatively electronegative C atoms (when compared to a less electronegative element like H). So while Carbon is able pull more electron density towards itself (relative to its nuclear charge) while 'competing' with bonded Hydrogen atoms, Nitrogen is not able to compete as strongly with the neighboring Carbon atoms and is able to overall pull less electron density towards itself (relative to its nuclear charge)than Carbon.
In [P(CH3)4]+, P is actually less electronegative to C. Therefore,the central Phosphorus atom surrounded by 4 comparatively more electronegative atoms has a relatively high positive charge. The Carbon atoms in [P(CH3)4]+ actually have a more negative charge than in [N(CH3)4]+ because P is less electronegative than Nitrogen and the Carbon atoms can now pull more electron density towards themselves than in [N(CH3)4]+.
We see that in [S(CH3)3]+, the Sulfur atom , like the Phosphorus atom in [P(CH3)4]+, also has a positive charge even though S is very slightly more electronegative than C. The rationalization lies in the fact that S is bonded to 4 relatively electronegative C atoms all competing for the bonded electrons and overall has a positive charge. The Carbon atoms, apart from being bonded to S, are also bonded to three relatively less electronegative H atoms and are able to overall pull more electron density towards themselves (relative to their nuclear charge).
Furthermore, we find that the charges on the Hydrogen atoms are very similar across the three cations. The only difference is that the charges on H in [P(CH3)4]+ and [S(CH3)3]+ is slightly more than the charge on H in [N(CH3)4]+ (by about 0.03). This can be rationalized when we consider that in [P(CH3)4]+ and [S(CH3)3]+, the Carbon is already able to draw towards itself quite a lot of electron density from the central atoms and the H atoms do not have to contribute as much. However, the difference in charge between the cations is very small and in fact the difference across cations [P(CH3)4]+ and [S(CH3)3]+ is hardly discernible.
Relative Contributions to C-X bond
| Molecule | Contribution of Hetero-atom (N or P or S) to C-X bond | Contribution of Carbon atom to C-X bond |
| [N(CH3)4]+ | 66.35% | 33.65% |
| [P(CH3)4]+ | 40.43% | 59.57% |
| [S(CH3)3]+ | 51.33% | 48.67% |
In their respective cations, we find that N contributes the most to the C-X bond, followed by S, followed by P. This order directly mimics the reverse order of charge of the hetero-atom in the earlier analysis (N had lowest charge, followed by S, followed by P). Again, this order also reflects the order of electronegativities of the hetero-atoms: N is the most electronegative, followed by S, followed by P. Since electronegativities indicate the tendency of an atom to pull electron density of a bond towards itself, we can understand that the more electronegative an atom is -the stronger its tendency will be to pull electron density towards itself and the closer the electrons in the bond will be to it on average over time i.e. the higher the contribution of the atom's orbital will be to the bond.
Therefore, we can understand why in the C-X bond, the contribution from the X atom increases as the X atom becomes more electronegative.
Similarly, we can understand the relative contributions of the hetero-atom and Carbon atom to the C-X bond when we consider their relative electronegativities. When the hetero-atom is more electronegative than Carbon (e.g. Nitrogen), the hetero-atom contributes more to the C-X bond than the Carbon (as it is has a stronger tendency to pull electron density towards, itself, therefore on average electrons will closer to it over time which must mean that its orbital is contributing more to the bond). Therefore, when we consider the C-S bond where S is only slightly more electronegative than C, we find that the S orbital is contributing only slightly more to the bond than Carbon. Finally, when we consider the P-X bond, where P is less electronegative than C, we find that the P orbital contributes less than the C orbital to the bond.
Discussion of Traditional Description of [NR4]+
In the traditional description of a cation like [N(CH3)4]+, the positive charge is sometimes drawn on the Nitrogen center. In the traditional picture, the formal positive charge on the Nitrogen represents that instead of having 3 bonds and one lone pair, the Nitrogen atom actually has four bonds. The formal positive charge indicates that the lone pair on the Nitrogen is actually being used for a bond (with both electrons originating from the Nitrogen atom).
However, our calculations show us that in [N(CH3)4]+, the Nitrogen has a negative charge. In fact, our calculations indicate that even the Carbon atoms has a negative charge and that it is the 12 H atoms that are positively charged (as according to our scale). When we add all the charges of all the atoms up - it comes to +1 (the overall charge of the cation).
Project Section: Part 2
Optimisations
[N(CH3)3(CH2OH)]+ Optimization: Using B3LYP/6-31G(d,p)
The optimization file is linked to DOI:10042/31373
| Summary Data | Convergence | Jmol | |||
|---|---|---|---|---|---|
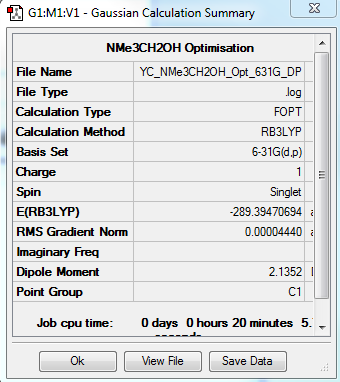 |
Item Value Threshold Converged? Maximum Force 0.000147 0.000450 YES RMS Force 0.000021 0.000300 YES Maximum Displacement 0.001522 0.001800 YES RMS Displacement 0.000396 0.001200 YES |
|
[N(CH3)3(CH2CN)]+ Optimization: Using B3LYP/6-31G(d,p)
The optimization file is linked to here
| Summary Data | Convergence | Jmol | |||
|---|---|---|---|---|---|
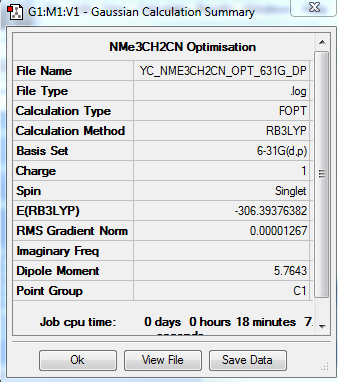 |
Item Value Threshold Converged? Maximum Force 0.000034 0.000450 YES RMS Force 0.000006 0.000300 YES Maximum Displacement 0.000422 0.001800 YES RMS Displacement 0.000107 0.001200 YES |
|
Frequency Calculations
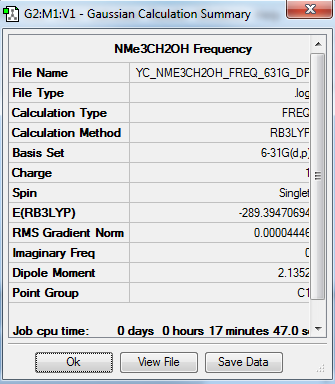
[N(CH3)3(CH2OH)]+ Frequency Analysis
The frequency file is linked to here
| Summary Data | Low Modes |
|---|---|
|
Low frequencies --- -5.1260 -4.7116 -0.0006 0.0009 0.0010 2.0697 Low frequencies --- 131.4259 213.6390 255.4757 |
All "3N-6" frequencies are positive, therefore we have a minimum.
[N(CH3)3(CH2CN)]+ Frequency Analysis
The frequency file is linked to here
| Summary Data | Low Modes |
|---|---|

|
Low frequencies --- -5.1260 -4.7116 -0.0006 0.0009 0.0010 2.0697 Low frequencies --- 131.4259 213.6390 255.4757 |
All "3N-6" frequencies are positive, therefore we have a minimum.

