Rep:MOD:XZ9215
Transition states and reactivity
Introduction
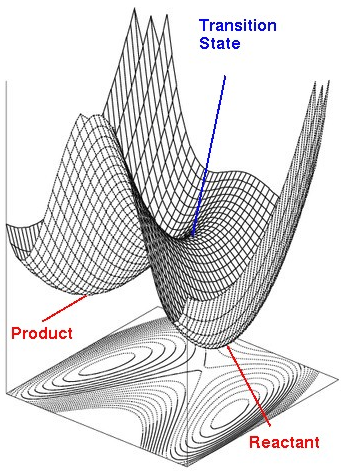
The number of normal modes of vibration = 3N–5 for linear and 3N–6 for nonlinear molecules which is also the number of degree of freedom. Hence, the potential energy surface (PES) is plotted with potential energy against every degree of freedom. Potential energy surface could be to analyse the molecular geometry and reaction dynamics. The necessary points can be classified according to the first and second derivatives of the energy with respect to position, which respectively are the gradient and the curvature. A stationary point on a PES is a nuclear configuration where all the forces vanish, (q is the order parameter), which could be mixima or minima. Energy minima correspond to stable chemical species which refers to products and reactants and saddle point represents transition states which is the highest point of energy on the reaction coordinate. This reaction pathway is also the lowest energy pathway.
At reactants and products, the curvature is positive,>0, because they are at local minima, and in transition state, the second derivative at this point is negative, because it is a maximum point, and along the order parameter, energy will always decrease to form either products or reactants.
In the TS, because the bonds between atoms are being stretched or compressed, a simple harmonic oscillator model could be used to relate frequencies of TS and the second derivative of TS energy. The equations are shown below.
The second derivative of potential energy is equal to force constant:
Thus frequency could be calculated: where
This explains why the first mode of TS vibrational frequency is always negative and imaginary.
Nf710 (talk) 10:40, 9 February 2018 (UTC) OK section. You could have mentioned how you obtain the eigenvalues by diagoinalising the hessian,
Nf710 (talk) 10:42, 9 February 2018 (UTC) You could have also mentioned something about the quantum mechanics behind the calculations.
Exercise 1
The Diels-Alder reaction of butadiene with ethylene is shown below, and the product, cyclohexene is formed from cis butadiene exclusively, which is due to trans butadiene is unable to form orbital overlap with ethylene.

Optimization
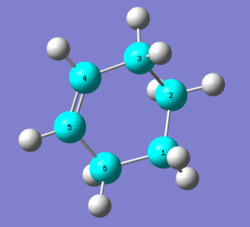
The reactants, product and transition state were optimized at PM6 level, and the structures of the optimized geometry are shown on table 1.
| Optimized Structure | |||||||||||
|---|---|---|---|---|---|---|---|---|---|---|---|
| 1,3-butadiene | Ethylene | Transition State | Cyclohexene | ||||||||
IRC and frequency analysis
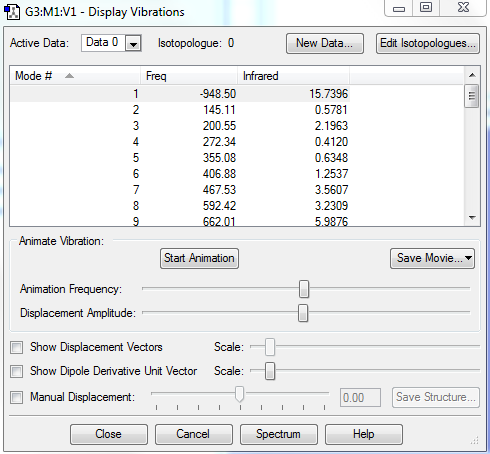
The transition state could be confirmed by doing frequency analysis and IRC in Gaussview. The diagram of the vibration is shown on figure 3, and IRC of transition state is shown on figure 4.
The negative frequency are imaginary since frequencies are computed from the square roots of negative force constants which is due to the bond formation or breaking. Frequencies indicate the curvature of the potential energy, the negative frequency means a saddle point (transition state), which is a potential energy maximum. Thus, for the transition state, a negtive frequency is expected for the first vibrational mode (one and only one).
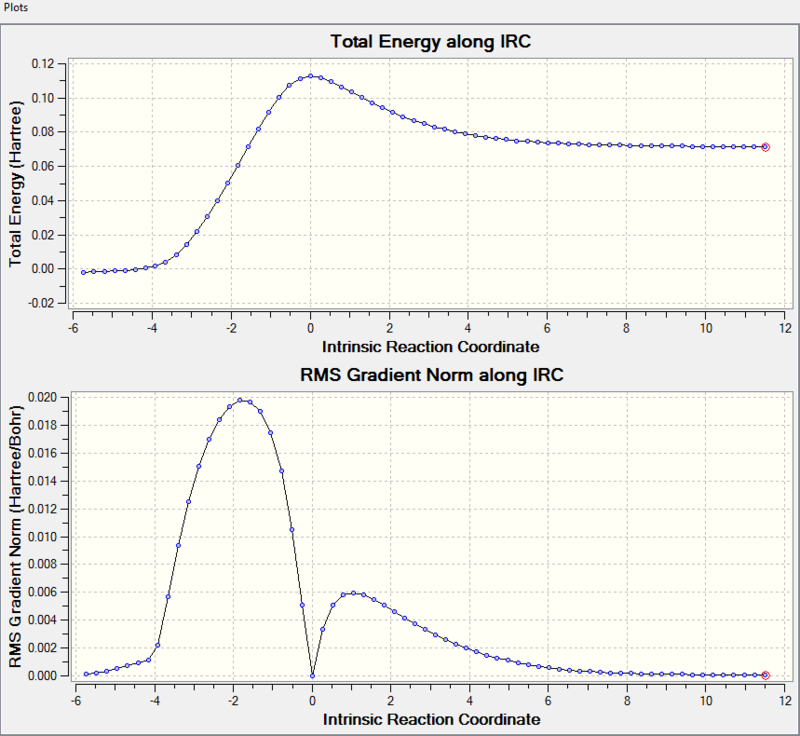
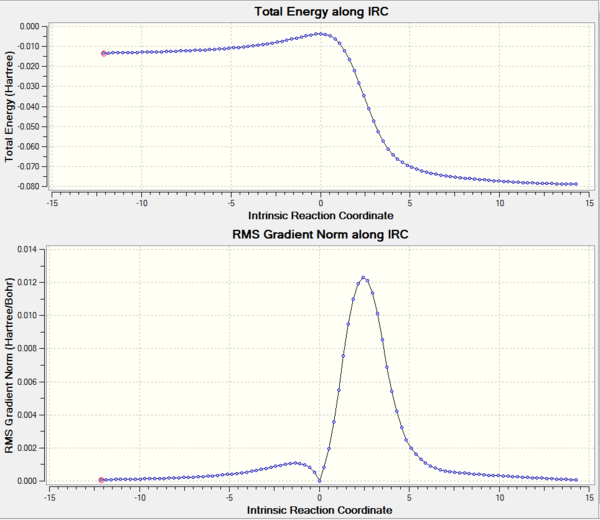
The minimum energy pathway is shown on the upper graph while the lower graph is the gradient norm along IRC where products, transition states and reactants (maxima/minima) all have a gradient of 0. Comparing the 3 stationary points on the upper graph with the 3 minima on the lower graph, they all match with each other which further confirmed the transition state geometry is correct. However, the Gaussview calculate the IRC from the transition state which has the highest energy, both reactants and products have lower energy than the transition state, so the intrinsic reaction coordinate could start from reactant to product or from product to reactant. The left stationary point is the product and the right one represents reactant.
Molecular orbitals analysis
| HOMO of diene, Symmetric | LUMO of diene, Antisymmetric | HOMO of alkene, Symmetric | LUMO of alkene, Antisymmetric | ||||||||
| HOMO-1 of TS, Antisymmetric | HOMO of TS, Symmetric | LUMO of TS, Symmetric | LUMO+1 of TS, Antisymmetric | ||||||||
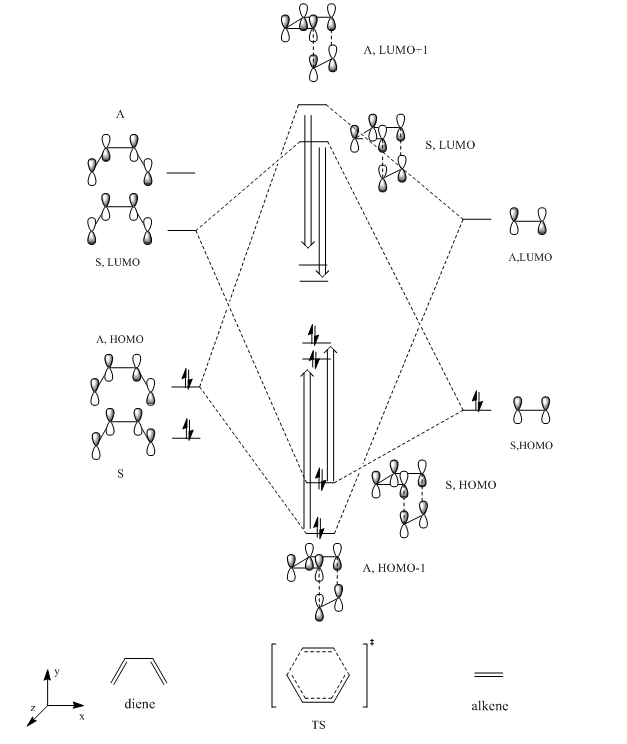
The molecular orbital diagram could be constructed by observing the MOs illustrated in the Gaussview. Due to butadiene is more electron rich, the energy gap between butadiene HOMO and LUMO is smaller than that of ethylene. According to the experimental data, the energy of TS HOMO and HOMO-1 are higher than expected while LUMO, LUMO+1 have lower energy than expected. This phenomenon is due to mixing which tends to be large when the MOs are in HOMO-LUMO region. Also at TS the electrons are delocalized on the molecular orbitals thus stabilized the antibonding orbitals and destabilized the bonding orbitals.
(Fv611 (talk) Also, remember that the TS is the highest energy structure on the minimum energy pathway, so it is expected to have bonding orbitals that are higher in energy. This is a good discussion, but it would have benefited from a more careful look at the energies of your computed TS MOs, which would have led you to the right ordering of MOs and FMOs.)
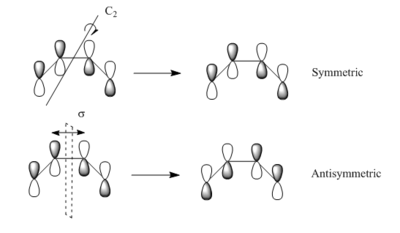
According to woodward-hoffmann rule, only orbitals with the same symmetry could interact and form overlap with each other. For this Diels-Alder reaction, the symmetric LUMO of butadiene interact with symmetric HOMO of ethylene and form transition state MOs with the same symmetry label. Antisymmetric LUMO and HOMO of the reactants form antisymmetric LUMO+1 and HOMO-1 of transition state as illustrated on figure 5.
| Illustration of asymmetric and symmetric MOs | Requirement of MO overlap | ||||
|---|---|---|---|---|---|
|

|
Bond length analysis
| The standard carbon-carbon bond lengths | ||||||
|---|---|---|---|---|---|---|
| C-C bond | sp3carbon - sp3carbon single bond | sp3carbon - sp2carbon single bond | sp2carbon - sp2carbon single bond | carbon=carbon double bond | van der Waals radius of carbon atom | van der Waals distance of 2 carbon atoms |
| Bond length | 1.54Å | 1.50Å | 1.47Å | 1.34Å | 1.70Å | 3.40Å |
The C-C bond lengths of the reactants, product and the TS are shown on table 4, the standard C-C bond lengths and the Van der Waals radius of the C atom are presented on table 5.
At transition state, the C=C double bond of butadiene and ethylene become longer, because the double bonds are only partially breaking, the electrons are delocalized and on the way to form a single bond.
Also, the distance between terminal carbon atoms in the TS is 2.11 Å, which is much smaller than the standard Van der Waals radius between 2 carbon atoms which is 3.4 Å and longer than standard sp3-sp3 C-C single bond 1.54 Å. This indicates the single bonds in the transition state are only partially formed, but the distance between carbon atoms need to be remained within the Van der Waals radius to provide enough affinity for the bond formation. C2-C3 and C1-C6 distances are reduced from 2.11 Å at transition state to 1.54 Å in the product, this is an indication of new single bond formation in the product.
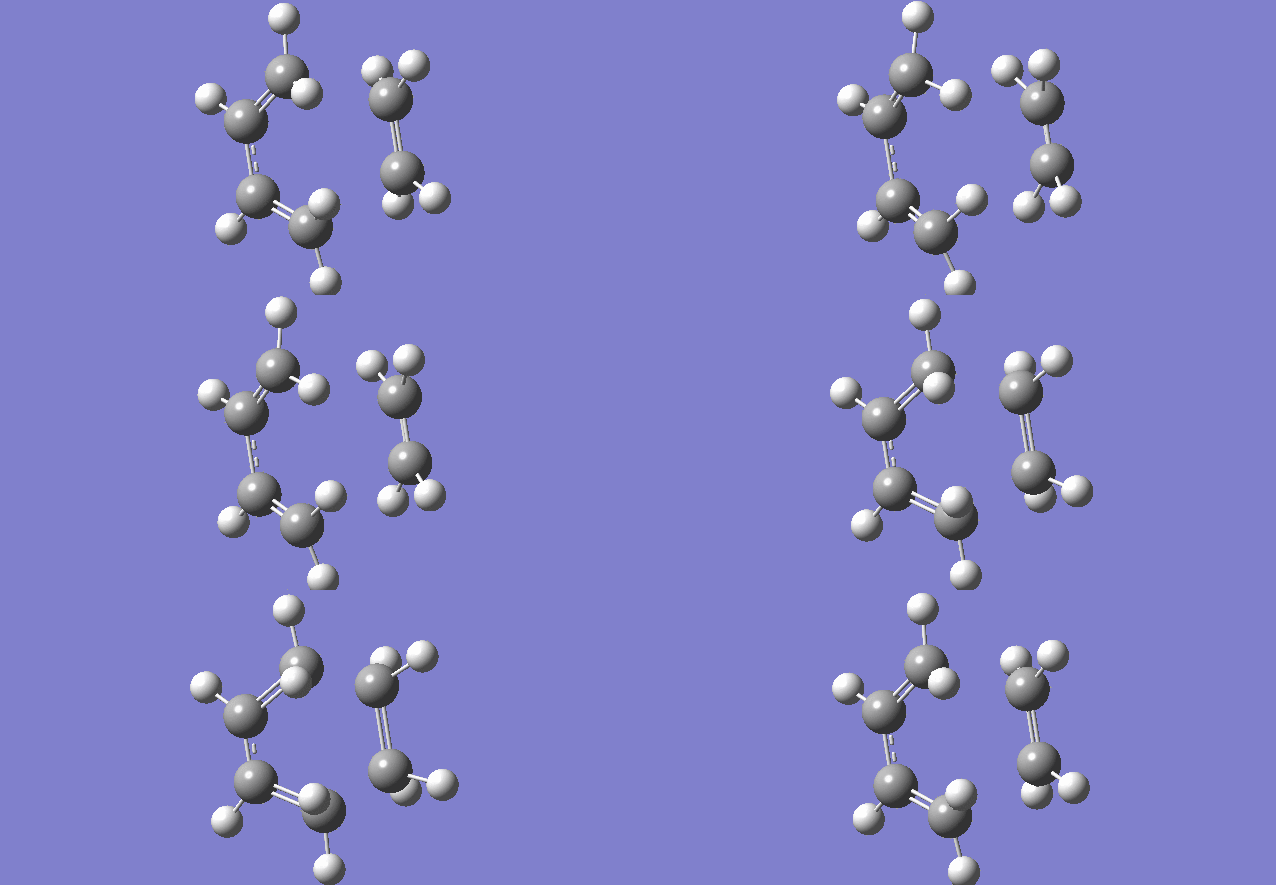
The animation of the vibration mode is shown on the last picture on table 4, the frequency is -948.50cm-1 (figure 3). The 2 terminal carbons on butadiene and 2 carbons on ethylene vibrates and approaches to each other simultaneously.
Exercise 2
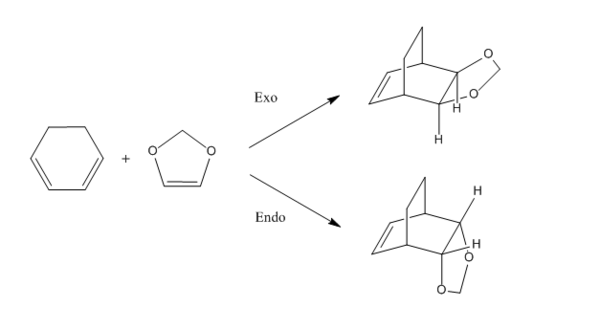
This Diels-Alder reaction between cyclohexadiene and 1,3-dioxole will lead to exo or endo product which is under thermodynamic control and kinetic control respectively. The reaction activation barrier of forming both products are investigated in this exercise.
Optimisation at B3LYP/6-31G(d)
The reactants, product, endo and exo transition state were optimized at B3LYP/6-31G(d) level, and the structures of the optimized geometry are shown on table 6.
| Optimized Structure | |||||||||||||||||
|---|---|---|---|---|---|---|---|---|---|---|---|---|---|---|---|---|---|
| Cyclohexadiene | 1,3-Dioxole | Endo TS | Exo TS | Endo product | Exo product | ||||||||||||
Frequency analysis
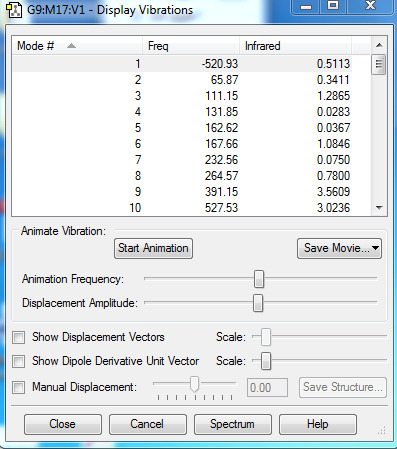
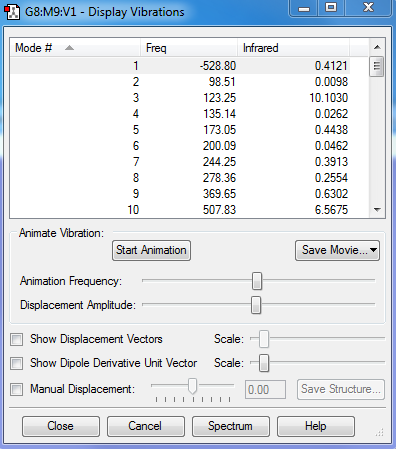
| The frequencies of endo TS and exo TS | |
|---|---|
 |
 |
| Endo TS vibrations | Exo TS vibrations |
From the frequency analysis, there is only one negative imaginary frequency for both endo and exo TS, and it can be confirmed that all TS were correctly optimised.
MO analysis
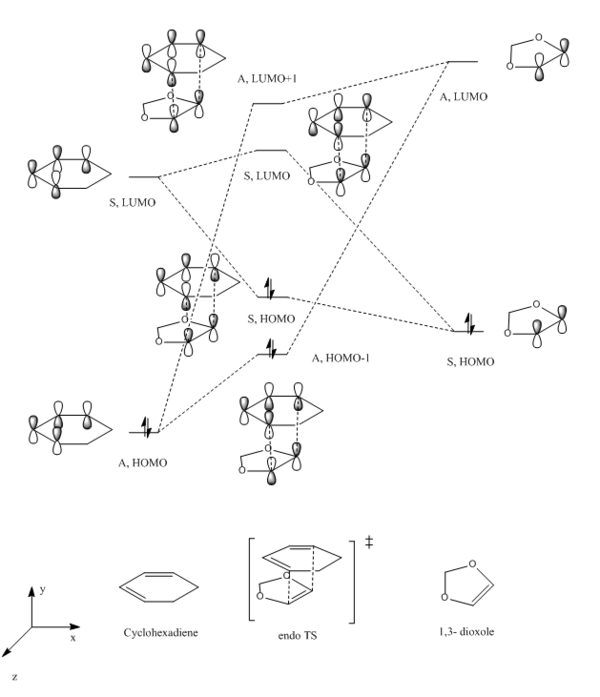
(Fv611 (talk) Excellent MO diagrams. Good that you showed the difference between the endo and exo case, even if you could have discussed it a bit more.)
 |
 |
| HOMO of cyclohexadiene, Antiymmetric | LUMO of cyclohexadiene, Symmetric | HOMO of 1,3-dioxole, Symmetric | LUMO of 1,3-dioxole, Antisymmetric | ||||||||
| HOMO-1 of endo TS, Antisymmetric | HOMO of endo TS, Symmetric | LUMO of endo TS, Symmetric | LUMO+1 of endo TS, Antisymmetric | ||||||||
| HOMO-1 of exo TS, Antisymmetric | HOMO of exo TS, Symmetric | LUMO of exo TS, Symmetric | LUMO+1 of exo TS, Antisymmetric | ||||||||
Normal or inverse electron demand
The relative energies of the frontier MOs (including HOMO and LUMO) could be used to explain the reactivity (shown on table 8). Because the key interaction in cycloaddition TS is between the HOMO of one reactant and LUMO of another reactant which could be either dienophile or diene, as a result, 2 types of interaction could be identified. For normal electron demand, HOMO of diene will overlap with LUMO of dienophile, this happens when the diene is electron rich and the dienophile is electron deficient. Inverse electron demand is achieved by reverse the substitution pattern, the electron withdrawing group on the diene makes it electron poor thus decrease the LUMO energy, and electron donating group on dienophile raised the energy of HOMO up. The energy gap between LUMO of diene and HOMO of dienophile is reduced, hence interact with each other.
A single point energy calculation at the combined reactant geometries was done, The MO energies calculated confirmed both reactions are inverse electron demand. Both LUMO and HOMO of Cyclohexadiene have lower energies than 1,3-Dioxole. But the energy gap between 1,3-Dioxole HOMO-LUMO is larger than that of cyclohexadiene. Because the 2 oxygen atoms on the dienophile (1,3-dioxole) will donate electron to the C=C double bond and makes it electron rich thus raise up the energy levels of 1,3-Dioxole. The resultant energy gap between LUMO of cyclohexadiene and HOMO of 1,3 dioxole is 540.66 KJ/mol which is smaller than the energy gap between HOMO of cyclohexadiene and LUMO of 1,3-dioxole 612.88 KJ/mol. Hence, both exo and endo have inverse electron demand.
Nf710 (talk) 10:49, 9 February 2018 (UTC) Excellent ythat you did this. You could have shown it with some Jmols etc for proof.
Reaction barriers and reaction energies at room temperature
| Substrates | Gibbs free energy optimised at PM6 / KJmol-1 | Gibbs free energy optimised at B3LYP (6-31G(d)) / KJmol-1 |
| Cyclohexadiene | -395.4563 | -612382.638 |
| 1,3-Dioxole | -55.29825 | -700975.023 |
| Sum of reactant energy | -450.7545 | -1313357.588 |
| Exo-TS | -479.59275 | -1313249.199 |
| Exo-Product | -208.02075 | -1313460.488 |
| Endo-TS | -477.763125 | -1313255.094 |
| Endo-Product | -207.225375 | -1313464.163 |
| PM6 / KJmol-1 | B3LYP (6-31G(d)) / KJmol-1 | ||||
|---|---|---|---|---|---|
| Endo | Exo | Endo | Exo | ||
| Activation barrier (Eact) /kJmol-1 | + 28.838 | + 27.009 | + 102.503 | + 108.392 | |
| Reaction energy /kJmol-1 | - 243.531 | - 242.732 | - 106.575 | -102.900 | |
The activation energy and total energy of reaction were calculated and summarized in table 3. (Activation barrier could be calculated by the difference in energy between TS and reactants. The total energy of the reaction is the energy difference between reactants and products.) From the table, we can see endo reaction possess with a lower activation energy and reaction energy, which makes it a more favorable reaction kinetically under normal conditions.
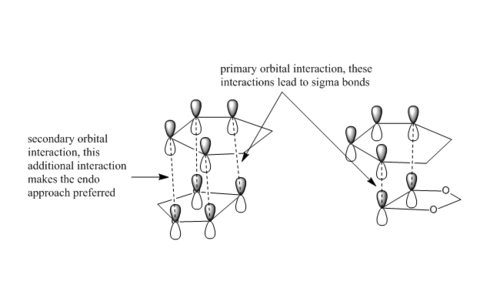
Endo approach is often preferred because of secondary orbital interactions(SOI) between the C-O non-bonding p-orbital lobes and the back lobes of the cyclohexadiene HOMO. No bonds are formed from these interactions, but the transition state energy is lowered by such interaction, and this endo product will be formed faster, this is an indication of lower activation barrier. However, the lower total reaction energy cannot be explained by SOI because this type of interaction is not shown on the product.The higher reaction energy and activation barrier of exo reaction comes from the exo product is more sterically hindered due to the presence of sp3 hybridized bridge carbon (energy need to be put in to force the geometry to be formed). As a conclusion, exo product is thermodynamically favored while endo product is kinetically favored.
Nf710 (talk) 10:57, 9 February 2018 (UTC) This was a good section. You unfortunatly did not get the correct energies however, but luckily you have still come to the correct conclusions. Nice diagrams and Jmols.
Exercise 3
Xylylene and sulfur dioxide could undergo 3 different mechanisms which refers to endo Diels Alder reaction, exo Diels Alder reaction and cheletropic reaction to form corresponding products. Which reaction route is most preferred is investigated in this exercise.
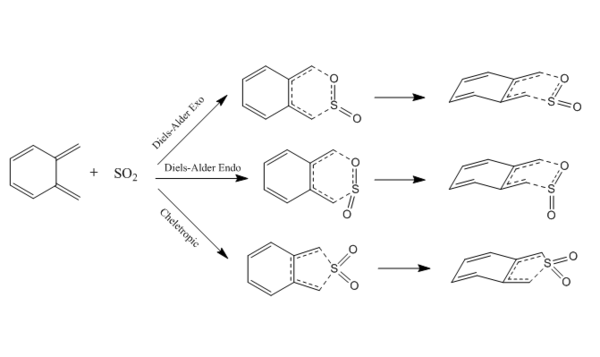
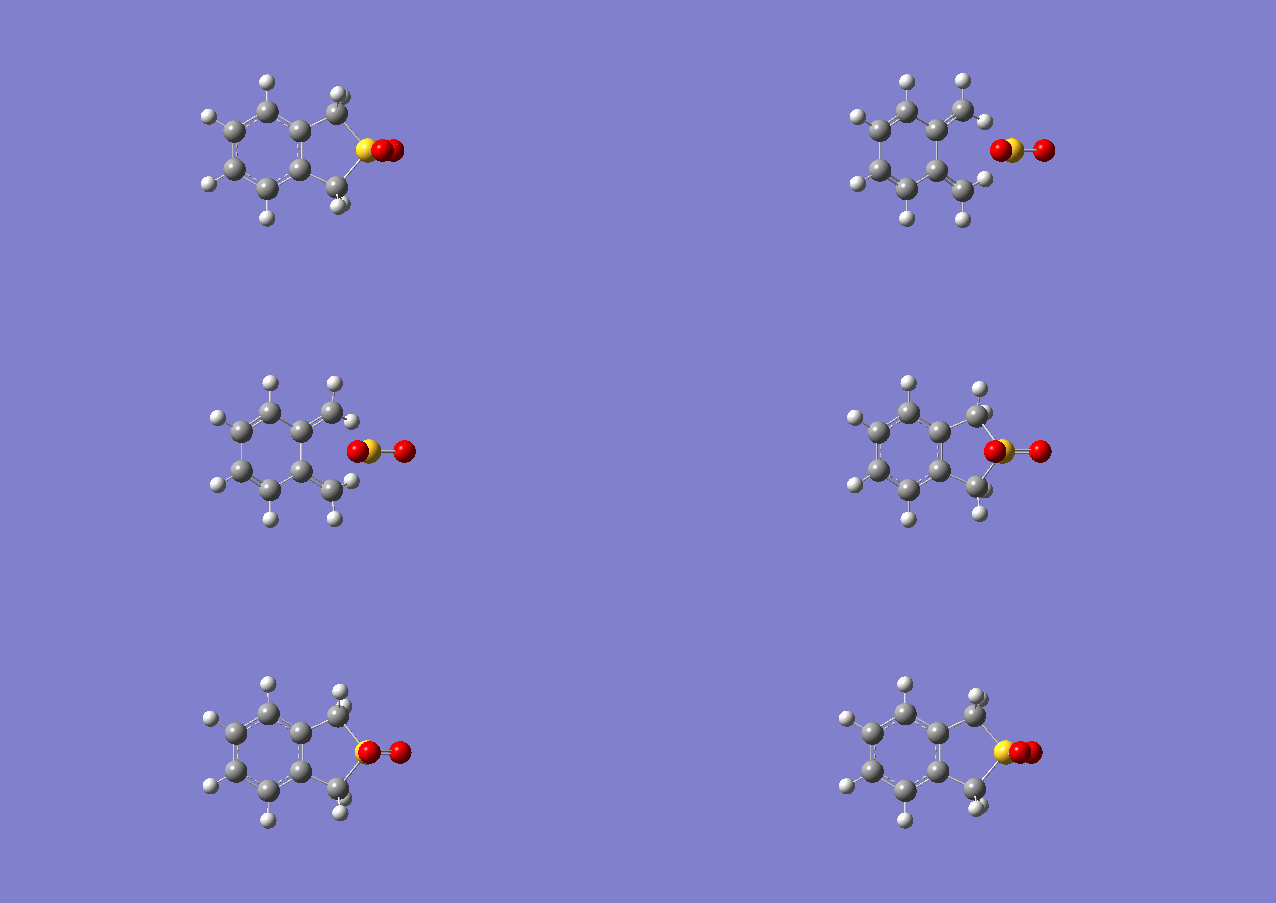
(You're showing the TSs again instead of the products Tam10 (talk) 14:02, 4 February 2018 (UTC))
Optimisation of TS at PM6 level
The transition state of exo D-A, endo D-A and cheletropic reaction were optimized at PM6 level, and the structures of the optimized geometry are shown on table 12.
| Optimized Structure | ||||||||
|---|---|---|---|---|---|---|---|---|
| Diels-Alder endo | Diels-Alder exo | Cheletropic | ||||||
(Make sure you use the correct frames for you JMols Tam10 (talk) 14:02, 4 February 2018 (UTC))
IRC analysis
Reaction barrier and reaction energy
| Substrates | Gibbs free energy at PM6 / kJmol-1 | Substrates | Gibbs free energy at PM6 / kJmol-1 | Substrates | Gibbs free energy at PM6 / kJmol-1 |
| SO2 | -313.534 | Endo-DA-TS | 239.880 | Endo-DA-product | 59.152 |
| Xylylene | 469.783 | Exo-DA-TS | 243.983 | Exo-DA-product | 58.548 |
| Sum of reactants energy | 156.249 | Cheletropic-TS | 262.093 | Cheletropic product | -0.0148 |
| PM6 / kJmol-1 | |||
|---|---|---|---|
| Exo DA | Endo DA | Cheletropic | |
| Activation energy /kJmol-1 | + 87.734 | + 83.631 | + 105.844 |
| Reaction energy /kJmol-1 | - 97.701 | - 97.097 | - 156.234 |
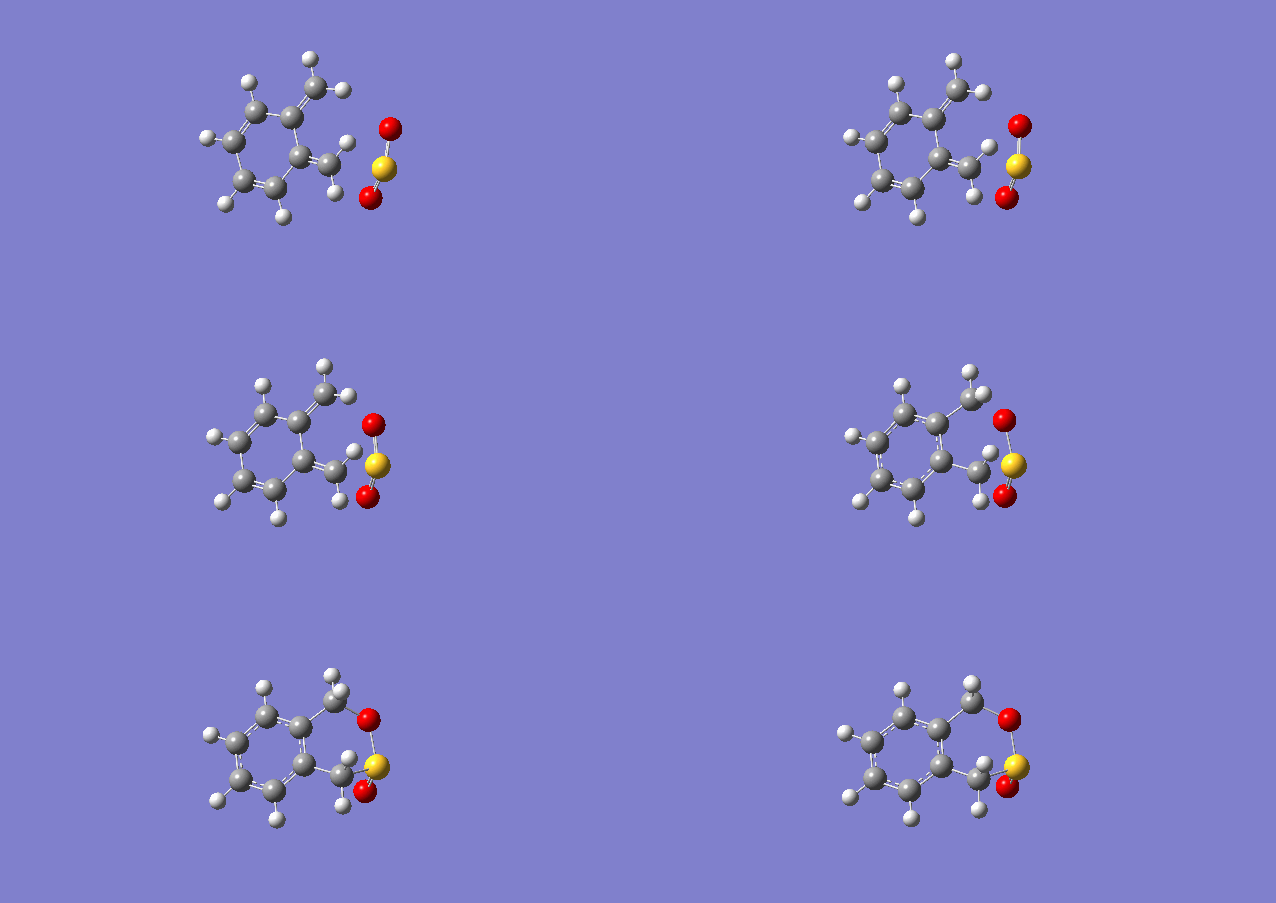
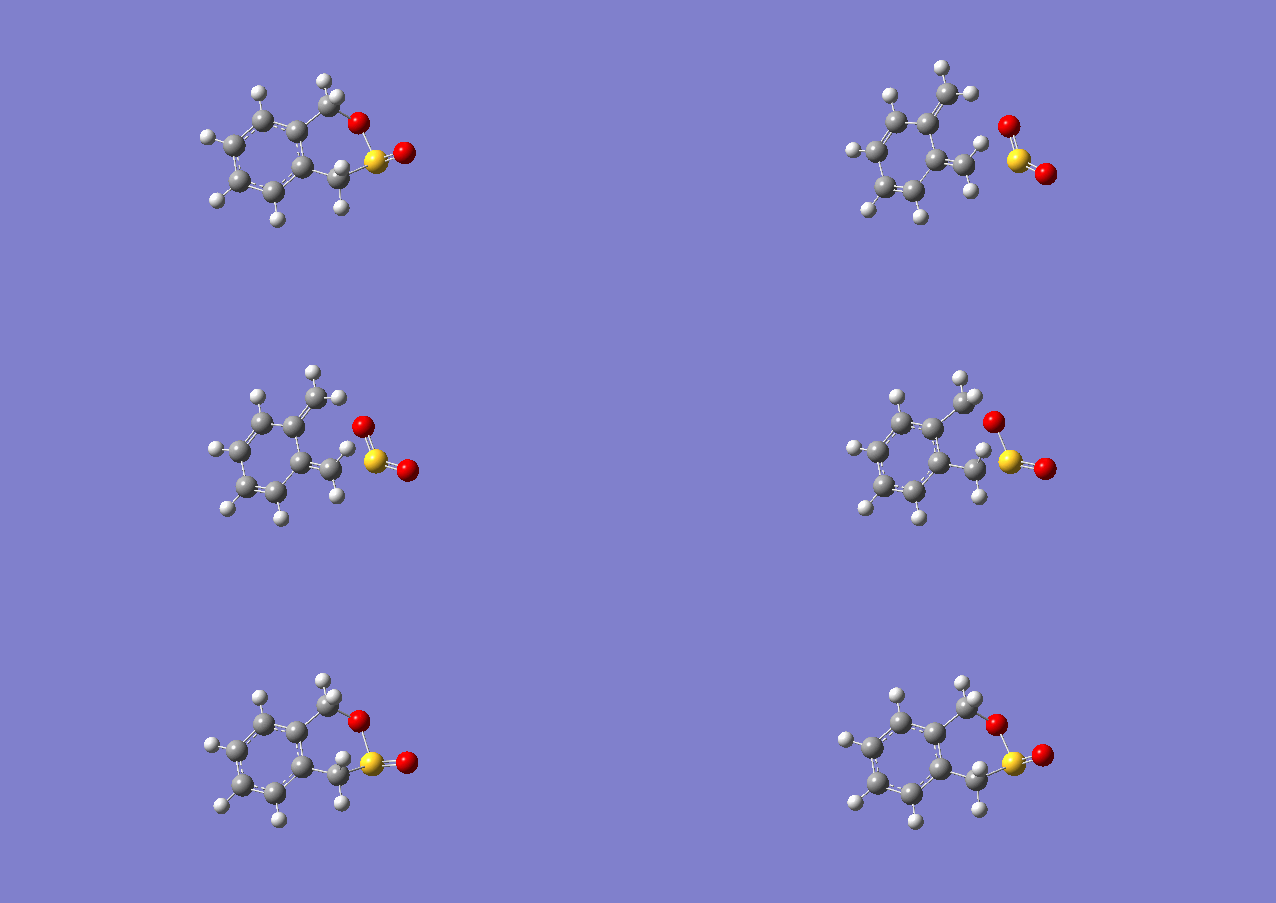
The IRC provide information of the activation barrier and total reaction energy. The calculation of the energies was done and summarized on table 15. According to the IRC on table 13 and the data in table 15, the small activation energy might due to the highly unstable reactant xylylene.
The driving force of the reaction is the formation of more stable 6-membered aromatic ring in the product. Also, the rigid structure of the exocyclic cis diene (constrained to cis position) makes this reaction favorable. The bond length between carbon atoms in 6-membered ring of xylylene in TS and product are analyzed. The C=C double bond within the xylylene ring become longer and C-C single bond become slightly shorter during the formation of transition state. In the product, all carbon-carbon bonds length become equal due to the delocalization of electrons. This could be observed by the transition state approach trajectories of 3 reaction routes which are shown above.
Reaction profile
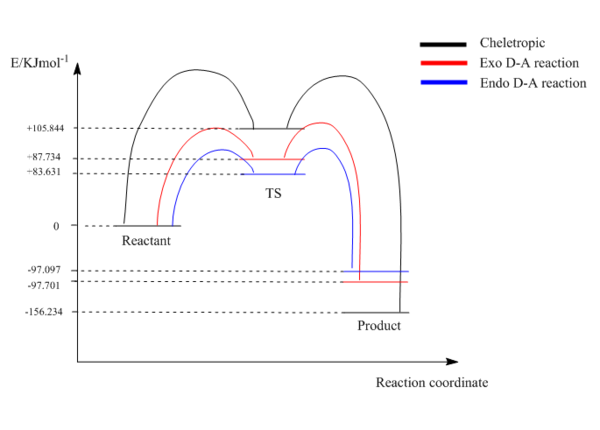
(Don't draw reaction profiles like this. You're showing energies above the TS by doing this, making your TSs look like intermediate geometries which they are not. Your curved lines also suggest a non-zero gradient. Please contact me if you don't understand what I mean Tam10 (talk) 14:02, 4 February 2018 (UTC))
The reaction profile is shown above. As figure 9 shown, endo Diels-Alder reaction needs least amount of activation energy, the product forms most quickly and is under kinetic control. The cheletropic reaction requires the largest amount of activation energy thus forms the most stable thermodynamic product which is favored under high temperatures. Also, unlike the 2 reactants in exercise 2 which forms exo product with higher activation barrier because of the steric reasons, the contribution of steric effect is quite small in cycloaddition of xylylene and sulfur dioxide, thus the difference between exo and endo activation barrier is small in exercise 3. The cheletropic product is favoured thermodynamically because it gives a more stable 5-membered ring.
(The stabilisation of the cheletropic product is also from the fact that the S=O bonds are retained Tam10 (talk) 14:02, 4 February 2018 (UTC))
Conclusion
A basis set of PM6 was first used to optimise the structures of TS which is not very accurate. Thus, in order to obtain a better optimisation, basis set 6-31G(d) could be used.
Frequency and IRC analysis allow us to determine the correct TS geometry by checking if the first mode of vibration has a negative imaginary frequency and if all reactants, products and TS geometry have gradient of 0, respectively. From MO constructed by Gaussview, a diagram of the TS MO could be drawn which follow the rule that only MO with same symmetry label could overlap. Also, single point energy calculation of MO enables us to find whether this cycloaddition reaction is inverse electron demand or normal electron demand according to the MO energy levels of reactants.
By calculating the activation barrier and reaction energy of a particular reaction, the most favoured reaction pathway could be recognised, which has the lowest activation energy and reaction energy. The reaction with lowest activation energy is often under kinetic control while the reaction require highest energy of activation is under thermodynamic control. In conclusion, by building molecules or reactive systems in Guassview, we can graphically examine results (single point energy, bond length, dipole moment, geometry optimization, frequency, reaction path following, etc) which enables us to solve the chemical problems more efficiently, and it also help us to understand the reaction better.
Files
| Butadiene | File:XZ9215BUTADIENE.LOG |
| Ethene | File:XZ9215ETHYLENE.LOG |
| TS | File:XZ9215 E1 CYCLOHAXENE TS.LOG |
| Cyclohexene | File:XZ9215CYCLOHAXENE TS1.LOG |
| IRC | File:XZ9215E1CYCLOHAXENE IRC.LOG |
| Cyclohexadiene | File:XZ9215CYCLOHEXDIENE.LOG |
| 1,3-dioxole | File:XZ921513DIOXOLE.LOG |
| Exo TS | File:XZ9215E2EXODIOXOLE TS POP.LOG |
| Endo TS | File:XZ9215E2endoTS POP.LOG |
| Exo product | File:XZ9215 exo EXODIOXOLE 631GD.LOG |
| Endo product | File:XZ9215endo1133 TS 631GD.LOG |
| Endo TS | File:XZ9215E3 D-A ENDO TS.LOG |
| Exo TS | File:XZ9215E3 D-A EXO TS.LOG |
| Cheletropic TS | File:XZ9215 E3 cheletropic PRODUCT TS.LOG |
| Endo IRC | File:XZ9215 E3ENDO IRC.LOG |
| Exo IRC | File:XZ9215 E3 EXO IRC.LOG |
| Cheletropic IRC | File:XZ9215 E3 PRODUCT IRC.LOG |


