Rep:MOD:XYK172019
BH3
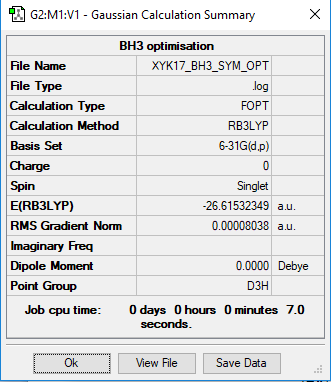
Calculation method: RB3LYP
Basis set: 6-31G(d.p)
Ng611 (talk) 21:04, 5 June 2019 (BST) Use the summary table from the frequency job for which you provided the .log file.
Optimisation
 Item                     Value       Threshold     Converged?
 Maximum Force            0.000161     0.000450     YES
 RMS     Force            0.000105     0.000300     YES
 Maximum Displacement     0.000638     0.001800     YES
 RMS     Displacement     0.000417     0.001200     YES
Frequency analysis
Frequency file: bh3_frequency.log
  Low frequencies ---   -0.1187   -0.0048    0.0010   42.2482   42.2484   43.3387
  Low frequencies ---   1163.5889 1213.5519 1213.5521
optimised BH3 molecule |
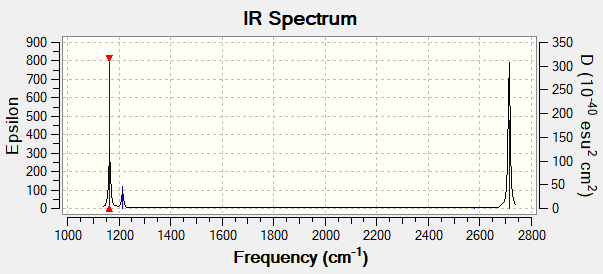
Vibrations for BH3
| wavenumber (cm-1) | Intensity (arbitrary units) | symmetry | IR active? | type |
| 1164 | 93 | A1 | yes | out-of-plane bend |
| 1214 | 14 | E | very slight | bend/angle deformation |
| 1214 | 14 | E | very slight | bend/angle deformation |
| 2580 | 0 | A1 | no | symmetric bond stretch |
| 2713 | 126 | E | yes | asymmetric bond stretch |
| 2713 | 126 | E | yes | asymmetric bond stretch |
There are 6 vibrational modes as [3(4)-6]= 6, with two sets of degenerate vibrations: mode 2 and mode 3 which is responsible for angle deformation, and mode 5 and mode 6 which is responsible for bond stretch. Theoretically there should be 4 vibrational peaks in total, as each set of degenerate vibrations will result in a single peak. However experimentally there were only 3 peaks in the IR spectrum, and the vibrational peak at 2580 cm-1 was not observed. This is because in order for a vibrational mode to absorb infrared light, there must be an overall change in the dipole moment of the molecule. The vibrational mode at 2580 cm-1 is a completely symmetric stretch and its dipoles cancel off, therefore it is IR inactive.
Molecular orbitals
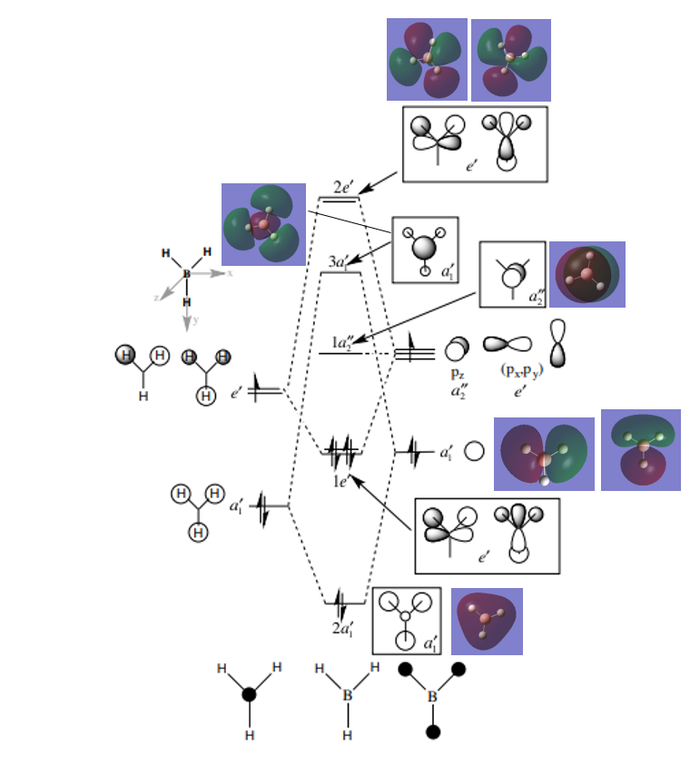
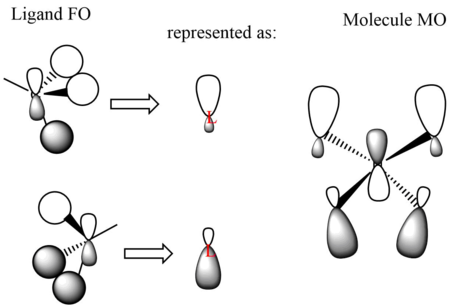
MO diagram taken from [1]
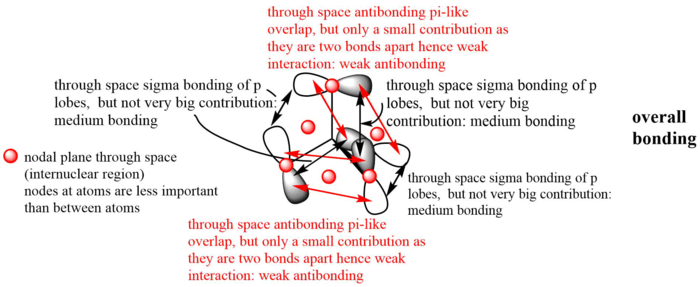
It can be seen that the LCAO molecular orbitals (MO) are not significantly different from the real MOs, except that the real MOs have more diffuse and larger orbitals. The phases between them are the same. We can say that LCAO is an useful approximation and that we can use MO theory (and MO diagrams) to mostly understand the bonding and reactivity of a molecule - a qualitative analysis.
Ng611 (talk) 20:59, 5 June 2019 (BST) There are some more significant differences than diffusivity. Can you identify them?
NH3
Calculation method: RB3LYP
Basis set: 6-31G(d.p)
Optimisation
 Item                     Value       Threshold    Converged?
 Maximum Force            0.000050     0.000450     YES
 RMS     Force            0.000035     0.000300     YES
 Maximum Displacement     0.000221     0.001800     YES
 RMS     Displacement     0.000096     0.001200     YES
Frequency analysis
Frequency file: nh3_frequency.log
 Low frequencies ---  -28.3223  -28.3221  -25.0345    0.0014    0.0016    0.0040
 Low frequencies --- 1088.2807 1693.7780 1693.7780
optimised NH3 molecule |
Vibrations for NH3
| wavenumber (cm-1) | Intensity (arbitrary units) | symmetry | IR active? | type |
| 1088 | 146 | A1 | yes | out-of-plane bend |
| 1694 | 14 | E | very slight | bend |
| 1694 | 14 | E | very slight | bend |
| 3462 | 1 | A1 | no | symmetric stretch |
| 3591 | 0 | E | no | asymmetric stretch |
| 3591 | 0 | E | no | asymmetric stretch |
NH3BH3
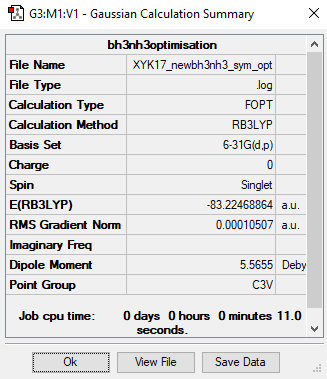
Calculation method: RB3LYP
Basis set: 6-31G(d.p)
Optimisation
 Item                     Value       Threshold    Converged?
 Maximum Force            0.000218     0.000450     YES
 RMS     Force            0.000097     0.000300     YES
 Maximum Displacement     0.000788     0.001800     YES
 RMS     Displacement     0.000450     0.001200     YES
Frequency analysis
Frequency file: bh3nh3_frequency.log
  Low frequencies ---   -0.0197   -0.0023    0.0009   21.7711   21.7729   48.1543
  Low frequencies ---  267.7721  631.8557  640.1246
optimised NH3BH3 molecule |
Association energy
E(BH3)= -26.61532349 a.u.
E(NH3)= -56.55776871 a.u.
E(NH3BH3)= -83.22468864 a.u.
Association energy:
ΔE = E(NH3BH3)-[E(BH3)+E(NH3)]
= -83.22468864 - [(-26.61532349)+(-56.55776871)]
= -0.05159644 a.u.
= -135 kJ mol-1 (to nearest 1 kJ mol-1)
The B-N dative bond is quite weak with bond energy of 135 kJ mol-1, and only small amount of energy is released for the binding of NH3 and BH3. This value is compared against moderately strong C-C with bond energy of 346 kJ mol-1 [2] and also a strong bond C-H with bond energy of 411 kJ mol-1 [2]. Besides, it is most likely that B-N has a great bond length.
Ng611 (talk) 21:01, 5 June 2019 (BST) Good calculations and comparisons. A textbook source is definitely better than a website though -- try to use a textual source in the future.
NI3
Calculation method: RB3LYP
Basis set: Gen
Optimisation
 Item               Value     Threshold  Converged?
 Maximum Force            0.000108     0.000450     YES
 RMS     Force            0.000037     0.000300     YES
 Maximum Displacement     0.000774     0.001800     YES
 RMS     Displacement     0.000317     0.001200     YES
Frequency analysis
Frequency file: ni3_frequency.log
 Low frequencies ---   -4.6918   -0.0003   -0.0003   -0.0002    3.0873    4.4353
 Low frequencies ---  101.2739  101.3616  148.3436
optimised NI3 molecule |
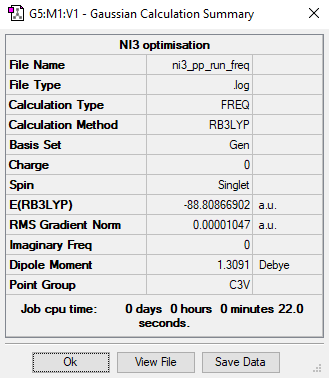
Optimised N-I bond distance: 2.1837 Angstrom
Ng611 (talk) 21:02, 5 June 2019 (BST) For these calculations, your bond values are accurate to 3 d.p. and should be reported as such.
Mini Project - Ionic liquids
[N(CH3)4]+
Calculation method: RB3LYP
Basis set: 6-31G(d.p)
Optimisation
 Item                     Value       Threshold    Converged?
 Maximum Force            0.000118     0.000450     YES
 RMS     Force            0.000047     0.000300     YES
 Maximum Displacement     0.000428     0.001800     YES
 RMS     Displacement     0.000189     0.001200     YES
Frequency analysis
Frequency file: [N(CH3)4]+_frequency.log
  Low frequencies ---   -0.0009   -0.0006   -0.0006   18.2688   18.2688   18.2688
  Low frequencies ---  184.2396  289.9254  289.9254
optimised [N(CH3)4]+ molecule |
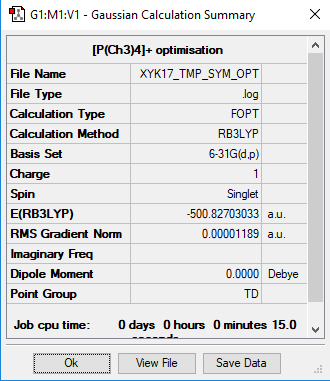
[P(CH3)4]+
Calculation method: RB3LYP
Basis set: 6-31G(d.p)
Optimisation
 Item                     Value        Threshold   Converged?
 Maximum Force            0.000058     0.000450     YES
 RMS     Force            0.000018     0.000300     YES
 Maximum Displacement     0.000507     0.001800     YES
 RMS     Displacement     0.000202     0.001200     YES
Frequency analysis
Frequency file: [P(CH3)4]+_frequency.log
 Low frequencies ---   -0.0023   -0.0020   -0.0013   24.0125   24.0125   24.0125
 Low frequencies ---  159.9844  194.7639  194.7639
optimised [P(CH3)4]+ molecule |
Charge distribution
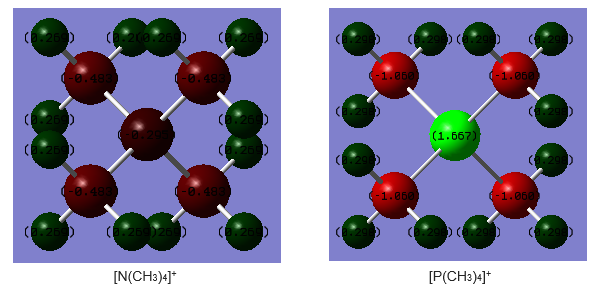
Large, same range of colour was used to visualise the both the charge distribution. It is because this can be used as a contrast and compare against the large charge distribution range in |[P(CH3)4]+ molecule, shown by very different colour intensities.
| Structure | Charge on central atom (N/P) | Charge on C atom | Charge on H atom |
|---|---|---|---|
| [N(CH3)4]+ | -0.295 | -0.483 | 0.269 |
| [P(CH3)4]+ | 1.667 | -1.060 | 0.298 |
[N(CH3)4]+:
Nitrogen and carbon have negative charge distribution, with carbon being more negatively charged although C(2.55)[3] is less electronegative than N(3.04). Whereas hydrogen has positive charge distribution, as agreed with theory as it is least electronegative (2.20)[3]. The charge distribution shows that the central atom N tends to draw electron density from the H atoms in the methyl groups, therefore the positive charge is on the H atoms.
According to the commonly used Lewis structure, the +1 formal charge of the molecule is assigned to the central atom N, but the charge distribution calculated above do not support this assignment. It shows that the most positive potentials appear on the Hs, and the positive charge is spread equally over the Hs. The N in [N(CH3)4]+ carries a +1 charge if it shares bonding electrons equally with the C in methyl group, but we know that N is more electronegative than H, so the Lewis structure does not give accurate charge information for the ions.
[P(CH3)4]+:
The charge distribution agrees with the values of electronegativities (P:2.19, C:2.55, H:2.20)[3] - as C atom is most electronegative, it tends to attract the shared pair of electrons more strongly towards itself, resulting in greater electron charge cloud which develops negative charge. Whereas P which is the most electropositive atom, has the most positive charge. The difference in charge distribution in the molecule is fairly large, as shown by the greatly different colour intensities.
Comparison:
Considering the electronegativities of the central atom(N: 3.04, P: 2.19)[3], N is more electronegative than P, which is reflected in the charge distribution where N has negative charge of -0.269 in N(CH3)4]+ whereas P have positive charge of +1.667 [P(CH3)4]+. In N(CH3)4]+, the most electron density is towards the N atoms and C atoms, whereas in N(CH3)4]+, the most electron density is towards the C atoms in methyl group. But in both molecule, H atoms have positive charges. Besides, it can be seen that the P-C bond in [P(CH3)4]+ has a much greater charge distribution difference compared to N-C bond in N(CH3)4]+, therefore P-C is mostly likely to be a more polar bond, and this might result in its greater reactivity due to the greater polarity.
Ng611 (talk) 21:06, 5 June 2019 (BST) Good discussion about electronegativity, some other things to consider are the point groups of the molecules and the effect that the resulting symmetry has on the charge distribution.
Molecular orbitals of [N(CH3)4]+
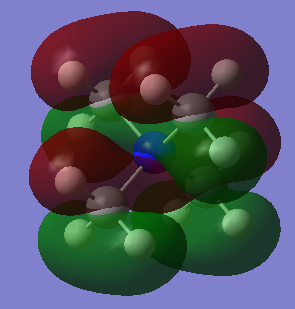
MO21 (HOMO)
Energy: -0.57936 a.u. (triply degenerate)
Symmetry: t2
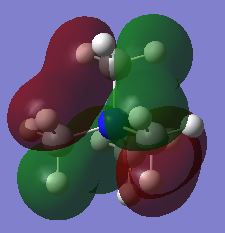
Real MO
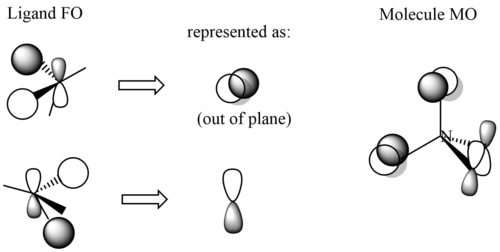
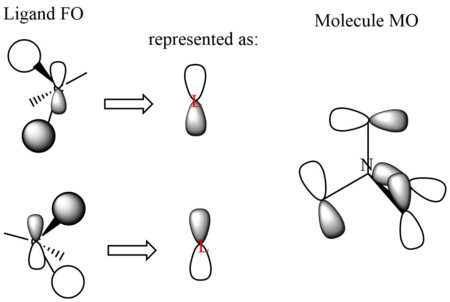
LCAO representation:
MO18 (occupied)
Energy: -0.58038 a.u. (triply degenerate)
Symmetry: t1
Real MO:
LCAO representation:
MO14 (occupied)
Energy: -0.62250 a.u. (doubly degenerate)
Symmetry: e
Real MO:
LCAO representation:
MO 14 has the lowest energy among all three of the MOs chosen, therefore it has the greatest bonding character as expected.
Ng611 (talk) 21:09, 5 June 2019 (BST) Excellent LCAO analysis! Well done!
References
- ↑ P. Hunt, Hunt Research Group Teaching, (accessed May 2019).
- ↑ 2.0 2.1 Wired Chemist, http://www.wiredchemist.com/chemistry/data/bond_energies_lengths.html, (accessed May 2019).
- ↑ 3.0 3.1 3.2 3.3 Science Notes, https://sciencenotes.org/list-of-electronegativity-values-of-the-elements/, (accessed May 2019).

