Rep:MOD:JRodwellYR1
NH3 Molecule
Optimization Data
The NH3 molecule was optimized using Gaussian and a calculation method of RB3LYP and a basis set of 6-31G(d,p). The energy of the final molecule is calculated at -56.55776873 a.u. and an RMS gradient of 0.00000485 a.u. with a point group of Cv3. The bond angle formed between the H-N-H atoms is 105.7o. The Output file for the optimization of NH3 is shown below:
Item               Value     Threshold  Converged?
 Maximum Force            0.000004     0.000450     YES
 RMS     Force            0.000004     0.000300     YES
 Maximum Displacement     0.000072     0.001800     YES
 RMS     Displacement     0.000035     0.001200     YES
Optimized NH3 |

Vibrational Data
There are 6 theoretically determined vibrational modes, however as can be seen by the table above, there are 2 sets of degenerate modes, those at 1693.95cm-1 and at 3589.82cm-1. Vibrational modes can be categorized into bending and stretching motions in relation to the bond, those with frequencies at 1089.54cm-1 and 1693.95cm-1 are considered bending modes whilst those at 3461.29cm-1 and 3589.82cm-1 are stretching movements. The most highly symmetric mode is that at 3461.29cm-1, the mode at 1089.54cm-1 resembles the movement involved in opening an umbrella and closing it again if each hydrogen represented the outer edge of the canvas and the nitrogen atom the central pole. In the experimental Infrared spectrum of gaseous ammonia it would be expected to see 4 bands of absorption due to there being 4 different absorption frequencies.
Relative Charge within molecule
Ammonia gas is expected to have a delta negative charge on the nitrogen due its higher electronegativity, drawing electrons density away from the hydrogen atoms giving each of them a slight positive charge. This is shown in the calculated figures as nitrogen is shown to have a charge of -1.125 and each of the hydrogen's, 0.375.
N2 Molecule
Optimization Data
The N2 molecule was optimized using Gaussian and a calculation method of RB3LYP and a basis set of 6-31G(d,p). The energy of the final molecule is calculated at -109.52412868 a.u. and an RMS gradient of 0.00000060 a.u. with a point group of Dinf h. The bond angle formed between the N-N atoms is 0o.
         Item               Value     Threshold  Converged?
 Maximum Force            0.000001     0.000450     YES
 RMS     Force            0.000001     0.000300     YES
 Maximum Displacement     0.000000     0.001800     YES
 RMS     Displacement     0.000000     0.001200     YES
Optimized N2 |
Media:JRODWELL_N2_OPTIMIZATION.LOG
Vibrational Data
There is 1 vibrational mode ,due to the molecule being dihomonuclear at 2457.33cm-1.
H2 Molecule
Optimization Data
The H2 molecule was optimized using Gaussian and a calculation method of RB3LYP and a basis set of 6-31G(d,p). The energy of the final molecule is calculated at -1.17853936 a.u. and an RMS gradient of 0.00000017 a.u. with a point group of Dinf h. The bond angle formed between the H-H atoms is 0o.
      Item               Value     Threshold  Converged?
 Maximum Force            0.000000     0.000450     YES
 RMS     Force            0.000000     0.000300     YES
 Maximum Displacement     0.000000     0.001800     YES
 RMS     Displacement     0.000001     0.001200     YES
Optimized H2 |
Media:JRODWELL_H2_OPTIMIZATION.LOG
Vibrational Data
There is 1 vibrational mode ,due to the molecule being dihomonuclear at 4465.68cm-1.
Haber-Bosch Process
Calculations
E(NH3)= -56.55776873 a.u.
2*E(NH3)= -113.11553746 a.u.
E(N2)= -109.52412868 a.u.
E(H2)= -1.17853936 a.u.
3*E(H2)= -3.53561808 a.u.
ΔE=2*E(NH3)-[E(N2)+3*E(H2)]= -0.0557907 a.u. (-146.47848285kJmol-1)
It can be seen from the above calculations that the gaseous ammonia product is more stable than hydrogen and nitrogen gases as there is a net gain in energy for the reaction, as it is exothermic, meaning energy is released by the reaction.
H2SiO Molecule
Optimization Data
The H2SiO molecule was optimized using Gaussian and a calculation method of RB3LYP and a basis set of 6-31G(d,p). The energy of the final molecule is calculated at -365.90001403 a.u. and an RMS gradient of 0.00000941 a.u. with a point group of CS. The bond angle formed between the H-Si=O atoms is 124.2o, between the H-Si-H is 111.7o. The bond length of the Si=O bond is 1.53 Angstroms and Si-H bond is 1.49 Angstroms
 Item               Value     Threshold  Converged?
 Maximum Force            0.000023     0.000450     YES
 RMS     Force            0.000009     0.000300     YES
 Maximum Displacement     0.000023     0.001800     YES
 RMS     Displacement     0.000017     0.001200     YES
Optimized H2SiO |
Media:JRODWELL_H2SIO_OPTIMIZATION.LOG
Vibrational Data

There are 6 theoretically determined vibrational modes. Vibrational modes can be categorized into bending and stretching motions in relation to each of the bonds, those with frequencies at 698.63cm-1, 712.10cm-1 and 1037.98cm-1 are considered purely bending modes of the Si-H bonds. Whilst those at 2230.72cm-1 and 2247.73cm-1 are stretching movements of the Si-H bonds. The absorption at 1219.72cm-1 shows a bending motion of the Si-H bonds and a stretching of the Si=O bond, this can be compared to the literature value obtained of 1202cm-1[1], which shows a very close match to the calculated value of the peak. In the experimental Infrared spectrum of the molecule it would be expected to see 6 bands of absorption due to there being 6 different absorption frequencies.
Relative Charge within Molecule

The relative charge distribution in the molecule is expected to follow the pattern of electronegativity with the most negative charge occurring on the most electronegative atoms. This is the case for the oxygen tom having a -1 charge as it is drawing electrons from the bond with the Silicon, however the negative charge on the Hydrogens is unexpected and this lies in the fact that the valence electrons for the Silicon atom are at such a distance from the nuclei and thus are shielded from the electrostatic attraction to the nucleus and thus the hydrogens are able to pull a slight amount of electron density away from the bond where they are not usually able to with the likes of carbon.
Atomic and Molecular Orbitals

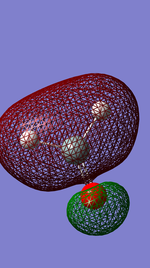
The 2s orbital for the Silicon atom in H2SiO is shown left and is spherical in nature as expected with the charge density exclusively occuring around the Si atom, this is due to the orbital being so low in energy that it is unable to contribute to the bonding. The orbital is only comprised of electrons from the Silicon atom and the electrons are held tightly bound to the atom due to the high effective nuclear charge seen by each one.

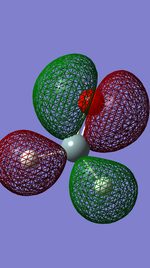
Increasing in energy from the last molecular orbital shown, right shows the pi bonding system between the Silicon and Oxygen atoms from the overlapping of the only 3p of the Silicon, due to its trigonal planar sp2 hybridised state, and the 2s of the Oxygen, giving charge density from the bond above and below the bond. The pi orbitals that are overlapping are perpendicular to the Silicon hydrogen bonds and this is due to the repulsions between the pairs of electrons thus giving the lowest energy conformer.

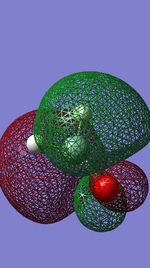
Molecular orbitals are usually just considered especially in simple molecules to be either anti bonding or bonding in nature and in fact this is not the case all the time. The diagram left shows the in phase bonding between the Silicon and hydrogens but an out of phase character between the Silicon oxygen bond. This readily occurs in complex molecules as the orbitals become larger and there is a greater tendency for atoms which are bonding to many other atoms to have a wave function of an electron in phase with one group whilst out of phase with another thus producing this mixed bonding and anti bonding molecular orbital.

The image right shows the highest occupied molecular orbital, which is the highest energy molecular orbital which contains a pair of electrons. In this case for H2SiO this shows a d-orbital of the Silicon atom showing some in phase overlap with the adjacent p orbital of the oxygen atom and those of the 1s hydrogens orbitals.

The Lowest unoccupied molecular orbital is the molecular orbital which is the lowest in energy (closest to the nucleus) which does not contain any electrons. The orbital in question is a pi star anti bonding orbitals produced from the out of phase overlapping between the p orbital of the Silicon atom and the oxygen atom, this is thus why there is non electron density between the atoms where the bond is.
References
- ↑ Withnall, R.; Andrews, L., Infrared spectroscopic evidence for silicon-oxygen double bonds: silanone and the silanoic and silicic acid molecules, J. Am. Chem. Soc., 1985, 107, 8, 2567.
