Rep:MOD:Ard16MO lab
Molecular Orbital Lab- Arun Dolan
General MO Calculations
BH3
B3LYP/6-31G level(d.p.)
Optimised BH3 Molecule |
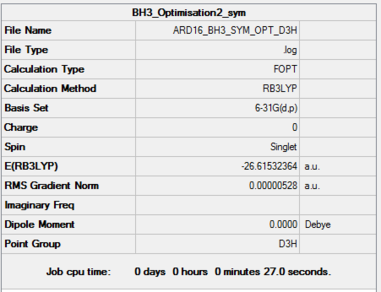
Item               Value     Threshold  Converged?
 Maximum Force            0.000011     0.000450     YES
 RMS     Force            0.000007     0.000300     YES
 Maximum Displacement     0.000042     0.001800     YES
 RMS     Displacement     0.000027     0.001200     YES
Click here for the frequency file
Low frequencies ---   -7.5936   -1.5614   -0.0055    0.6514    6.9319    7.1055
 Low frequencies --- 1162.9677 1213.1634 1213.1661
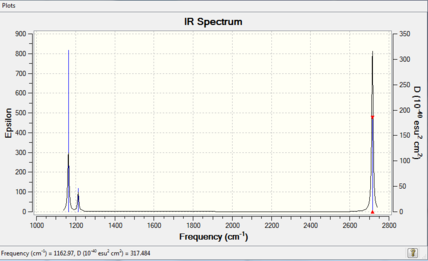
Frequency Table
| Mode | Vibrational Frequency/cm-1 | Intensity/au | IR active? | Type | Symmetry |
|---|---|---|---|---|---|
| 1 | 1163 | 93 | YES | Out-of-plane bend | A2" |
| 2 | 1213 | 14 | slight | bend | E' |
| 3 | 1213 | 14 | slight | bend | E' |
| 4 | 2582 | 0 | NO | Symmetric Stretch | A1' |
| 5 | 2716 | 126 | YES | Assymetric Strech | E' |
| 6 | 2716 | 126 | YES | Assymetric Strech | E' |
There a six vibrations however only three in the above spectra. The reason for this is that two of the vibrations, the assymetric stretches and the bends, are degenerate and so are only seen once. The remaining missing 'vibration' is the symmetric stretch. This vibration is not IR active as the molecule's dipole does not change upon vibration.
IR Spectrum
MO Discussion
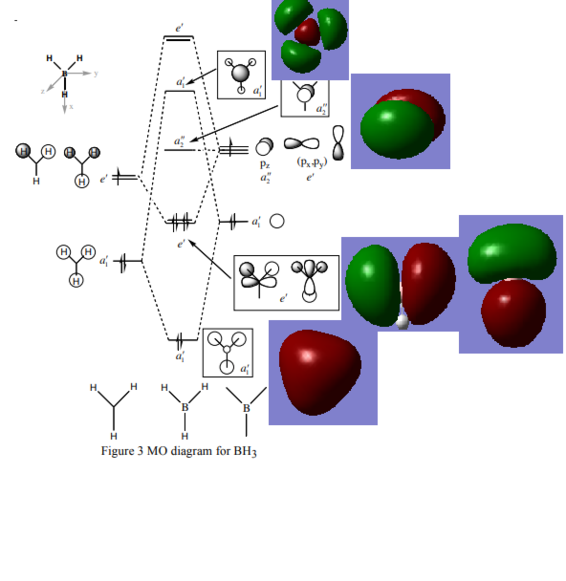
Diagram taken from Hunt Research Group website[1]
Ng611 (talk) 13:24, 22 May 2018 (BST) Where are the orbitals for e'?
The MOs from the LCAO approximation and the real computed MOs resemble each other but are not identical. One of the major differences is that electron density is centered around the atoms in a LCAO approach, for example MO a1'. However the real MO presents a smear of electron density which is not restricted to the atoms . The e' MOs are another example of this, rather than representing p and s orbitals as in the LCAO the electron density in reality is spread over the atoms in a more fluid manner. Furthermore the a1' lUMO MO looks markedly different from the filled MOs, suggesting anti-bonding orbitals may differ from the LCAO approximation more than MOs. The co-efficents of the hydrogens are much larger than in the LCAO picture, bringing more electron density away from the center of the molecule and bonding areas.
The differences show that the LCAO is a good approximation for the bonding orbitals. The localisation of electron density around atoms in the LCAO approximation does limit its accuracy for visualising MOs, however for easily predicting the different MOs, and possible inetracting MOs between molecules LCAO is suitable. However as above the LUMO the LCAO approximation becomes less accurate as anti-bonding orbitals deviate more strongly from the LCAO picture, it becomes an unsuitable mechanism for visualising MOs. However as most reactions between molecules are concerned with the LUMO and bonding orbitals the usefullness of the LCAO approximation is not too badly affected.
Ng611 (talk) 13:26, 22 May 2018 (BST) Good answer, although I'd disagree with the strength of your conclusions. You're right to say that the shape and the relative contribution of different orbitals may not be captured accurately in qualitative MO theory, but overall these differences are subtle overall, qualitative MO theory is still pretty powerful.
Ammonia Borane Reaction
NH3
Method: RB3LYP Basis Set: 6-31G(d,p)
Optimised BH3 Molecule |

         Item               Value     Threshold  Converged?
 Maximum Force            0.000006     0.000450     YES
 RMS     Force            0.000004     0.000300     YES
 Maximum Displacement     0.000016     0.001800     YES
 RMS     Displacement     0.000011     0.001200     YES
Click here for the frequency file
Low frequencies ---   -8.5646   -8.5588   -0.0044    0.0454    0.1784   26.4183
 Low frequencies --- 1089.7603 1694.1865 1694.1865
Ammonia Borane
Optimised BH3 Molecule |
Method: RB3LYP Basis Set: 6-31G(d,p)
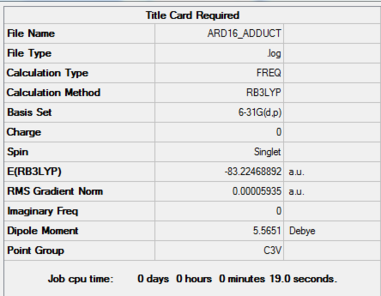
         Item               Value     Threshold  Converged?
 Maximum Force            0.000121     0.000450     YES
 RMS     Force            0.000057     0.000300     YES
 Maximum Displacement     0.000570     0.001800     YES
 RMS     Displacement     0.000318     0.001200     YES
Click here for the frequency file
Low frequencies ---   -0.0576   -0.0501   -0.0074   21.6263   21.6362   40.3340
 Low frequencies ---  265.9844  632.3694  640.1233
Reaction
For the reaction NH3 + BH3 => NH3BH3
Energies in Hartree unless stated
E(NH3)=-56.55777
E(BH3)=-26.61533
E(NH3BH3)=-83.22469
ΔE=E(NH3BH3)-[E(NH3)+E(BH3)]
ΔE=-0.051594
ΔE=135Kj/mol This result compares relatively well with computational literature suggesting the B-N bond in ammonia borane is 184Kj/mol[2].
An N-B dative covalent bond strength of 135kJ/mol can be compared to the B-B bond strength is 293 Kj/mol, and the N-N is 167 Kj/mol single bond strengths for context. The N-N single bond strength is known to be weak due to repulsive lone pair interactions. The N-B bond is of similar strength so can also be deemed weak, especially given that it is substantially weaker than the B-B bond strength.
Ng611 (talk) 13:29, 22 May 2018 (BST) Well done for citing the literature B-N bond value. What about citations for the B-B and N-N strengths?
BBr3
Optimised BH3 Molecule |
Method, basis set; B3LYP/6-31G(d,p)LANL2DZ
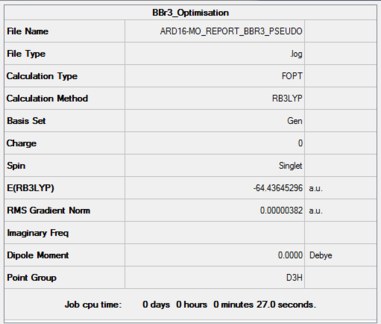
Item               Value     Threshold  Converged?
 Maximum Force            0.000008     0.000450     YES
 RMS     Force            0.000005     0.000300     YES
 Maximum Displacement     0.000036     0.001800     YES
 RMS     Displacement     0.000023     0.001200     YES
Click Here for a link to the frequency log file.
 Low frequencies ---   -2.3428   -0.0035   -0.0018    0.0762    0.6278    0.6278
 Low frequencies ---  155.9407  155.9410  267.6924
D-space link: The frequency analysis would not run on the server. Neither myself nor the demonstrators could work out why. I therefore ran the calculation on my local machine, and so there frequency calculation has not been published. I there include a link instead to the published optimisation file. DOI:10042/202405
Project Section
Main Group Halides
Isomers of Al2Br2Cl4
| Isomer label | Structure | Symmetry |
|---|---|---|
| a |  |
C2V |
| b |  |
C2h |
| c |  |
C2V |
| d |  |
C1 |
| e |  |
D2h |
Ng611 (talk) 13:34, 22 May 2018 (BST) You got all of these right, well done. Your isomer b, while correct, was a bit confusing though.
Energies of Isomers
Isomer e (bridging BRs)
Optimised BH3 Molecule |
Method, Basis set: B3LYP/6-31G(d,p)LANL2DZ
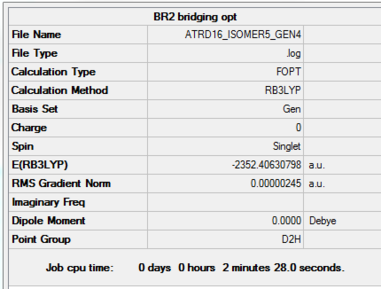
Item               Value     Threshold  Converged?
 Maximum Force            0.000006     0.000450     YES
 RMS     Force            0.000002     0.000300     YES
 Maximum Displacement     0.000065     0.001800     YES
 RMS     Displacement     0.000028     0.001200     YES
Click Here for a link to the frequency log file.
Low frequencies ---   -5.1161   -4.9835   -3.1302   -0.0027    0.0013    0.0020
 Low frequencies ---   14.8567   63.2780   86.0772
Isomer b (Trans terminal Br)
Optimised BH3 Molecule |
Method, Basis set: B3LYP/6-31G(d,p)LANL2DZ
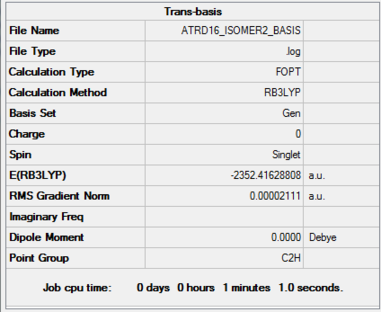
     Item               Value     Threshold  Converged?
 Maximum Force            0.000056     0.000450     YES
 RMS     Force            0.000023     0.000300     YES
 Maximum Displacement     0.001323     0.001800     YES
 RMS     Displacement     0.000435     0.001200     YES
Click Here for a link to the frequency log file.
  Low frequencies ---   -3.7684   -2.2995   -0.0041   -0.0030   -0.0024    0.8521
 Low frequencies ---   17.7338   49.0103   72.9394
Discussion
Out of Isomer E and isomer B, Isomer B with the trans terminal bromine is more stable by 0.00998 hartree or 26Kj/mol. The extra stability can be explained by examining the bonds in each structure. In each case the bridging atom forms a dative covalent bond to an alumnium atom explaining the odd halogen valency. Therefore the two structures both have four Al-Cl bonds, two Al-Br bonds and then two extra dative Br-Al bonds when the bromines are bridging compared to two extra Cl-Al bonds when the chlorines are bridging. The literature bond strengths are 502Kj/mol for Al-Cl and 429Kj/mol for Al-Br[3]. The Al-Cl bond is therefore stronger, explaining the relative stability when the chlorine atoms are bridging.
The increased strength of the Al-Cl bond when compared to the Al-Br bond can be rationalised given that Al and Cl are both in the third row of the periodic table, but Br is in row four. Therefore bromine's orbitals are likely to be more diffuse when compared to aluminium's. The overlap is therefore less good when compared to chlorine's more contracted orbitals. The interaction between Al and Cl are between 3p and 3p compared to 4p and 3p for Al and Br. A lower overlap integral leads to a lower interaction energy.
Dissociation
AlCl2Br
Optimised BH3 Molecule |
method:RB3YP, Basis Set:PP LANL2DZ
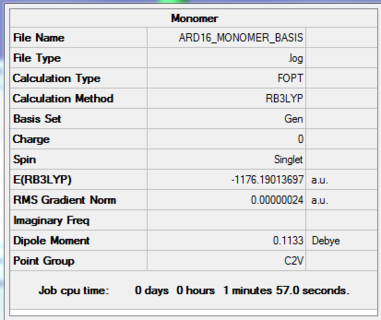
    Item               Value     Threshold  Converged?
 Maximum Force            0.000001     0.000450     YES
 RMS     Force            0.000000     0.000300     YES
 Maximum Displacement     0.000004     0.001800     YES
 RMS     Displacement     0.000002     0.001200     YES
Click Here for a link to the frequency log file.
  Low frequencies ---   -2.4227   -0.0030   -0.0024   -0.0022    2.8334    2.9165
 Low frequencies ---  120.5196  133.8366  185.7806
Energy Discussion
The energy for two isolated monomers is -2352.38027 Hartree, compared to 2352.406308 Hartree for isomer B. The isolated monomers are therefore less stable than the dimer. The energy difference is 0.03601 Hartree or 95kj/mol, and this energy difference would be the dissociation energy. A dissociation energy of +95kj/mol reflects the fact that there are two extra covalent bonds in the dimer which must be broken for it to dissociate.
However the energy difference is much weaker than the strength of two Al-Cl bonds. This is because the monomer displays unusual stability. The extra stability of the monomer comes from the empty Al p orbital having the right orientation to interaction with lone pairs on the surrounding halogen atoms on the same molecule. The right orientation comes from the fact the molecule is planar. Electron density from the halogens feeds into the empty p orbital relieving the Alumnium electron deficiency. However this interaction is not as strong as a covalent bond, rendering the formation of the dimer more favourable.
Molecular Orbitals
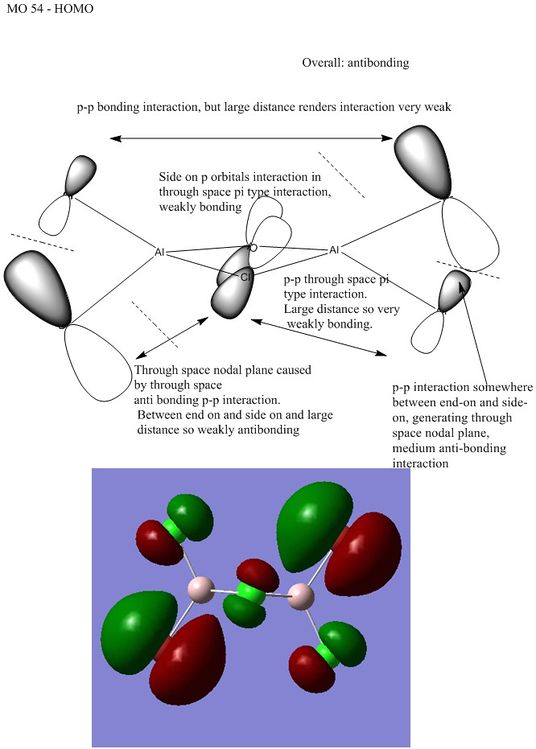
The MOs from the trans terminal Br isomer, Isomer b were visualised and drawn. The dominant interactions across the MOs were p orbital interaction, occuring by far the most. P orbital interacytions are less strong than s interactions, but stronger than d orbital interactions. p orbital interactions are stronger when end-on as oppose to side-on as end-on generates greater overlap, as these interactions are more directed, making it a sigma like interactions as oppose to a pi type.
1
This bonding MO comes from p orbitals on all atoms.
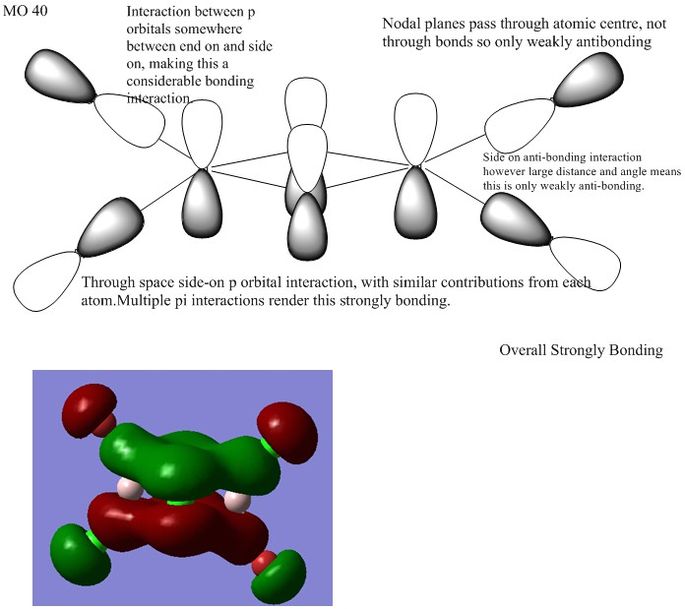
Ng611 (talk) 13:40, 22 May 2018 (BST) Good LCAO decomposition. Remember to label your interactions with arrows so it's clear the orbitals you're referring to in your annotations.
2
3
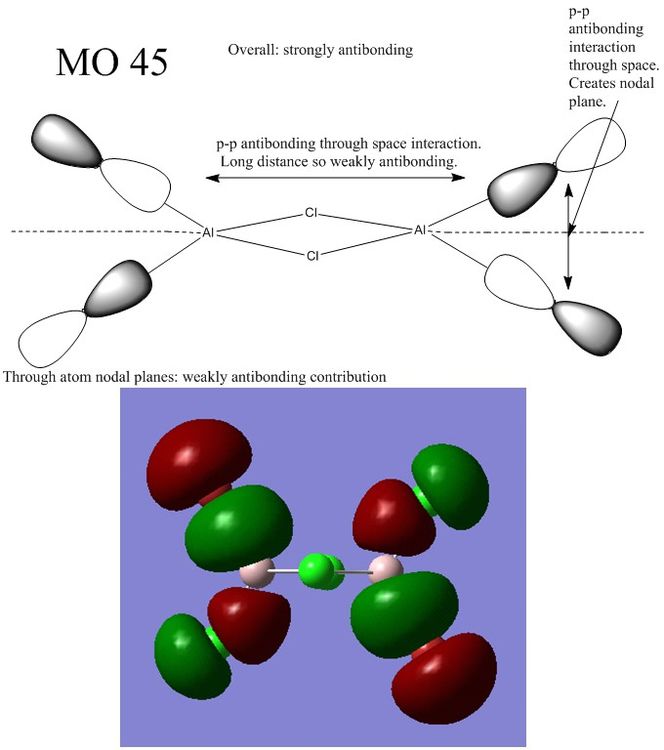
Ng611 (talk) 13:40, 22 May 2018 (BST) as the antibonding interactions are pretty much exclusively 'through space', I would say that this is a weakly antibonding MO.
Ng611 (talk) 13:44, 22 May 2018 (BST) A very good report, well done. Take care with your MO analysis and remember that the strength of antibonding interactions counts just as much as the total number of antibonding interactions. Remember also to cite any figures you take from the literature. Even if you've obtained them from a source you've cited previously, you must still cite them. Besides this however, the report was exemplary - well done.
