Rep:MOD:01381641
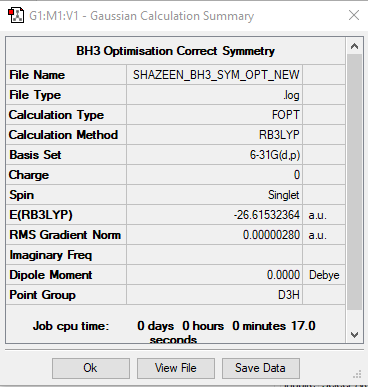
BH3
Method: B3LYP
Basis Set: 6-31G(d,p)
         Item               Value     Threshold  Converged?
 Maximum Force            0.000009     0.000450     YES
 RMS     Force            0.000004     0.000300     YES
 Maximum Displacement     0.000034     0.001800     YES
 RMS     Displacement     0.000017     0.001200     YES
Low frequencies ---   -2.2126   -1.0751   -0.0054    2.2359   10.2633   10.3194
Low frequencies --- 1162.9860 1213.1757 1213.1784
optimised BH3 molecule |
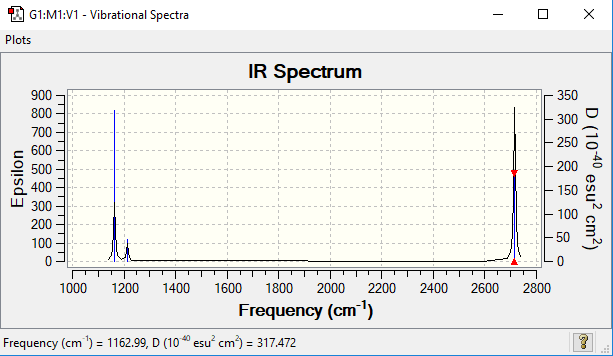
Vibrational spectrum for BH3
| wavenumber (cm-1) | Intensity (arbitrary units) | symmetry | IR active? | type |
| 1163 | 93 | A2 | Yes | out-of-plane bend |
| 1213 | 14 | E' | Very slight | bend |
| 1213 | 14 | E' | Very slight | bend |
| 2582 | 0 | A1' | No | symmetric stretch |
| 2715 | 126 | E' | Yes | asymmetric stretch |
| 2715 | 126 | E' | Yes | asymmetric stretch |
Only 3 peaks are see in the spectrum despite there being 6 vibrations as shown in the vibrational data above. There are two sets of degenerate vibrations (same energy), 1213 and 2715 cm-1 which only appear once in the spectrum. Additionally, for a vibration to be IR active, there must be a change in dipole moment. The vibration at 2592 cm-1 represents an symmetric stretch which means the change in dipole moment is zero so this is not observed in the IR spectrum.

No significant differences are seen between the real and LCAO MOs which shows that qualitative MO theory is useful in predicting real MOs to a high level of accuracy. The real MOs show regions of electron density and nodes in areas predicted by LCAO MOs. One limitation of LCAOs is that it does not show the extent of overlap of the atomic orbitals. This is seen in the real MOs.
Ng611 (talk) 12:34, 7 June 2019 (BST) Are there any other differences you can pick out?
NH3
Method: B3LYP
Basis Set: 6-31G(d,p)
       Item               Value     Threshold  Converged?
 Maximum Force            0.000005     0.000450     YES
 RMS     Force            0.000003     0.000300     YES
 Maximum Displacement     0.000013     0.001800     YES
 RMS     Displacement     0.000007     0.001200     YES
Low frequencies ---  -11.1928  -11.1561   -0.0035    0.0252    0.1457   25.7625
Low frequencies --- 1089.6648 1694.1744 1694.1747
optimised NH3 molecule |
NH3BH3
Method: B3LYP
Basis Set: 6-31G(d,p)
         Item               Value     Threshold  Converged?
 Maximum Force            0.000233     0.000450     YES
 RMS     Force            0.000083     0.000300     YES
 Maximum Displacement     0.000981     0.001800     YES
 RMS     Displacement     0.000370     0.001200     YES
Low frequencies ---   -0.0675   -0.0573   -0.0065   16.7107   16.7164   41.6318
Low frequencies ---  265.4937  634.5843  640.0012
optimised NH3BH3 molecule |
Calculating Association Energy
E(NH3)= -56.55776863 a.u.
E(BH3)= -26.61532364 a.u.
E(NH3BH3)= -83.22468856 a.u.
ΔE=E(NH3BH3)-[E(NH3)+E(BH3)]
ΔE=(-83.22468856)-[(-56.55776863)+(-26.61532364)]
ΔE = -0.05159629 a.u.
ΔE= -135 kJ/mol
Ng611 (talk) 12:36, 7 June 2019 (BST)Good calculation!
This value shows that the B-N dative bond is weak (bond enthalpy = +135 kJ/mol) compared to other bond enthalpy values. [2] For example, the bond enthalpy of a C-C bond is approximately 350 kJ/mol. This is more than twice the calculated B-N dative bond.
Ng611 (talk) 12:36, 7 June 2019 (BST) Use a source from a text or databook, rather than a website.
NI3
Method: B3LYP
Basis Set: 6-31G(d,p) for N, LanL2DZ for I
         Item               Value     Threshold  Converged?
 Maximum Force            0.000067     0.000450     YES
 RMS     Force            0.000044     0.000300     YES
 Maximum Displacement     0.000486     0.001800     YES
 RMS     Displacement     0.000363     0.001200     YES
File:NI3 OPTIMISATION+FREQ NEW0138.LOG
Low frequencies ---  -12.7375  -12.7314   -6.2898   -0.0040    0.0188    0.0633
Low frequencies ---  101.0325  101.0332  147.4122
optimised NI3 molecule |
Ng611 (talk) 12:36, 7 June 2019 (BST) Where's your N-I bond length?
Investigating Metal Carbonyl Complexes
Prediction
Bond Length:
Going across the 3d complexes from Ti to Fe, the M-C bond length is expected to increase (weaker M-C bond). The C≡O bond length is expected to decrease (i.e. stronger C≡O bond) and therefore the C≡O stretching frequency should increase. As you go from Ti-->Fe, the decreasing negative charge on the metal centre leads to contraction of the d orbitals and hence a less efficient overlap of M(dπ) with CO π*. This would result in a weaker M-C bond. All the complexes are d6 however the decreasing negative charge means the extent of back-bonding decreases which, again, will decrease the bond strength and increase bond length.
C≡O Stretching Frequency:
The C≡O stretching frequency is expected to decrease. As stated above, the M-C bond strength increases which means the C≡O bond will weaken. This will result in a decrease in the stretching frequency of the C≡O bond.
Ng611 (talk) 12:44, 7 June 2019 (BST) Good predictions. A more detailed explanation would have improved this further.
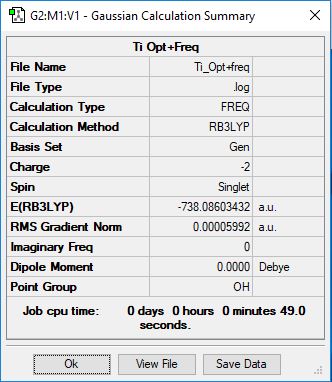
[Ti(CO)6]2-
Method: RB3LYP
Basis Set: 6-31g(d,p) for C and O, LanL2DZ for Ti
         Item               Value     Threshold  Converged?
 Maximum Force            0.000118     0.000450     YES
 RMS     Force            0.000042     0.000300     YES
 Maximum Displacement     0.000244     0.001800     YES
 RMS     Displacement     0.000096     0.001200     YES
 Low frequencies ---   -0.0003    0.0007    0.0008   14.2245   14.2245   14.2245
 Low frequencies ---   30.7497   30.7497   30.7497
optimised [Ti(CO)6]^1- molecule |
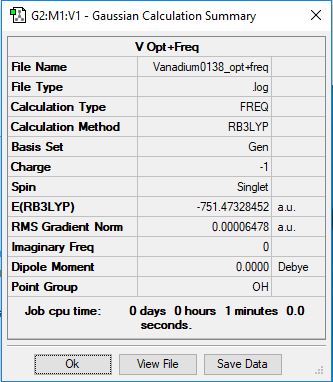
[V(CO)6]-
Method: RB3LYP
Basis Set: 6-31g(d,p) for C and O, LanL2DZ for V
         Item               Value     Threshold  Converged?
 Maximum Force            0.000198     0.000450     YES
 RMS     Force            0.000070     0.000300     YES
 Maximum Displacement     0.001210     0.001800     YES
 RMS     Displacement     0.000591     0.001200     YES
 Low frequencies ---    0.0006    0.0007    0.0010   14.1311   14.1311   14.1311
 Low frequencies ---   52.8916   52.8916   52.8916
File:VANADIUM0138 OPT+FREQ.LOG
optimised [V(CO)6]^1- molecule |
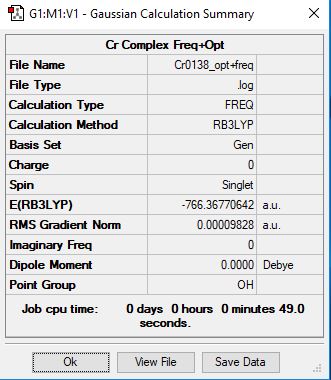
[Cr(CO)6]
Method: RB3LYP
Basis Set: 6-31g(d,p) for C and O, LanL2DZ for Cr
         Item               Value     Threshold  Converged?
 Maximum Force            0.000160     0.000450     YES
 RMS     Force            0.000057     0.000300     YES
 Maximum Displacement     0.000225     0.001800     YES
 RMS     Displacement     0.000084     0.001200     YES
Low frequencies ---   -0.0014   -0.0008   -0.0007   10.8502   10.8502   10.8502
Low frequencies ---   66.4359   66.4359   66.4359
optimised [Cr(CO)6] molecule |
Comparing Complexes
Calculations Data
| M Complex | M-C Bond Length (Å) | Charge on M | C=O Stretching Frequency | C=O Bond Length (Å) |
| Titanium | 2.047 | 2- | 1855 | 1.183 |
| Vanadium | 1.954 | 1- | 1969 | 1.166 |
| Chromium | 1.915 | 0 | 2087 | 1.149 |
| Manganese | 1.908 | 1+ | 2198 | 1.136 |
| Iron | 1.942 | 2+ | 2297 | 1.125 |
Mn and Fe Data taken from [3] (Sharmin Akbar)
Comparing M-C Bond length
As you go from left to right, the M-C bond length decreases until Mn and then there is an increase from Mn to Fe. The observation from Ti-->Fe contradicts the initial prediction. However, the trend observed in the C=O bond lengths was as predicted before calculations. There was a decrease in the C=O bond length (suggesting a stronger C=O bond) and increasing stretching frequency.
The trend observed from Ti-->Mn contradicts theory, making explanations difficult. The strength of an interaction is dependant on the difference in FO energies, Sij (overlap integral) and Hij. A small difference in energy and a good overlap results in a strong interaction. My prediction was based on the increasing positive charge on the metal centre making d-orbitals less diffuse which would result in a weaker interaction (and longer M-C bond). There may be limitations to the basis set used for the calculations which may have provided the wrong bond length values. The bond length values can be confirmed using crystallography/X-ray diffraction
An increase in bond length from Mn to Fe was unusual as it didn't follow the observed trend (but did agree with the prediction) Upon speaking to Prof. Hunt, the explanation for this was linked to correlation and exchange theory which she said was too advanced for this course. However, briefly, an Fe 2+ charge causes contraction of the d orbitals and hence greater repulsion between the electrons (all spin paired) so there is less efficient overlap with the CO and a longer bond length.
Comparing C=O stretching frequencies
The table shows a decrease in the C≡O stretching frequency. This shows that the bond strength decreases, as predicted earlier.
The totally symmetric C=O vibrations for these complexes cannot be analysed as they are not IR active (zero intensity). This is because there is no change in dipole moment. For each of the complexes, these are listed below.
| M Complex | Symmetric C=O Stretching Frequency |
| Titanium | 1990 |
| Vanadium | 2095 |
| Chromium | 2189 |
| Manganese | 2265 |
| Iron | 2322 |
Ng611 (talk) 12:46, 7 June 2019 (BST) Good analysis!
LCAOs vs real MOs for [Cr(CO)6]
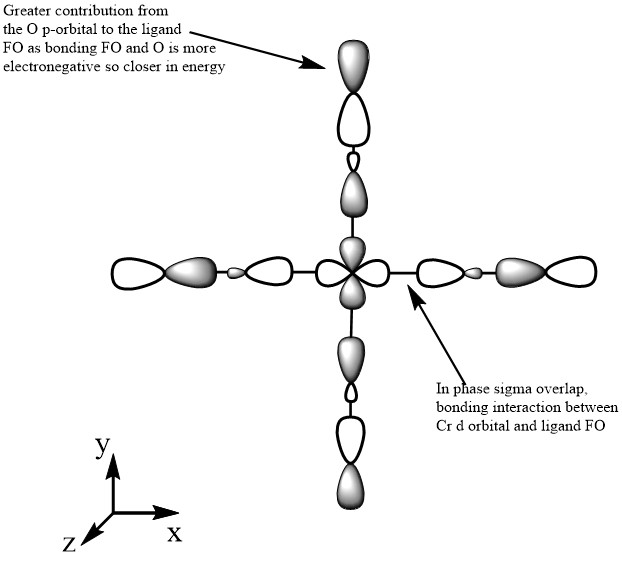
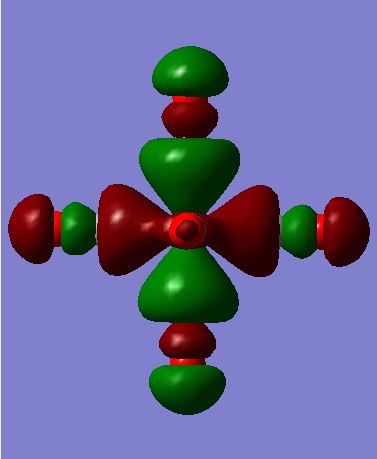
MO 42
The images above show MO 42 for [Cr(CO)6]. This is a filled bonding orbital orbital with mainly in-phase interactions. There are no contributions from the ligands along the z-axis. The C from CO is sp3 hybridised. It has a smaller contribution to the ligand FO as it electropositive and higher in energy. There are in-phase interactions between the the C-O valence orbitals as well as between the C sp3 and Cr dx2-y2. End-on overlap results in σ interaction.
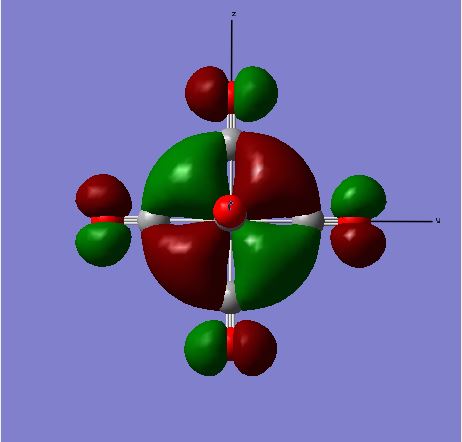
MO 49
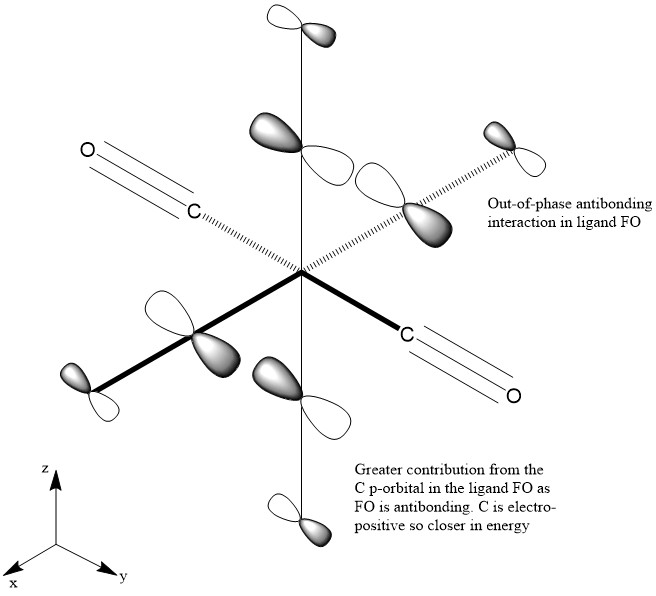
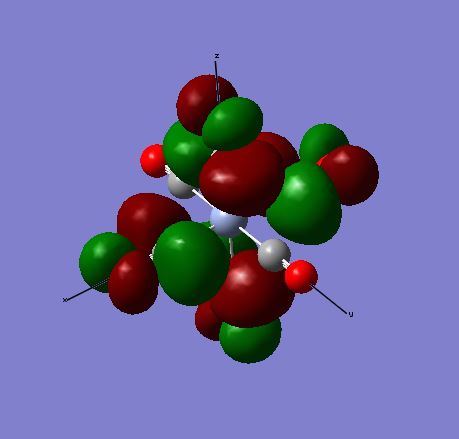
The images above show the HOMO for the [Cr(CO)6] complex. This is a filled bonding orbital with a t2g symmetry. There are out-of phase interactions within the ligand FO and in-phase bonding interactions between the Cr dyz and C pz orbital. There are no contributions from the ligands along the x axis. There is greater contribution from the C in the ligand FO as it is closer in energy compared to O. There is also greater contribution from the Cr in the MO compared to the ligand FO as it is closer in energy. The ligand orbital is the C-O π* orbital which is higher in energy compered to the dyz orbital. There are also bonding in-phase interactions through space of the C p orbitals which results in greater stabilisation of the MO energy.
MO 54
MO 54 represents a non-bonding orbital with a t2u symmetry. It has no contribution from the Cr orbital which shows that it is non-bonding. There are out-of phase interactions between the C and O p orbitals which suggests this MO is high in energy. The ligand FO is an anti-bonding FO. O is more electronegative than C so its valence p orbitals are low in energy. Hence it has a smaller contribution to the ligand FO which is antibonding.
Ng611 (talk) 12:49, 7 June 2019 (BST) Good selection of orbitals and they all appear correct, well done. Labelling some of the key interactions on the diagrams themselves, rather than in a paragraph below, would be helpful.

