Rep:MGO:ytl115
Introduction
Statistical mechanics is a powerful method used to explain the thermodynamic behaviour of large systems. In statistical mechanics, it is assumed that the thermodynamic properties of a system (e.g. heat capacity, entropy) can be calculated from the statistical averages of its microstates. For simple molecules such as the diatomic harmonic oscillator, these thermodynamic properties can be calculated on an atomic basis. For larger systems such as materials with an infinite periodic lattice, however, other models must be explored in order to obtain the desired thermodynamic properties.[1]
In this experiment, several properties of a MgO crystal were calculated using two different models - the Quasi-Harmonic Approximation (QHA) and Molecular Dynamics (MD). The system was first analysed at 0 K using the Buckingham potential and its vibrational properties were examined. Next, using the quasi-harmonic approximation, the free energy of the system was optimised at different temperatures and its thermal expansion was examined for a temperature range of 0 to 2800 K. This expansion examination was then repeated using molecular dynamics for comparison. The aim of the experiment was to obtain the thermal expansion coefficient of MgO using the two different models and study its variation with temperature.
Structure of MgO
Magnesium oxide, MgO, is an ionic compound that adopts the crystal structure of rock salt (NaCl). The crystal structure of the lattice can be described as a face-centered cubic lattice of Mg2+ ions with O2- ions occupying all of the octahedral holes in the lattice. It can be described using only one lattice parameter, as in a cubic system, all of the angles between the lattice parameters are equal to 90° and a = b = c, where a, b, and c are the lattice parameters of the lattice in 3 dimensions. The unit cell for this type of lattice is referred to as the conventional cell, and contains 4 Mg and 4 O atoms per unit cell.
 |
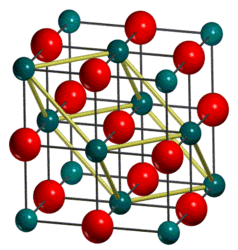 |
The structure of MgO can also be represented using a primitive cell. The primitive cell contains one Mg and one O atom. The structure of the primitive cell is a rhombohedron, with lattice parameters a=b=c and = 60°. By considering the number of atoms per unit cell, it can be determined that the volume of the conventional cell is 4 times that of the primitive cell. This cell is used for calculations using lattice dynamics.
Another model considered in this experiment is the supercell. In the MgO supercell used, the cell parameters are twice that of the conventional cell, asupercell = 2aconventional. This results in there being 32 Mg and 32 O atoms per unit cell. This type of cell is used for molecular dynamics as in molecular dynamics, the random motion of the atoms in the cell are sampled and thus a larger cell size is required for the convergence of internal energy of the system and obtain a more accurate result.
Experimental Methods
For simulations, the General Utility Lattice Program (GULP, v 1.4.43) was used on Red Hat Enterprise Linux in VMWare. An ideal, defect-free fcc MgO lattice ( = 90°) was used for the calculations and simulations. A simple Buckingham potential (cutoffs: min: 0 Å, max: 12 Å, Mg: A = 0.130 x 10⁴, B = 0.3, C = 0, O: A = 0.228 x 10⁵, B = 0.149, C = 27.9) was used to model the interaction between the ions.
Collected data was analysed using NumPy on Python and visualised using matplotlib and the seaborn graphics package.
Lattice Dynamics - Quasi Harmonic Approximation
The quasi-harmonic approximation (QHA) is based upon the harmonic approximation model for bonding interactions, which states:
where is the force acting on the atoms, is the spring constant and is the displacement of the atoms. Under the harmonic model, small displacements of atoms from their equilibrium position will lead to the propagation of waves through the lattice.
The characterisation of phonons in a solid is analogous to the electronic structure of solids. In a finite lattice, phonons can occupy discrete energy levels, similar to photons. Phonons of different energies can occupy each energy level, characterised by the wavevector, . As the lattice size increases towards infinity, the number of energy levels increase and eventually form one continuous line, otherwise known as bands. Phonons then occupy available states within the band. The occupation of phonons in energy levels can be understood as the vibration of atoms about their equilibrium positions.

However, under the harmonic model, variations in volume with temperature are not taken into account. It can be seen in Figure 3 that the potential is parabolic and thus symmetrical. This is because in the harmonic model, the atom is fixed at its equilibrium position and simply vibrates about this position. As such, there is no atomic displacement associated with the population of higher energy states. This means that there is no temperature dependence for molecular interactions as it is based entirely on the spring model. As such, the harmonic approximation cannot be used to model expansion of a system. The result of this is that a diatomic molecule with an exactly harmonic potential would not show an increase in bond length with temperature, remaining constant instead.
In order to examine the thermal expansion of a system, another model, the QHA, must be utilised instead. In the QHA, the harmonic expression for the Helmholtz free energy is retained and a dependence of vibration frequencies on volume is introduced.
The equation for the volumetric thermal expansion coefficient is given by:
Computationally, this can be calculated as:
where is the optimised cell volume at 0K and .
The free energy of a system using QHA is given by:
where is the zero point energy of the system, is Boltzmann's constant is the phonon wavevector and is the phonon branch.
It can be seen from the above equation that the energy of a system now contains a term that relates the bond length (and thus lattice volume) to bond vibrational frequency. As a result, this model can now account for some of the limitations of the harmonic approximation model, namely: zero thermal expansion, temperature independence of elastic constants and bulk modulus, equality of constant-pressure and constant-volume specific heats, infinite thermal conductivity and phonon lifetimes.[4]
Calculation of internal energy and phonon dispersion
The model used for lattice dynamics is a primitive cell of MgO, consisting of 1 Mg and 1 O atom, with a = 2.978 Å and α = 60°. The phonon dispersion was first plotted with 50 k points, followed by computing the phonon density of states by varying the shrinking factors, which essentially represent the number of sections each dimension is split into. The shrinking factors were varied from A=B=C=1 to A=B=C=64, increasing by a factor of two each time.
Optimising grid size
In order to determine the optimal grid size upon which further calculations would be based, the free energy of the system was calculated for different grid sizes from 1x1x1 to 64x64x64 (shrinking factor 1 to 64). Theoretically, the number of k-points sampled for each calculation should be the cube of the shrinking factor, in reality, this was less than the expected number due to symmetry. The selection of the optimised grid size was taken to be the first grid size where the free energy converged with subsequent increase in grid sizes.
Calculation of temperature dependence of free energy and volume
Using the optimised grid size determined previously, the free energy of the system at different temperatures was optimised. By minimising the free energy and obtaining the optimised value, other parameters such as the cell volume and lattice parameter could be obtained as well.
Molecular Dynamics
Moelcular dynamics utilises Newtonian mechanics to model the bulk properties of a system by using a supercell to model the periodic boundary. In classical mechanics, a force can be described by: where F is the force, m is the mass of the object and a is the acceleration of the object.
The force can also be described in terms of potential energy:
In the GULP, the forces acting upon and accceleration of the atoms are first computed. This then allows for the position and velocity of each atom in the system after time interval dt. This calculation is then looped for a predetermined amount of time, with a new position and velocity being calculated for every time step. As the calculation proceeds, the system will fluctuate until it reaches equilibrium, which is indicated by the temperature fluctuations of the system becoming negligible.
For this experiment, the calculation was carried out fixed NPT (N = number of particles, P = pressure, T = temperature), where P = 0 GPa and T was varied from 25 to 3000 K, in 100K steps. The time step was set at 1 fs and the number of equilibration and production steps were set at 0. The equilibration steps refer to the time steps where the system is allowed to fluctuate and reach equilibrium before results are taken in the production steps.
Results and Discussion
Computing the Phonons
Phonon Dispersion

Phonons refer to the vibrational modes of a system, which can be represented in the reciprocal space, or k-space. While phonons have discrete energy levels, when considering an infinite periodic crystal, the density of energy levels increase and eventually converge such that they may be observed as continuous bands. These bands can be illustrated in phonon dispersion diagrams as branches, seen in Figure 4 where the phonon dispersion in MgO was calculated with 50 points in k-space.
In the figure, one brillouin zone of the system is depicted. The points on the x-axis represent points of high symmetry in the fcc lattice. They can be represented in k-space as:
There are 6 branches shown in total, identified by looking at the low symmetry region between W and L. This is in agreement with the expected number of 6 branches in total, which can be calculated by solving the equations of motion for the 3D lattice. This can be broadly understood by considering each branch as a vibrational band and for each atom in the primitive cell to have one branch in each dimension. In this case, there are 2 atoms in the primitive cell along 3 dimensions, hence 6 branches are expected.
The different branches in the diagram arise from in-phase and out-of-phase interactions of the vibrations of the atoms. The lower energy band is known as the acoustic band (A) while the higher energy band is called the optical band (O). In the acoustic band, the motions of neighbouring atoms are in-phase, and in the optical band, motions of neighbouring atoms are out-of-phase. There are also two modes of propagation - longitudinal (L) and transverse (T). Longitudinal modes refer to displacements parallel to the propagation direction of the wave and transverse modes refer to displacements perpendicular to the propagation direction. Transverse waves can propagate in two directions within a 3D lattice and this arises in degeneracy of the branches at certain lattice symmetries.
Transverse modes are lower in energy than the longitudinal mode, thus, the four branches at point L are the TA, LA, TO and LO in increasing order of energy. Along Γ, the zone centre, it can be seen that the three acoustic modes are degenerate, but that the longitudinal and transverse optic modes have different frequencies. This is a feature of ionic crystals and arises from the fact that the longitudinal and transverse modes give rise to different long-range fields in the limit .[5]
Phonon Density of States
For a given system, the density of states refers to the number of states available per energy level increase. This can be represented by the equation:
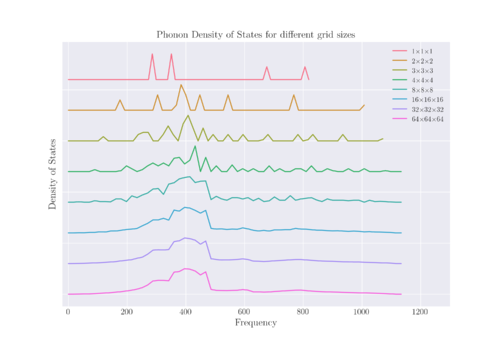
The DOS for various shrinking factors can be calculated; these shrinking factors essentially act as a grid within the k-space, from which the points are sampled to generate the DOS. The greater the grid size, the more points in k-space are sampled, leading to a greater precision of data. Figure 5 shows the DOS of the system measured at different shrink factors, with the maximum height of each graph normalised to 1 to facilitate comparison. It can be seen that as grid size increases, so does the resolution of the DOS, eventually leading to a convergence of the peaks to form a continuous spectrum.
Looking at Figure 5, it can be seen that there is minimal difference in the DOS from a shrink factor of 16 to 64, with negligible difference between 32 and 64. This implies that a grid size of 32x32x32 is optimal for the calculation of the density of states as it is the smallest grid size after which there is no change in the DOS. However, a grid size of 16x16x16 should be enough to obtain a reasonable approximation of the DOS as well.
Using a bigger grid size than the optimal would mean that more points in k-space are sampled, thus leading to a smoother and more precise DOS. A doubling in the shrinking factor will increase the number of k-points sampled by 8-fold. However, this comes at a computational cost. In comparison, using a smaller grid size than optimal may lead to an inaccurate representation of the DOS and phonon dispersion as only certain k-points are evaluated and overlook important features in the DOS as well. One way to look at the relationship between the phonon dispersion curve and the phonon density of states is to draw a horizontal line across each energy level in the phonon dispersion curve and summing up the number of times that the phonon branches intersect with the line. This represents the frequency of points in k-space at that particular energy level and this is represented visually in the plot of the DOS.
A broad peak around a frequency of 400 cm-1 can be seen for shrinking factors 2 and above. Comparing this to the phonon dispersion diagram, it can be seen that this peak corresponds to the region in the phonon dispersion curve where there is a high density of branches across k-space.
For a grid size of 1x1x1, a single k-point was sampled, which was (0.5 0.5 0.5) of a period in k-space. This corresponds to the point in k-space, or L in Figure 4. Indeed, it can be seen that there are four discrete energy levels at L in the phonon dispersion diagram, corresponding to the 4 peaks seen in the density of states. The lower energy peaks with greater amplitude in the DOS correspond to the two degenerate branches at around 286 cm-1 and 364 cm-1. The other two peaks at higher energies correspond to the two higher energy branches on the dispersion diagram at around 676 cm-1 and 806 cm-1.
Finding the optimal grid size
Table 1. The Helmholtz Free Energy of MgO with sampled at different grid sizes, with a comparison of each free energy to the converged free energy obtained
| Grid Size | Helmholtz Free Energy / eV | Ebest - E / eV |
|---|---|---|
| 1x1x1 | -40.930301 | -0.003818 |
| 2x2x2 | -40.926609 | -0.000126 |
| 3x3x3 | -40.926432 | 0.000051 |
| 4x4x4 | -40.926450 | 0.000033 |
| 8x8x8 | -40.926478 | 0.000005 |
| 16x16x16 | -40.926482 | 0.000001 |
| 32x32x32 | -40.926483 | 0 |
| 64x64x64 | -40.926483 | 0 |
From Table 1, it can be seen that the Helmholtz free energy converges quickly as the grid size increases. Eventually, the energy converges and any increase in the grid size has no significant change in the free energy. As such, for calculations accurate to 1 meV, 0.5 meV and 0.1 meV per cell, a grid size of 2x2x2, 4x4x4 and 8x8x8 would be sufficient. Larger grid sizes provide more accurate answers, however, this comes at a computational cost as it is more intensive to calculate. For further calculations, a grid size of 16x16x16 will be used, for a precision of 1 µeV.
The optimal grid size is likely to vary for different materials. For compounds similar to MgO, such as CaO, which has a similar cubic structure and lattice parameter[6], the optimal grid size is likely to be the same.
The optimal grid size is dependent on the size of the unit cell of the material. Thus, zeolites such as faujasite which have a large lattice parameter of 24.63 - 24.65 Å[7] will have a smaller reciprocal lattice space, k. Thus, the optimal grid size required is likely to be smaller for a zeolite. Likewise, a metal such as lithium which has a smaller lattice parameter, will require a larger optimal grid size as it will have a larger k-space.
Temperature dependence of Free Energy and Volume
Effect of temperature on free energy and lattice constant
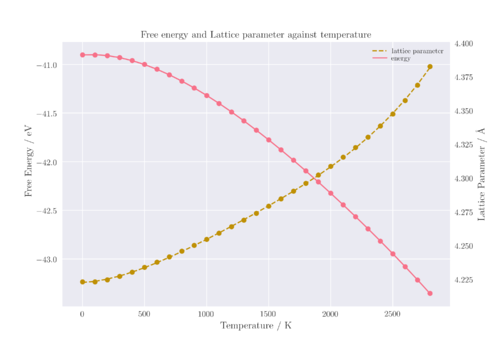
Looking at Figure 6, it can be seen that the two curves are reflections of each other about the x-axis. Both show three sections with different shapes: a horizontal section at low temperatures, followed by a region of linearity, and then an exponential region at high temperatures. the Helmholtz free energy is shown to decrease with temperature, given by the equation:
Between 0 to 200 K, the rate of change of free energy and cell volume with respect to temperature is smaller than expected if the relationship were linear. This is because at low temperatures, the entropic contribution to free energy is reduced and as a result, the main component of free energy at these lower temperatures was the zero point energy of the lattice.
However, as temperature increases, the entropic contribution increases until the contribution from the internal energy becomes insignificant, leading to a linear region in the graph. Throughout the linear region, the entropy of MgO is not expected to increase by much as the material remains a solid. However, it can be seen that as temperature increases, there appears to be a deviation from linearity once again. This can be explained by the temperature dependence of entropy, which increases with temperature due to increased molecular motions.
A similar explanation can be applied for the trend seen in the plot of lattice parameter with temperature. In Figure 6, the primitive cell lattice parameter has been multiplied by a factor of to show the lattice parameter of the conventional cell instead. Since the QHA model is applied, an increase in lattice parameter is expected as temperature increases due to an increase in the kinetic energy of the atoms. Classically, kinetic energy is linearly related to temperature and thus a linear plot is expected. However, at low temperatures, the zero point energy contribution to motion is comparable to that of motion induced by entropy. Thus, there is a non-linear relationship at low temperatures which becomes linear at higher temperatures.
When temperature is increased to beyond 1800 K, it can be seen that the graph deviates from linearity once again. Since the QHA is based upon the harmonic approximation, it follows that the model becomes a less accurate method to model interactions as temperature increases. This can be rationalised by considering the free energy of thermal expansion.
As temperature increases, so does the amplitude of vibration. At low temperatures, the oscillations are small. At high temperatures, however, the atoms oscillate more strongly and the material expands as a result to minimise interatomic repulsion. This effect becomes more pronounced at higher temperatures, up until the melting point, which is where the QHA model breaks down. This happens due to the anharmonicity of the potential, which is not accounted for in the harmonic approximation. Anharmonicity is a result of the atoms moving further away from their equilibrium position at higher temperatures as a result of larger vibrations. In addition, the harmonic approximation does not account for bond breaking behaviour, which means that phase transitions cannot be modelled using this model. As a result, the deviation from linearity of the lattice parameter as temperature increases is explained by the breaking down of the QHA model due to the assumptions used in the harmonic approximation.
Computation of α using QHA
There are two methods to calculate the value of the thermal expansion, α. The first involves assuming that the value of α remains constant throughout the linear region of the volume-temperature graph, and taking the gradient of the linear fit in that region.
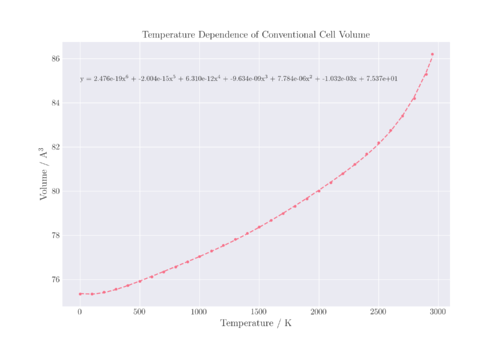
The other method involves polynomial fitting of the temperature dependence of volume, then taking the first derivative of the polynomial as the function of α against temperature. This was the method chosen, with a 6th order polynomial being used to fit the volume-temperature relation. Indeed, this is the more accurate method as the thermal expansion coefficient is dependent on temperature.
The literature value of α at 300 K is K-1, while the value obtained using the QHA at that temperature is K-1.
Comparison of the temperature dependence of α with literature shows similar relationships. Looking at Figure 8, there appears to be three different regions in the graph of α calculated from the QHA against temperature. This is related to the previous section where the relationship between the lattice parameter and temperature was described. The conventional cell volume against temperature, shown in Figure 7, is related to the lattice parameter by a cubic function. The thermal expansion coefficient, α, is related to the rate of change of volume with temperature.
At low temperatures (0 to 200 K), there is a sharp increase in α with temperature; this is because the thermal expansion is initially dominated by the vibrational ground state. This also corresponds to the filling of the peaks around 400 cm-1 in the phonon DOS. As the available energy states are filled up, the increase in α with temperature decreases, staying relatively constant. This corresponds to the linear region of the volume-temperature plot. Within this linear region, it can be seen that the QHA constantly underestimates the value of αb- this could be due to various reasons, such as the inadequacy of the Buckingham potential in modelling the system or the breakdown of the approximations made in the QHA.
Beyond 2000 K, the value of α calculated using the QHA increases rapidly with temperature as a result of the breakdown of the approximation due to anharmonicity of the system, while there is no available literature data beyond that temperature for comparison.
Molecular Dynamics
Cell Volume
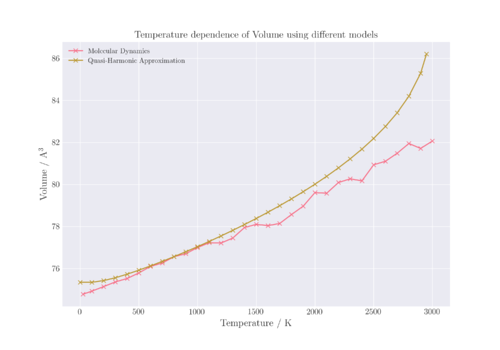
In order to compare the volume results from both LD and MD models, the primitive cell volume from LD was multiplied by a factor of 4 and the supercell volume from MD was divided by 8 to obtain the conventional cell volumes from both models.
As can be seen in Figure 9, there are significant differences in the volume of the system calculated at different temperatures. Between 500 to 1100 K, both models give similar results with a linear dependence. However, at low temperatures, it can be seen that for QHA diverges from non-linearity due to the anharmonicity of the potential and the contribution of the zero point energy to the free energy of the system. In the MD model, there is no zero point energy contribution and the energy is derived simply from the kinetic energy, which observes a linear dependence to temperature. At high temperatures above 1100 K, the curves are notably different again. This is mostly a result of the divergence of the QHA result from linearity at high temperatures, as explained previously.
However, it can also be seen that the volumes calculated for the MD model at high temperatures show greater deviation from linearity. This is likely due to the cell size used not being large enough to account for the higher temperatures, as at higher temperatures there would be more vibrations and movements that need to be considered. Hence, a larger cell size is required in order to get a more accurate picture of the atoms. In addition, there are long range interactions that occur at higher temperatures that need to be taken into account, which thus results in the need for a larger cell size.[8]
In order to determine the optimal cell size at higher temperatures, the MD simulation could be run against different cell sizes until the final averaged total energy converges. In this case, a supercell 32 times the volume of the primitive cell (LD calculations) was used for MD calculations.
Thermal Expansion Coefficient
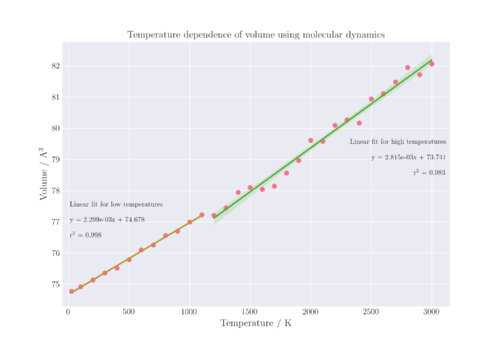
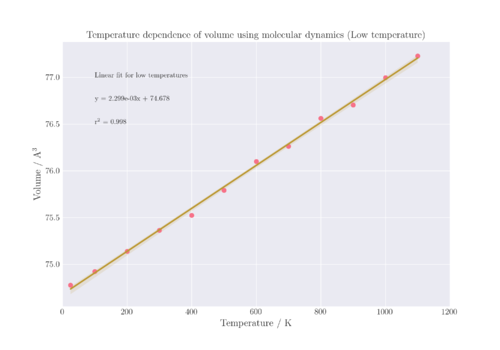
The thermal expansion coefficient of MgO can be obtained by carrying out a linear regression model fit on the linear section of the V-T plot. The thermal expansion coefficient is then calculated from the gradient of the linear fit as a constant value for the entire temperature range of 25-1100 K, which is .
Figure 10 shows the lattice volumes for the entire range of temperatures sampled; however, only the range of 25 - 1000 K was used to determine the thermal expansion coefficient as it had a greater linear relationship compared to the entire range. In order to visualise this, a linear regression was conducted for the temperature range of 1200 - 2800 K, and it can be seen that the r2 value for that regression line is lower than the regression line from 25 - 1100 K, thereby showing that it is more suitable to only assume that α is constant for that lower temperature range. In addition, the translucent bands around the regression line represent the 95% confidence interval for that regression. For the higher temperature fit, the confidence interval is much larger than that of the lower temperature fit, which cannot be seen at the scale of the plot in Figure 10, and must be plotted separately in Figure 11 instead. The confidence interval of the regression refers to the probability that if the same study was repeated with different random samples, that the slope of the regression line would fall within the same confidence intervals X% of the time, where X is an integer and set at 95 for this regression estimate.
Table 2. Comparison of the thermal expansion coefficients obtained using Quasi-Harmonic Approximation and Molecular Dynamics from 100 - 1100 K, with a comparison to literature values at the same temperature range.
| Temperature / K | QHA αV / 10-5 K-1 | MD αV / 10-5 K-1 | Literature αV[9] / 10-5 K-1 |
|---|---|---|---|
| 100 | 0.345 | 3.075 | - |
| 200 | 1.475 | - | |
| 300 | 2.178 | 3.12 | |
| 400 | 2.581 | 3.57 | |
| 500 | 2.789 | 3.84 | |
| 600 | 2.883 | 4.02 | |
| 700 | 2.926 | 4.14 | |
| 800 | 2.960 | 4.26 | |
| 900 | 3.015 | 4.38 | |
| 1000 | 3.104 | 4.47 | |
| 1100 | 3.235 | 4.56 |
Looking at Table 2, it can be seen that although only one value for α is predicted by the MD model for the range of temperatures shown, it is closer to literature values than that predicted by the QHA. All of the values of α are in the same order of magnitude, which is quite small and suggests that the MgO does not expand much with temperature, which is in line with the temperature range that is calculated as it is below the melting point of MgO.
The two methods produce different answers because of the fundamental differences in the way that the energy of the system is calculated. In the MD model, there is no zero point energy contribution, hence at low temperatures, the volume still shows a linear dependence on temperature. On the other hand, the QHA model consistently underestimates the value of α but still shows a similar temperature dependence with literature values, up to ~1800 K. Further analysis is required in order to determine if MD is a suitable model for the thermal expansion of MgO at higher temperatures.
Conclusion
Simulations of the thermal expansion of MgO was conducted using two different models - the quasi-harmonic approximation and lattice dynamics. The thermal expansion coefficient for MgO at 300 K was calculated to be for QHA and for MD, in comparison to the literature value of . Both models underestimate the actual value of α and show greater divergence from the literature value at higher temperatures. The thermal expansion coefficient calculated using MD was assumed to be constant at low temperatures due to low fluctuations, whereas the variation of α with temperature resembled that of literature. Molecular dynamics gives more accurate results at a low temperature range although there is a greater computational cost. Nevertheless, lattice dynamics is useful in showing the general variation of thermal expansion with temperature as well as the lack of temperature dependence at very low temperatures. As both models used showed deviation from literature at high temperatures, further investigation is required in order to determine which model is more suitable for studying the thermal expansion at these higher temperatures. Another area for further work is to look at other physical parameters that can be extracted from the model, such as the bulk modulus of the system as well as the specific heat capacities and compare them to literature.[4]
References
- ↑ M. T. Dove, in Introduction to Lattice Dynamics, Cambridge University Press, Cambridge, 1993, ch. 3, pp. 1-17.
- ↑ 2.0 2.1 CRYSTAL geometry input, http://www.theochem.unito.it/crystal_tuto/mssc2008_cd/tutorials/geometry/geom_tut.html, (accessed 13 Mar 2018)
- ↑ The Quantum Harmonic Oscillator, https://phys.libretexts.org/TextMaps/General_Physics_TextMaps/Map%3A_University_Physics_(OpenStax)/Map%3A_University_Physics_III_(OpenStax)/7%3A_Quantum_Mechanics/7.5%3A_The_Quantum_Harmonic_Oscillator, (accessed 13 Mar 2018)
- ↑ 4.0 4.1 A. Erba, M. Shahrokhi, R. Moradian and R. Dovesi, J. Chem. Phys., 2015, 142, 44114
- ↑ M. T. Dove, in Introduction to Lattice Dynamics, Cambridge University Press, Cambridge, 1993, ch. 3, pp. 36-54.
- ↑ O. Madelung, U. Rössler, M. Schulz in Landolt-Börnstein - Group III Condensed Matter, Springer, Berlin, Heidelberg, 1999, pp 1-3
- ↑ Faujasite, http://rruff.info/doclib/hom/faujasitena.pdf, (accessed 13 Mar 2018)
- ↑ Norbert Attig, Kurt Binder, Helmut Grubmuller, Kurt Kremer (eds.), Introduction to Molecular Dynamics Simulation, John von Neumann Institute for Computing, Julich, 2004
- ↑ I. Suzuki, J. Phys. Earth, 1975, 23, 145-159.

