Rep:MGO:FHT14
Computationally Modelling the Thermal Expansion Coefficient for MgO
Felix Thompson — 00930702 — Wed. 6th December 2017
Abstract
Two computational methods—a Quasi-Harmonic approximation and Molecular Dynamics simulations—were utilised to calculate the volumetric thermal expansion coefficient of the MgO lattice. For the temperature range 450–1250 these two models showed good agreement with each other, and resembled the general trends seen in experimental results, but deviated from these true values. Overall, given more computational time these models show promise in modeling the volumetric thermal expansion coefficient αV.
Introduction
As Material Scientists increasingly move towards designing more complex novel materials, the difficulty in quickly finding a suitable composition increases. This delay intrinsically means higher cost, and higher waste. As such, in-line with this need, the drive for more capable computational modelling tools becomes more and more apparent. These tools' ability to closely predict a material's properties can provide suitable starting points for a more direct route to a final material, saving waste and time — for example in the well studied structural property predictions of propeller and turbine blades.[1]
The volumetric thermal expansion coefficient, αV, is one such useful physical property. Defined in Eq. 1, it allows the prediction of the change in volume of a solid (with respect to its original volume) due to a change in temperature. Predictably knowing the variation of volume is of vital importance to any structural analyst. This thermal variation is tied to the movement of the material's component atoms about their equilibrium positions. Such vibrations are also inherently tied to properties such as electrical and thermal conductivity, transport properties, heat capacity, etc., demonstrating an understanding of the structure is vital to the prediction of properties.
Initially predicting the properties of new materials was done intuitively, one would expect a combination of two materials to have a mixture of their respective properties. Then as the need for finer analyses rose, mathematical models of lattice interactions and structures developed. Initially, the limiting factor of structural modelling was the time taken for a person to calculate. The limits of a person's computational power meant that properties were only calculable for heavily approximated systems — unmoving, rigid point-charges. Properties such as electrostatic potential or lattice enthalpies have been as such predicted since the 1910s [2]. The advent of serious external computational power has allowed the simulation of far more complex systems. Now hundreds of thousands of atoms can be calculated over as they vibrate about a varying structure, outputting useful properties of the physical material.
The calculations in this experiment were performed by Gale's General Lattice Utility Program (GULP), which was interfaced with via Searle's DL Visualize (DLV) software.[3][4] GULP allows the modelling of a crystal lattice by first separating interactions into long-range and short-range effects — an approximation justified by the extended symmetry of the crystalline system. The long-range interaction is the electrostatic energy, calculated by an Ewald summation.[5] The short-range interaction is the inter-atomic potential, modeled as a Buckingham potential. The high symmetry in crystalline lattices allows GULP to reasonably approximate a smaller section of the lattice for the bulk crystal, cutting down on the computation required.
Using these tools, we calculated the volumes and free energies of MgO lattices at temperatures across 0–2600 K, using two different simulation methods—the quasi-harmonic approximation, and molecular dynamics. These results provided insight into the optimal size of the lattice to calculate over, a balancing act of accuracy and computation time. The optimised parameters then allowed the calculation of the volumetric thermal expansion coefficients across this temperature range.
Quasi-Harmonic Model
The structure of a crystal can be thought of as a lattice comprised of atoms bonded to their nearest neighbours. These bonds can flex and stretch, allowing the propagation of a vibrational wave through the material. The atoms can therefore be modeled as oscillating about their lattice point with some harmonic restoring force (SHO). But as we are investigating thermal properties, and therefore require the lattice to be able to expand, we must instead model the atoms under an anharmonic force — this is the fundamental methodology of the Quasi-Harmonic approximation. To model these lattice vibrations, we introduce the concept of the phonon: a quasiparticle whose movement through a structure represents the movement of its corresponding vibrational wave. Each vibration has its own corresponding wave-vector k. The sum across all the wave-vectors' energies can be related to thermodynamic quantities such as the Helmholtz Free Energy. Eq. 2 describes the Free Energy F as comprised of by the Lattice Energy E, the vibrational zero-point energy of the lattice, and an entropic factor.
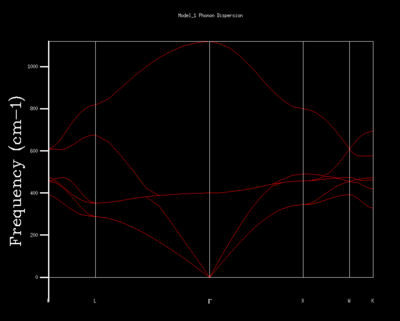
Each wave-vector k has also some corresponding frequency ω(k), linked by a dispersion relation. We can plot these wave-vectors against their frequencies to produce a Phonon Dispersion diagram. GULP separates a lattice cell into a grid of k-points, and evaluates the wave-vectors at each point. For Fig. 1 it evaluated at 50 k-points along the W-L-Γ-X-W-K path. Comparison to an experimentally derived phonon dispersion curve for MgO can be found in Peckham et al. (1967).[6]

The dispersion curve can be related to another value, the density of states (DOS). The DOS represents the summing over all k-points at a specific frequency, showing the vibrational modes at that point. In order to calculate the DOS for the entire infinite crystal, we would require similarly infinite computational power. Consequently, we approximate some grid of unit cells to represent the bulk crystal. As these differently sized grids contain a different number of atoms — 8n3 atoms for a grid of nxnxn unit cells — they are able to represent a different set of vibrations.
| 1x1x1 | 4x4x4 | 8x8x8 |
|---|---|---|
 |

|

|
| 16x16x16 | 32x32x32 | 64x64x64 |

|

|

|
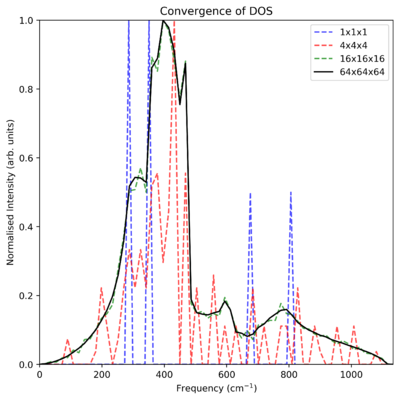
As seen in Table 1, as the grid size increases, so does the resolution of these DOS plots. The smallest grid shows only 4 sharp peaks across the entire frequency spectrum (it is noted that these vibrations correspond to the L k-point in Fig. 1). As grid size increases, these isolated sharp peaks coalesce and begin to form one continuous curve. The 8x8x8 grid is perhaps the first to give a strong evocation of the true phonon dispersion curve. Fig 2 normalises these curves and plots them over the highest resolution curve, showing that they converge to the 64x64x64 grid (2,000,000) atoms. Due to the high computation time for this curve, ~10 minutes, a smaller grid close to the highest resolution is preferable. The grids 16x16x16 and 32x32x32 both show the continuum well, with an ideal grid size likely lying between these two values.

This is solely an optimum grid size for the MgO lattice. For the similar metal oxide CaO, we would expect the grid size to be similar — the ions are modeled as point charges, so the only significant difference is the slight increase in molar lattice volume. Because of this, a 16x16x16 grid represents a larger volume in physical space, and therefore a contraction in k-space. This means that the grid size might be slightly smaller. This effect would be more noticeable in a zeolite, where the unit cell is much more significantly larger than the MgO unit cell, as well as it containing many more atoms. This means that a much smaller grid size could be used, whilst still encompassing a larger physical space with more atoms represented. Lastly we could compare to a Li metal lattice, which is significantly smaller than the original metal-oxide lattice, requiring a larger grid size for the inverse reasoning.
16x16x16 was selected qualitatively — it well approximated a higher resolution simulation. To more quantitatively select a grid size, we move on to analyse the Free Energy for each grid size in 300 K Phonon DOS calculations. Fig. 3 plots these Free Energies, showing that the ultimate value of -40.926483 eV is converged to at a grid size of 18x18x18. The grid sizes for which the energy is within 1 meV. 0.5 meV, and 0.1 meV of the true value are 2x2x2, 2x2x2, and 3x3x3 respectively. Despite this, as we have data at the 1 μeV level, and the difference in computation time between a 3x3x3 grid and a 18x18x18 grid is only a few seconds, we will use this larger grid as our optimised grid size.

With this grid size, we then sought to optimise the geometry of the MgO lattice with respect to the Helmholtz Free Energy at temperatures between 0 and 2600 K. Table 2 holds the respective plots of temperature against Free Energy, volume, and the volumetric thermal expansion coefficient calculated between each pair of values. The volume plot shows an increase of volume with increasing temperature, where at low temperatures the increase is very minor. This corresponds to the region where the zero-point energy of the lattice is the dominant energy term. As the entropic term begins to dominate, the volume begins to increase at an accelerating rate. The change in volume is clearer from the Volumetric Thermal Expansion Coefficient plot, which is a scaled derivative of the Volume vs Temperature plot. The initial values are very close to zero, suggesting a stationary point at T=0 for the volume curve, and then increases rapidly before partially plateauing across 600–1500 K where αV increases approximately linearly with temperature. Lastly as the temperature approaches closer to the melting point of MgO (3125 K[7]) the expansion coefficient begins to increase much more severely. In fact no data was calculable for 3000 K or beyond due to the simulation breaking down. This breakdown is likely due to the simulation struggling to deal with adding even more vibronic states to the anharmonic potential, as well as the atoms becoming too constrained by this model.
This leads to the flaws in the Quasi-Harmonic approximation. Although it can be seen that the general trends in our calculated values correspond to those in the plotted experimental data[8], our values are consistently off by approximately 20x10-6 K-1. This shows that the approximations made (that only short-range interactions need to be used due to a lattice screening of charge; that those interactions are well modeled by a Buckingham potential; that the ions can be treated as point charges, rather than polarisable spheres) characterise the changes in αV well, but do not well determine the absolute values. Were the calculations to not make some of these approximations, a value closer to the true experimental value could be achieved, but at the detriment of computational time.
| Free Energy | Volume | Thermal Expansion Coefficient |
|---|---|---|

|

|

|
The actual origin of these expansions is qualitatively simple — a higher temperature gives atoms more thermal energy, allowing them to vibrate over a wider space, the lattice then expands so as to not confine these higher energy atoms. Were we to model their movements as Simply Harmonic Oscillators we would not see any thermal expansion, as their potential wells are symmetric about their initial lattice point. Therefore, although with higher energy the atoms will vibrate more, they would remain on average in their original lattice point, leading to no net change in volume. Consequently we model the atoms' restoring force as an anharmonic oscillator, so higher energy states correspond to a net deviation from their starting point — thermal expansion.
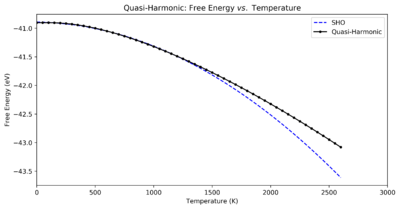
Fig. 4 shows the Quasi-Harmonic Free Energy vs. Temperature data seen in Table 2, but with a quadratic fit to the energies below 1300 K. This fit demonstrates that for lower temperatures the change in Free Energy well matches a quadratic curve — i.e. a Simple Harmonic Oscillator, justifying this approximation for this region of temperatures. The deviation from this SHO curve at higher temperatures equally demonstrates that an anharmonic restoring force is being applied to the atom.

Table 3 shows data from the DOS plots as temperature increases across 0–2600 K. The first graph shows the DOS curves for three temperatures, 50, 1000, and 2600 K, as well as the maximum intensity frequency for each of the 52 temperatures as a colour gradient. This shows that the maximum frequency decreases with temperature, as well as that frequency becoming more and more dominant. The second graph plots the same DOS curves, normalised by their maximum intensity to better demonstrate the movement of the curve's features. This shift to lower frequencies is explained by the inter-atomic distances increasing as the crystal expands — an expansion in physical space, causing a contraction in reciprocal space. As well as this, as the long range order becomes less pronounced as the crystal approaches the melt, the number and population of vibrational modes will decrease.
| Unnormalised | Normalised |
|---|---|

|

|
Molecular Dynamics
The second simulation method moves away from thermodynamic equations, following the individual atoms as they move under the effects of their surroundings. Here this process follows the below general steps:
- The atoms are initially positioned on the ideal MgO lattice
- They are given velocities in random directions with magnitudes corresponding to the temperature
- The forces on each atom are calculated and summed
- The corresponding acceleration of each atom is calculated and updates the velocity after the time step ()
- The new positions are calculated after the time step ()
- Repeat process until properties approach a stable average
Again, like the Quasi-Harmonic approximation, a single unit cell is not enough to accurately model the bulk properties. By increasing the number of cells until the energy of the lattice converges to some value, it was determined that a 32 unit cell supercell provided enough of the crystal to well model the system, whilst keeping the computation time low. The settings used for these simulations were: NPT ensemble, Temperatures 50–2600 K, Time Step 1 fs, Equilibration Steps 500, Production Steps 500, Sampling Steps 5, Trajectory Steps 5.
Simulations were performed at every 50 K across 50–2600 K, with the volumes and pairwise thermal expansion coefficients plotted in the graphs of Table 4. The first graph shows a roughly linear dependence of volume w.r.t. temperature until 1800 K. After this point the volume begins to oscillate about this linear line — this is likely due to the atoms now moving fast enough that over the 1 fs time step the atom moves much further than reasonable. Analysis of the .log files shows these high temperatures to have high kinetic energies, demonstrating that the atoms have not converged to their stable positions for that temperature. Increasing the time step, equilibration steps, and production steps setting will give a result more likely to be closer to the stable state. Due to these large fluctuations at high temperatures it is difficult to tell what the simulation will do as the temperature further approaches the melting temperature. The αV plots demonstrate a similar issue — α remains quite constant (approximately 30x10-6 K-1) until these volume variations begin to dominate. Nonetheless in the experimental data's approximately linear region of 500–1000 K ,this computational data is likewise approximately constant. These two sets of data also remain close in value — within 20%.
| Volume | Thermal Expansion Coefficient |
|---|---|

|

|
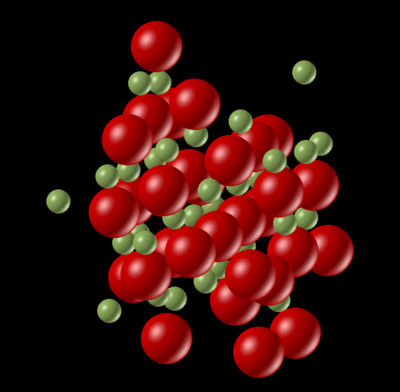
Fig. 5 shows a snapshot of a vibration in the MgO supercell at 3500 K — above the melt temperature of 3125 K. The irregular placement of the atoms throughout the supercell demonstrates that the material is no longer in a rigid regular solid lattice, in-line with having melted. Further experimental and computational data would be required to assess the role of Molecular Dynamics in the simulation of the properties of liquid MgO.

Comparison
Table 5 holds the graphs comparing the computed volumes and αV values for the two computational methods. Note here the primitive volume for the Molecular Dynamics simulations is 1/32 times the previously reported values in Table 4. The volume plot shows very good agreement for the two methods for the 600—1400 K region. This corresponds to the region where the Quasi-Harmonic volume is at its most linear. These two curves initially disagree, with the Quasi-Harmonic volume originally not increasingly significantly with temperature <200 K, and they separate again >1500 K where both the Molecular Dynamics volume begins to be vary wildly and the Quasi-Harmonic begins to accelerate upwards.
Similar agreements are visible in the αV against temperature plot — the two are initially separate and then have a linear region over 450–800 K, for which the Molecular Dynamics values are sandwiched between the experimental and Quasi-Harmonic data.
| Volume | Thermal Expansion Coefficient |
|---|---|

|

|
The initial difference in volume is due to the Molecular Dynamics simulations not taking into account the zero-point lattice energy, and as such there is no real deviation from a linear relationship <1500 K. This difference tracks through into the αV plot. Unfortunately due to the limited temperatures for which we have experimental data, no real assessment of the ability for the simulations to predict the volumetric thermal expansion coefficient across the full range of temperatures for MgO's solid state is possible.
For the 450–800 K region, the two methods are agreeable enough for both volume and αV, that the only significant separating difference is the computation time — the Molecular Dynamics calculations being 20% faster. This is likely due to both the inherent differing complexities of the calculations required, as well as that the Molecular Dynamics supercell uses only 32 units cells to achieve good results, whereas the Quasi-Harmonic calculations utilise 5832 unit cells, requiring much more computation.
Conclusion
Overall the two computational methods show good agreement with each other for regions across 450–1400 K for volume and αV. Comparison to experimental results show that over this region both methods show the general trends seen in the variance of αV with respect to temperature, but both computational methods show a deviation from the true values by at least 20%.
The consistent curves produced by the 18x18x18 lattice for the Quasi-Harmonic approximation show that its parameters were well chosen, but with the production of a script to automatically run calculations and extract their results, a much larger lattice could be selected and the program left to run unattended for several days — running calculations at a higher resolution than every 50 K. The large variance seen in the Molecular Dynamics simulations necessitate the reassessing of the calculation parameters, mainly decreasing the time step between force recalculations. Again the creation of a script to handle the running of calculations is the major barrier to collecting a wider set of more precise data. There is the need for more experimental results for αV, as we are currently only able to compare the 300–1250 K region. Especially the information closer to the melting point for MgO will be of interest to be able to model. Lastly, we have only been able to model the MgO system, in order to determine if these computational methods are applicable to a wider range of materials, we must attempt similar calculations on differing, and more complex, systems.
References
- ↑ A. M. Cuitino and M. Ortiz, "Computational modelling of single crystals", Modelling Simul. Matter. Sci. Eng., 1992, 1, 225–263.
- ↑ D. Quane, "Crystal lattice energy and the Madelung constant", J. Chem. Educ., 1970, 47, 396.
- ↑ B. G. Searle, "DL Visualize", Comp. Phys. Comm., 2001, 137, 25–32.
- ↑ J. D. Gale, "GULP: A computer program for the symmetry-adapted simulation of solids", J. Chem. Soc., 1997, 93, 629–637.
- ↑ T. S. Bush, J. D. Gale, C. R. A. Catlow and P. D. Battle, "Self-consistent Interatomic Potentials for the Simulation of Binary and Ternary Oxides", J. Mater. Chem., 1994, 4, 831–837.
- ↑ G. Peckham, "The phonon dispersion relation for magnesium oxide", Proc. Phys. Soc., 1967, 90, 657.
- ↑ C. Ronchi and M. Sheindlin, "Melting point of MgO", J. App. Phys., 2001, 90, 3325.
- ↑ A. S. Madhusudhan Rao and K. Narender, "Studies on Thermophysical Properties of CaO and MgO by gamma-ray attenuation", J. Thermo., 2014, 2014, 8.
