Rep:Louisa O'Hare MgO Modelling
Abstract
The aim of this experiment was to investigate the vibrational modes of MgO quantify how material behaves when the temperature is increased. It was found that 20x20x20 was the optimum grid size to compute the Density of States from the phonon dispersion. Using a model of MgO, the thermal expansion coefficient was calculated using both the Quasi-Harmonic approximation, for which it was found to be 2.822 x10⁻⁵ K-1, and molecular dynamics, for which it was found to be 3.171 x10⁻⁵ K-1
Introduction
MgO is a crystal lattice with a face centred cubic structure, which can be seen clearly when drawn as a conventional unit cell (Fig 1.). The primitive unit cell (Fig 2.) fits within the conventional unit cell, and contains only two atoms, while the conventional unit cell contains 8. The supercell of MgO (Fig 3.) contains 64 atoms, and is twice the length of the conventional cell in the x, y and z direction. Although the volume of each type of unit cell changes, the density remains the same, and therefore can be converted between the three of them. This allows for direct comparison between the Quasi-Harmonic approximation, which uses a primitive cell, and Molecular Dynamics, which uses a supercell.
 |
 |
 |
|---|
In the MgO unit cell, each ion is vibrating, so could either move in the same direction as the ions around it (in phase) or in the opposite direction. As MgO is an infinite crystal structure, there are an infinite number of vibration states which creates a continuum of vibrational levels, known as a branch, with each vibration level having a value of k associated to it, as before, creating the phonon dispersion, with phonon being the particle associated with the vibration. The lowest energy state is all in phase and k=0. The highest energy state is all out of phase and has the value k=π/a, with a being the distance between the atoms. From 0 to π/a, the number of nodes and the energy increases. As the vibrational levels from 0 to π/a are the same as 0 to - π/a, the graph is symmetrical about the y-axis. This has the length a*, where a*= 2π/a, hence why k-space is also known as reciprocal space. The Density of Sates (DOS) can then be formed using the phonon dispersion. The Quasi-Harmonic approximation uses the vibrational levels of the molecule to optimise the free energy of the structure at different temperatures with constant pressure and changing volume. Quasi harmonic is used rather than the harmonic approximation, as this would only be a suitable approximation at around the zero-point-energy. As the temperature is increased, this model is no longer accurate as there is it does not move from the equilibrium distance between atoms, while in reality the distance between the particles would increase with increasing temperature and kinetic energy. The Quasi-Harmonic approximation can then be used to find the optimised free energy and cell volume at each temperature.
The unit cell volume can also be computed using Molecular Dynamics, where the force on the atoms at each temperature is calculated, and then used to find the acceleration (using Newton’s second law: F=ma). This in turn is used to compute the velocities of the atoms, and their positions. This is repeated until an average temperature and an average cell volume is obtained.
The thermal expansion coefficient (α) is a measure of the amount the volume of a material increases by as the temperature is raised, and is given by the equation: (Eq. 1)
The equation includes a normalisation of , to make the thermal expansion coefficient an intrinsic property, so that it does not depend on the amount of material present. Thermal expansion comes from the increase of bond vibration as the temperature increases, therefore increasing the average separation between the atoms, and thus increase the volume of the material.
Method
In the Quasi-Harmonic approximation, the grid size, and therefore the number of k-points used was determined by first using the DOS, and then by optimising the Helmholtz free energy. This was found to be a 20x20x20 grid, which was then used to compute the lattice parameters at temperatures from 0 to 2900K, as above 3000K the lattice parameters cannot be computed and any results would not be valid. Molecular dynamics was then used to compute the volume of a supercell at temperatures from 0 to 4000K, using a timestep of 1 femtosecond, with averages being made over 5 timesteps, and the average temperature and volume being recorded.
This experiment was performed using a linux operating system, and DLVisualize as the interface, with GULP (General Utility Lattice Program) being used to simulate the system and calculate the energy and lattice parameters.
Results and Discussion
Lattice Vibrations - Computing the Phonons:

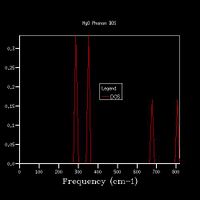
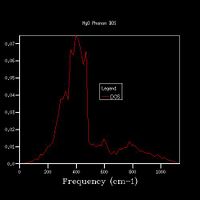
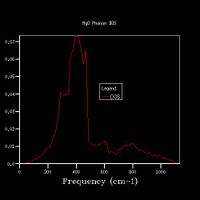
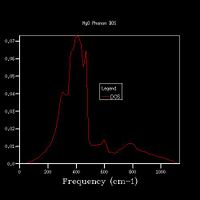
Fig 4 shows the phonon dispersion computed, with the k-points at various points labelled, for example Γ shows the point at k=0 - where all phonons are in phase. There are 6 branches as there are 2 atoms within a 3D structure. The density of states was calculated for a 1x1x1 grid (Fig 5a.), and therefore used only one k-point. By comparing the DOS graph with the phonon dispersion, it can be seen that this is at point L. With the degenerate frequencies at around 300 cm-1 and 350 cm-1 corresponding to the two larger peaks also at the same frequencies, and the frequencies at 680 cm-1 and 800 cm-1 corresponding to the peaks at half the height. This can be confirmed by viewing the log files from each calculation – the DOS shows that the k-point has the coordinates of x, y, and z are all 0.5. By looking at the k-point at this coordinate for the phonon dispersion, it can be seen that both have the frequencies of 288.49, 288.49, 351.76, 351.76, 676.23 and 818.82 cm-1.
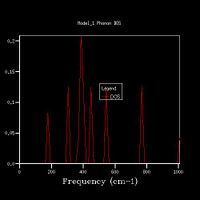
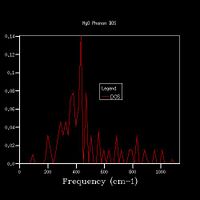
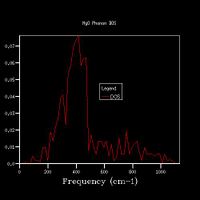
The DOS uses the data from the phonon dispersion to show how many states there are at each vibrational level. The more k-points there are for a vibrational level, the greater the number of phonon modes there are at that level, therefore the larger the intensity of the peak
 |
 |
 |
 |
 |
 |
 |
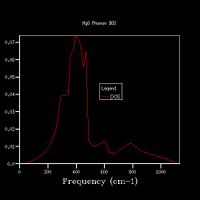 |
Increasing the grid size increases the resolution of the DOS, as can be seen in Fig 5., as there is a change from 4 individual peaks in the 1x1x1 grid to a continuous line with the peaks being much broader in the 32x32x32 grid, with initially the number of peaks increasing, these then joining to form a jagged continuous line, which the gets smoother as the grid size increases. The greatest number of states is at around 400 cm-1 for all grid sizes. While the zero-point energy converges at the 8x8x8 grid, the DOS continues to change with increased grid size, showing this is not the optimum grid size. There is still a slight change in the DOS from 25x25x25 to 32x32x32, however the change is minimal, showing that this is the optimum grid size, as larger grid sizes would not give a significantly higher resolution for the DOS and would take longer to compute. The shape of the DOS remains roughly the same beyond a grid size of 16x16x16, even though the resolution is still increasing with increasing grid size, suggesting the this is the minimum grid size needed to give a reasonable approximation of the DOS, as using a grid size below this does not give the clear shape of the DOS.
For a similar oxide such as CaO, a similar grid size would be appropriate, as the charge on the ions is the same and the ions are of similar size, therefore the size of a and therefore a* would be the same. A zeolite (a microporous aluminosilicate) however is much larger than MgO, and therefore has a larger value of a. As a*=2π/a, this results in a smaller value of a*, meaning that fewer k-points are needed to get the same amount of data, as more data points are gathered from one k-point, therefore a smaller grid size would be optimal. A metal would also have a smaller optimal grid size, as it is composed of cations in a sea of delocalised electrons, which shield the repulsion between the cations, so the energy states are less disperse, so fewer k-points are needed to provide sufficient information about the DOS.
Calculating the Free Energy in the Harmonic Approximation:
| Grid Size | Helmholtz Free Energy | Difference in free energy
with 32x32x32 grid size | ||
| kJ mol-1 | eV | kJ mol-1 | eV | |
| 1x1x1 | -3949.148006 | -40.930301 | -0.3684 | -0.00382 |
| 2x2x2 | -3948.79181 | -40.926609 | -0.01217 | -0.00013 |
| 4x4x4 | -3948.776419 | -40.92645 | 0.003222 | 3.3 x 10⁻⁵ |
| 8x8x8 | -3948.779123 | -40.926478 | 0.000518 | 5 x 10⁻⁶ |
| 16x16x16 | -3948.77958 | -40.926482 | 6.1 x 10⁻⁵ | 1 x 10⁻⁶ |
| 20x20x20 | -3948.779614 | -40.926483 | 2.7 x 10⁻⁵ | 0 |
| 32x32x32 | -3948.779641 | -40.926483 | 0 | 0 |
Table 1 shows that the Helmholtz free energy decreases with increasing grid size, with the decrease becoming smaller as the free energy converges. There is no change to the free energy shown in eV from grid size 20x20x20 to 32x32x32, although there is a small change to the free energy if calculated in kJ mol-1 . This suggests that a 20x20x20 grid size is the optimal balance between the accuracy and the time taken for the calculation to run. For an accuracy of 1 meV, a grid size of 4x4x4 is needed (with the free energy of -40926 meV for all subsequent grid sizes). For an accuracy of 0.5 meV, a grid size of 2x2x2 is needed, as this gives a free energy of 40926.5 meV , and for an accuracy of 0.1 meV, a 4x4x4 grid size is needed, giving a free energy of 40926.5 meV. As with using the DOS plot to find the optimal grid size, this grid size will be appropriate for CaO, but would be larger than necessary for a zeolite or metal.
The Thermal Expansion of MgO:
 |
 |
|---|
The graph of Helmholtz free energy against temperature shows an initial plateau up to 300 K before decreasing linearly above this temperature. This is because when the temperature is low, the zero-point energy dominates over temperature dependence, shown by the Helmholtz equation. As the temperature increases, the entropy term of the equation (-TS) increases, therefore the free energy becomes more negative.
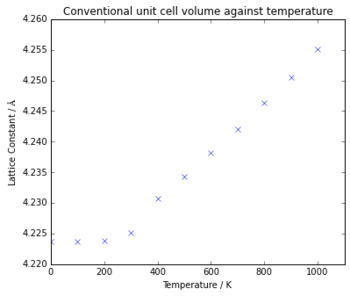
The lattice constant (Fig. 7) is the lattice parameter for the conventional unit cell, which is found using the relationship of Vc= 4Vp . The graph again shows a plateau at low temperatures, with the lattice constant then increasing linearly above 300 K. This is again because at low temperatures the zero-point energy limits the structure of MgO, with 4.224 Å being the minimum length of the structure. Above 300 K, as the temperature increases the vibrations of the structure increase, therefore increasing the lattice constant. For a diatomic molecule with an exact harmonic potential, the bond length would not increase, as there is no change in the equilibrium position as temperature is increased, however in the quasi-harmonic approximation, there are a series of harmonic potentials, each one with the equilibrium position at a slightly longer bond length, which allows for the bond length to increase with temperature with this model.
 |
|---|
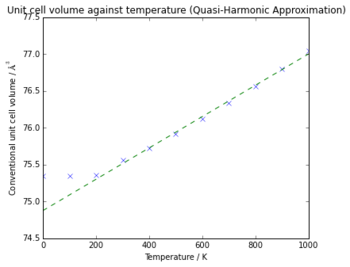
The effect of thermal expansion can be seen in Fig 8., with the volume of the unit cell increasing as the temperature increases, with the plateau at low temperatures being due to the zero-point energy as before. The volumetric thermal expansion coefficient can be found using Eq 1. by finding the gradient of the plot of conventional cell volume against temperature. The gradient found was 0.002127 Å3 K-1 , with the initial volume at 300 K of 75.35 Å3 giving a value of 2.822 x 10⁻⁵ K-1.
Molecular Dynamics:
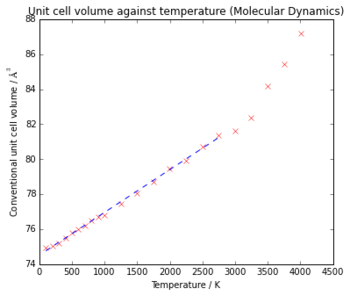
Fig 9. shows the thermal expansion of MgO using molecular dynamics to calculate the volume at each temperature. Using the linear portion of the graph, the thermal expansion coefficient can be found as before. A gradient of 0.00237 Å3 K-1 and an initial volume of 74.94 Å3 gives a value of 3.171 x10⁻⁵ K-1.
Comparing the values of α from both methods to the literatrure value of 3.15 x10⁻⁵ K-1 [1] (which has been converted from a linear thermal expansion coefficient by using the equation αL = 3αV ) shows that the result from Molecular Dynamics is a lot closer to the true value than from the Quasi-harmonic approximation, suggesting that this method is more accurate, only slightly overestimating it, while the Quasi - Harmonic approximation underestimates α by a significant amount. This could be because in this method the approximations that there is no anharmonicty, and that the vibrations of the atoms are well represented by the phonon modes do not result in an accurate value for the lattice parameters. The grid size used in the calculation may also need to be larger for a more accurate calculation.
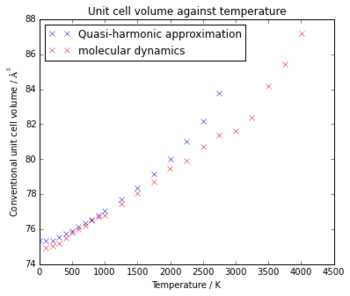
At low temperatures, the Quasi-harmonic approximation and
molecular dynamics give similar volumes, with the volume from molecular dynamics
being only slightly lower. However, at high temperatures there is a larger
difference, with the molecular dynamics values staying on a linear trend up
until around the melting point of MgO (3250 K [2]), while the Quasi-harmonic values
rise above this linear trend at atound 1500K. This is because as it nears the melting point of MgO the Quasi-Harmonic approximation is no longer valid, as
the bonds in the structure are breaking, rather than vibrating, so are not represented
by the phonon modes, while the molecular dynamics method accurately models the
thermal expansion until the bond breakage occurs.
In the molecular dynamics calculation a cell with 32 MgO units was used, which represents all of the vibrations from a grid size that’s around 3x3x3. This is used as a compromise between the accuracy of the calculation and it’s efficiency. However from the optimisation of the grid size using the free energy it was found that a 20x20x20 grid size was needed. This would suggest 8,000 MgO units would be necessary to perform reliable molecular dynamics for MgO, however this is not feasible to compute.
Conclusion
When calculating the phonon modes in the Quasi-harmonic approximation, it was found that a grid size of 20x20x20 was the optimum, giving a sufficient number of k-points to give a high enough resolution in the DOS, while not taking a long time for the calculation to finish.
From this investigation it can be seen that Molecular Dynamics, using the trajectories of the atoms to give an average volume, produces a more accurate thermal expansion coefficient, and is still accurate at higher temperatures, while the Quasi-harmonic approximation, using the phonon-modes of the material, is only valid at lower temperatures, relative to the melting point of the material. This suggests that Molecular Dynamics should be used to obtain the thermal expansion coefficient over the Quasi-Harmonic approximation, however the Quasi - Harmonic approximation takes less time to compute, and gives valuable information about the phonon modes.
References
- ↑ Touloukian Y. S (ed), Kirby R. K, Taylor R. E, Lee T. Y. R. Thermal Expansion—Nonmetallic Solids. Thermophysical Properties of Matter (Vol. 13) ,New York: IFI / Plenum, 1977; pp 288–301.
- ↑ Ronchi C, and Sheindlin M. Melting point of MgO. Journal of Applied Physics. 2001; 90(7): 3325. DOI: 10.1063/1.1398069
