Rep:LEM215MGO
Modelling the Lattice Dynamics of MgO by Computational Methods
Abstract
A simple crystal modelling atomic interactions was used to calculate the energy and vibrations of magnesium oxide by various computational GULP simulations. This report discusses the lattice dynamics of the most symmetrical type of bravais lattice, a cubic lattice, of MgO. The phonons (vibrational modes) of magnesium oxide were observed by analysis of computed phonon dispersion curves, density of states and finally by animation. GULP free energy mediated optimisation of the crystal structure was ran to compute the variation in the lattice free energies, lattice constant (a) and unit cell volume over a given temperature range (T=0-1000 K) within the quasi-harmonic approximation (QHA), and the coefficient of thermal expansion of MgO was predicted from the resulting data. The thermal expansion coefficient of MgO was then predicted by molecular dynamics simulations of a supercell and compared to that predicted by the quasi-harmonic approximation. It was determined that both models had limitations in their calculations; calculations within the QHA were valid for a low temperature range, T=0-300 K wheres the calculations using molecular dynamics (MD) provided the best prediction of the cell parameters and thermal expansion of MgO at a higher temperature range, T=300-2500 K.
Introduction and Theory
Crystal Structure of Magnesium Oxide
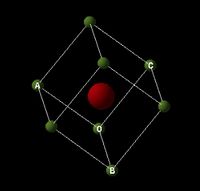
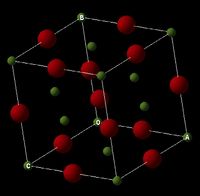
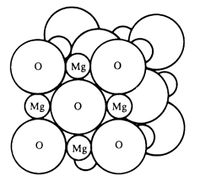
Under normal conditions magnesium oxide crystallizes to form a cubic close-packed (ccp) [1] lattice structure, like that of sodium chloride, with a 6-fold coordination (6:6). This type of crystal is often referred to as the ‘rock salt’ structure; the atoms are located on the apices and in the centre of each cubic face. Due to electro-neutrality requirements [2] the total number of atoms per cell unit (primitive cell, depicted in figure 1) is equal to 2. The bonding between the atoms is ionic and the size of oxygen is comparatively larger than that of the magnesium ions, this is represented by figure 3 [3].
Theory of Lattice Dynamics
Principles of Crystal Lattices: Real space and reciprocal space
A crystal is described by a bravais lattice, an array of ‘points’ characterized by a translation vector [4]. Computational programs such as GULP act as Fourier Transforms by receiving an input containing all information defining a crystal lattice. GULP coverts the cell vectors from three-dimensional real space into the vectors that make up a reciprocal lattice [5] in one-dimensional k-space. The k-space is composed of three-dimensional k vectors. The symmetries of a real space lattice and reciprocal space lattice are interrelated. The unit vectors of a real crystal lattice, a, are related to a periodic structure known as the reciprocal lattice which have dimensions of inverse length. In the study of lattice dynamics the reciprocal space is the continuum of all possible wave vectors (vibrations) [6]. Each vibration in the crystal lattice has a corresponding k vector that contains information about the vibrational wavelength and direction.
In a uniformly spaced lattice the spacing difference can be defined as ‘a’. k can be represented as a wave vector, whereby the wavelength of one vibration is equal to 2a. Therefore the k-value for one complete wavelength becomes k=2π/a [7].
Lattice vibrations
The theory of lattice dynamics (lattice vibrations) of a three-dimensional crystal assumes an infinitely extended crystal. The motion of a lattice was described by Born [8] as a series of collective motions in the form of travelling waves (lattice vibrations) characterized by a frequency, wave vector (k) and amplitude. The wave equation [9] (eq1):

Phonons
A ‘phonon’ is a quantized lattice vibration that has particle-wave like properties [10] therefore analogous with the photon. The idea of an infinite crystal results in infinite values for several properties like the volume. Such quantities should therefore be normalized to a finite value to simplify calculations of various physical properties of the crystal without affecting the bulk properties. This is achieved through the use of periodic boundary conditions [11] and was first introduced by Born and Von Karman. The Born-von Karman boundary conditions assume only the nearest neighbor forces are important; the lattice wave with a wavelength twice the interatomic distance, 2a, is incident to the Brillouin zone and is reflected back at the boundary thus becomes a standing wave [12] (this seen as the back ‘folding’ of the periodic wave in the phonon dispersion).
They suggested that the atoms vibrate harmonically about their equilibrium positions and so the normal modes associated with each atom arranged in a periodic three-dimensional chain have the energy of a Planck oscillator (harmonic) [11].
Phonon Dispersion Curves
In a three-dimensional crystal the displacements of atoms can be longitudinal or transverse (perpendicular directions) vibrations; this can be depicted as shown in figure 4 [9].

Summing over all k-space values represents the total number of vibrational modes in the crystal. The frequency and wave vector of a vibration are related, this is known as the dispersion relation [13]. For a one-dimensional alternating array of two types of atoms (or ions) of masses m1 and m2 two modes of vibration result [13] (eq 2):

A plot of the dispersion relation (wave vector against frequency) represents the two types of phonons, acoustic and optical, by different branches. The acoustic modes are always lower in energy than optical modes and correspond to vibrations where neighboring atoms of different types essentially vibrate in the same direction with periodically changing amplitude [14]; the atoms are largely vibrating 'in-phase’ with one another. Whereas optical modes correspond to vibrations whereby the adjacent atoms move in opposite directions, thus are high in energy; the atoms vibrate 'out-of-phase'. The boundary at -π/a to π/a is known as the first Brillouin zone [13] and is the range of unique k-values in the model of the crystal lattice - represents the central primitive cell in momentum space and therefore allow an infinite lattice to be represented by a finite space (ease of calculations). Solutions for any k are invariant with respect to a change in the sign of k, so phonon dispersion curves often appear near centro-symmetric.
Phonon Density of States
The phonon density of states describes the number of vibrational modes occupied at each frequency by averaging over all k-points. It can be represented mathematically as an average over space and time of the various states available to the system i.e. averages over all k-points within the reciprocal lattice. The density of states is plotted against frequency or energy and thus can be correlated and compared directly to the dispersion relation curve.
Computational Experiments
Phonon modes of MgO
Phonon Dispersion
GULP ‘execute’ was used to compute the phonons of an MgO primitive cell over 50 k-points and the corresponding dispersion curve was generated. In a three-dimensional crystal there will be three acoustic modes; one longitudinal and two transverse branches [15]. For N atoms per lattice point there are 3(m-1) optical branches [15]. So for an MgO crystal where there are two atoms per lattice point we expect there to be three optical branches; two transverse and one longitudinal phonon modes. These three branches are high frequency as they can interact with electromagnetic waves more easily [15].
The computed phonon dispersion shows the six expected phonon branches. There is a convergence of the acoustic branches to 0 cm-1 at the origin, Γ (point of lowest frequency thus an all in phase normal mode), whereas the optical branches do not converge at the origin.
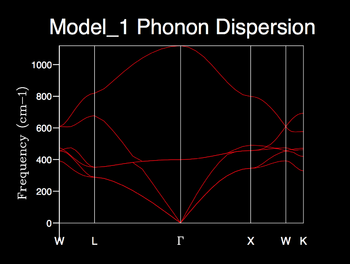
The marked k-values correspond to points of high-symmetry; W, L, Γ, x, W, K.
It can be seen that in the high-symmetry direction, as k approaches the origin, a pair of acoustic branches and a pair of optical branches coincide suggesting that these two sets of branches become degenerate. For acoustic branches the changes in frequency with wave vector is linear for small displacements about the origin. This confirms theory which suggests that at the long-wavelength limit, (qa -> 0), frequency is proportional to k [16]. The branches curve with increasing wave vector as we expect, by derivation from eq 2, that δω/δk = 0 at the Brillouin zone boundary π/a [17].
Phonon Density of States
In solids the energy levels are said to be ‘quasi-continuous’ due to the continuous variation with the wave vector [15]. The density of states can directly describe the energy/frequency degeneracy of the normal modes in the MgO crystal lattice. The shrinking factor used for phonon DOS calculations determines the grid of k-space values over which the density of states average is taken from.
The 1x1x1 shrink factor corresponds to a single k-point and the resulting phonon DOS produces 4 distinct peaks. The height of the first two peaks are double that of the latter two. It can be deduced that the associated phonon mode consists of two sets of doubly degenerate branches and two distinct branches (totaling to the expected 6 branches). By direct comparison of the branch frequencies/degeneracies to that in the log file of the dispersion curve it can be concluded that this phonon mode corresponds to the L-symmetry point in reciprocal space. It is clear that this shrinking factor is not adequate for the phonon DOS calculation.
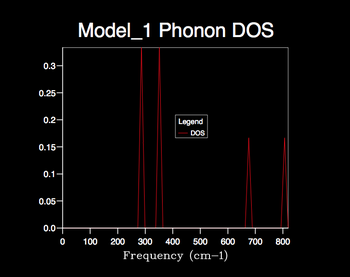
Increasing the shrink factor from 1x1x1 grid results in a denser grid of k-values and thus the phonon DOS calculated is more resolved, providing a better representation of the true degeneracy of states. Therefore the larger the shrinking factor the more accurate the phonon DOS calculated, however this is at the cost of computational time; a compromise must be made. The optimum grid size can be determined by the minimum shrinking factor at which the phonon DOS curve converges. From the calculated DOS plots it is clear that the phonon DOS curve convergence first appears using the 24x24x24 grid size and hence seems the most appropriate factor to use for later calculations; optimal information is provided with efficient computing time. Little change is seen when increasing the 24x24x24 grid size to 32x32x32 etc. apart from a slight smoothing of the curve; the larger computational time can not justified by a significant improvement in the accuracy of the DOS calculation.
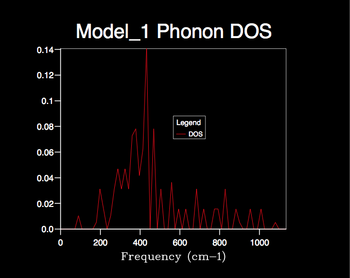
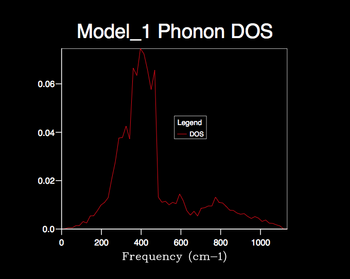
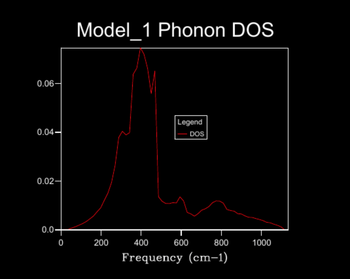
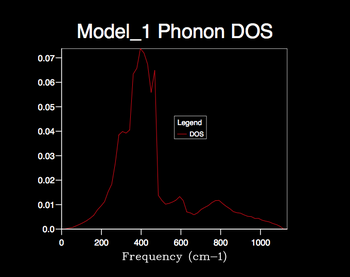
The appropriate shrinking factor varies for different types of crystal lattices. Therefore for lattice types similar to MgO, such as CaO, the same shrinking factor can be applied whereas for more complex lattice types, such as the zeolite Faujasite, a smaller factor must be used to achieve an efficient computational time. For much simpler lattice types, such as that displayed by a monatomic metal e.g. lithium (simple cubic), a larger shrinking factor can be used.
Computing the Free Energy within the Quasi-Harmonic Approximation
Theory of the Harmonic and Quasi-Harmonic Approximations
The harmonic approximation models the interatomic forces as purely harmonic, as a result the mean positions of atoms in a crystal do not change with increasing temperature even though the amplitude of the vibrations increase. Thus the harmonic approximation fails to predict a thermal expansion [18]. This is overcome through an extension of this model known as the quasi-harmonic approximation.
The quasi-harmonic approximation (QHA) is a phonon-based model that considers the volume-dependence of frequencies within the harmonic approximation and hence accounts for thermal expansive effects in crystals [19]. The total vibrational energy of an oscillator of each normal mode is given by [20]:

The existence of the zero-point energy, 1/2ℏω, in this equation is required as a result of the Heisenberg uncertainty principle [21].
The QHA treats phonons as independent and thus neglects the higher order or anharmonic terms of the potential energy expansion which give rise to phonon-phonon interactions and subsequent shifting of the phonon frequencies [19].
Within the QHA the Helmholtz free energy, which is based on the static lattice energy and classical vibrational frequencies populated in correspondence to quantum statistics and thus integrated over the Brillouin zone, is given by [22] (eq3):

The first term corresponds to the internal energy contribution, second is the zero point energy contribution and third is the vibrational contribution (eq4):

GULP Computation of Free Energy
The Helmholtz free energy was calculated within the Quasi-Harmonic approximation by a GULP free energy computation at a fixed temperature (T=300K) and pressure (P=0Ga). The computed free energies were plotted against a range of shrinking factors within python.

As the dimensions of the shrinking factor increased the calculated Helmholtz Free Energy initially increased linearly, from 1x1x1, before completely plateauing at a free energy of -40.926483 eV using a 24x24x24 shrinking factor. As the shrinking factor increases a larger number of vibrational modes are sampled and the calculated entropy approaches the true entropy of the system (as each phonon contributes to the entropy) thus resulting in the plateau of the free energy.This data further confirms the minimum shrink factor required for adequate and efficient GULP calculations of the phonon DOS and thermodynamic parameters of the MgO crystal corresponds to the use of a 24x24x24 grid size.
For a lower resolutions the following shrinking factors may be used:
- Accurate to 1 meV: 3x3x3
- Accurate to 0.5 meV: 4x4x4
- Accurate to 0.1 meV: 5x5x5
The Thermal Expansion of MgO
Within the Quasi-Harmonic Approximation
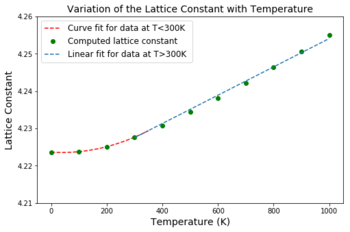
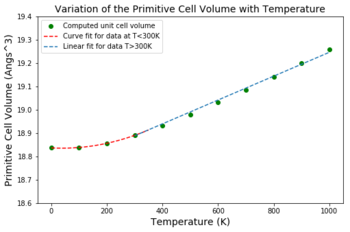
The MgO crystal structure, using the primitive cell, was optimized with respect to the Gibbs free energy for a range of temperatures between 0-1000K at increments of 100K within the QHA using the chosen optimum shrinking factor; 24x24x24. The computed isochoric Helmholtz free energies (kjmol-1), lattice constants and unit cell volumes (Å3) were plotted against temperature.

(1) Figure 12: Variation of the isochoric Helmholtz free energy with temperature
The free energy decreases non-linearly with temperature. This can be attributed to the non-linearity of entropic contribution to the Helmholtz free energy as a function of temperature, A = U - TS. The phonon entropy contribution within the QHA is given by [23] (eq5):

As temperature increases the entropic contribution becomes more significant and thus the gradient of the curve becomes steeper. The decreasing free energy reflects the decreasing stability of the MgO crystal lattice (solid) as the temperature approaches the melting point of the crystal.
(2) Figures 13 and 14: Variation of the isochoric lattice parameter and unit cell volume with temperature
The lattice parameter was derived directly from the unit cell volume by taking the cube root of each volume at each temperature. Thus the same trend is expected in both plots as the lattice parameter and corresponding unit cell volumes are directly proportional.
Initially the unit cell volume increases quadratically up to T=300 K then the increase becomes linear.
The QHA assumes the harmonic approximation is valid for each volume of the crystal but also assumes the frequency of vibrations depend on the volume. As discussed earlier the QHA takes into account the quantum mechanical zero-point energy and so at low temperatures this is the main contributor to the unit cell volume of the MgO crystal.
At low temperatures the amplitudes of the vibrations of atoms are significantly smaller than the interatomic separations [24]. As a result the dependence of the ground state energy (corresponding to the zero-point) on the deviation from the equilibrium atomic positions is quadratic [24] and hence relates to the parabolic minimum of Lennard-Jones potential well.
The observed linearity when T>300 K suggests that the variation in the unit cell volume becomes proportional to the changes in temperature, which is in agreement with the thermodynamic definition of the isobaric volumetric thermal expansion coefficient, defined by the Maxwell relation [25] (eq6):

The volumetric thermal expansion coefficient is three times larger than the linear thermal expansion coefficient, which is a one-dimensional property.
Using eq6 the coefficient of thermal expansion for MgO was computed from the linear region of the curve as this set of data corresponds to the point at which the vibrational contribution to the changes in unit cell volume is significant, and so the thermal expansion can be modeled correctly by the QHA.
Computed value within QHA: 2.9285e-05 K-1 at 300 K
Experimental value from x-ray diffraction [26]: 3.06e-05 K-1 at 300 K
The computed value and experimental value taken from literature are quoted for the same initial temperature and so can be directly compared. There is little discrepancy between the two thermal expansion coefficients which suggests the QHA is adequate at modelling the thermal expansive properties over the temperature domain, T=0-1000 K.
However, it is expected that for temperatures above 1000 K the QHA begins to deviate from the linear trend seen in experimental data [27], and a progressive divergence occurs as the temperature is further increased. This can be attributed to the neglection of anharmonicity (phonon-phonon interactions) and bond dissociation within the QHA. These two effects become more significant at higher temperatures [22] so the phonon modes cannot be accurately simulated as the melting point of the MgO crystal is approached.
Molecular Dynamics
In molecular dynamics (MD) the Newtonian equations of motion of a set of N particles in a given volume V are solved mathematically and thus provides a description of the interactions within a system, such as the MgO crystal, over a given time frame [28]. The MD simulation must be carried out for long enough to ensure full equilibration of the crystal structure and time averages of the simulated model are computed. The equilibration can be observed as fluctuations in the cell parameters in the computed log file as GULP performs the MD simulation.
Molecular dynamics simulations were performed on an MgO supercell consisting of 32 primitive cells. To sample the same number of k-space values for a supercell, as the primitive cell, only ¼ of the reciprocal space is required and so a 4-factor smaller grid size can be used for the molecular dynamic simulation to obtain adequate results. (Due to the inverse relationship between the real lattice unit, a, and the reciprocal lattice unit a*: ᴨ/a = a*). Using the primitive cell for MD simulations would prove useless, as it would predict an all in-phase motion of the unit cells within the crystal lattice - not a true representative of the infinite MgO crystal.
In this simulation the zero pressure method (ZP) was used. The molecular dynamics carry out simulations using periodic boundary conditions within the NPT ensemble at zero-pressure.


The variation of the unit cell volume with temperature computed using MD simulations produced a strong linear regression. Therefore the same equation (eq6) can be used to calculate the isobaric volumetric thermal expansion coefficient:
Computed value using molecular dynamics: 3.1603e-05 K-1 at 300 K
This computed coefficient is closer to the experimental value suggesting the MD method is more accurate in the determination of the thermal expansive properties of MgO over the temperature range 300-2500 K than predictions within QHA.
At low temperatures the MD predicts a smaller unit cell volume than expected as it is based on classical nuclear motion thus doesn’t take into account the quantum-mechanical zero-point effects [24]. By extrapolating the linear fit of the MD computed data to T=0 K, the effect of the neglection of the zero-point energy becomes obvious by comparing the difference in the unit cell volumes predicted within QHA and MD at temperatures below 300 K.
Molecular dynamics gives information about the time-dependence and magnitudes of variations of the atomic positions and momentum variables, which stray away from their equilibrium values. The vibrations modelled by MD are not confined to harmonic motion and as a result take into account a degree of anharmonicity at higher temperatures [29]. This indicates that MD methods provide the best prediction for the thermal expansivity of MgO (and other crystals) at higher temperature ranges. However, above the mp of MgO (3098.15 K [30]) the MD computed data will not correctly predict the unit cell volume as a function of temperature as it does not take into account the bond dissociation energy and hence the phase transition. The melting of the crystal will have a significant impact on the physical properties.
Conclusion
By comparison to experimental data it is clear that the QHA is valid for a low temperature domain (T=0-300 K) as the neglection of phonon-phonon interactions is not significant. There is potential for the QHA model to be optimized through the use of anharmonic corrections to account for these interactions at higher temperatures. This could be achieved by including higher order terms i.e. the cubic and quartic contributions to the potential energy in the Taylor expansion accounting for the reduced lifetimes of phonons, and the relevant temperature changes that may not ‘quasiharmonically’ depend on the volume of the crystal.
On the contrary the MD simulations provide a more accurate prediction of the thermal expansivity of MgO over a higher temperature domain (T=300-2500 K). At lower temperatures the computed thermal expansion coefficient of MgO was predicted to decrease too sharply with decreasing temperature relative to experimental data. This suggests the need for the inclusion of higher‐order quantum correction terms at low temperatures to provide a more accurate description of the lattice dynamics.
Generally both methods predict the thermal expansion of MgO relatively accurately as there is little discrepancy from experimental data, although both fail to predict the thermal expansion near to or above the melting point of MgO due to the neglection of the bond dissociation energy which results in the eventual breakdown of the crystal lattice.
References:
- ↑ Magnesium oxide (MgO) crystal structure, lattice parameters, thermal expansion. (n.d.). II-VI and I-VII Compounds; Semimagnetic Compounds, pp.1-6.
- ↑ Carter, C. and Norton, M. (2013). Ceramic Materials: Science and Engineering. New York, NY: Springer, pp.54-55.
- ↑ Bolton, W. (1993). Engineering materials technology. 2nd ed. Elsevier, p.83.
- ↑ Grahn, H. (1999). Introduction to semiconductor physics. Singapore: World Scientific, p.7.
- ↑ Gale, J. and Rohl, A. (2017). The General Utility Lattice Program (GULP).
- ↑ M. Kosevich, A. (2005). The Crystal Lattice: Phonons, Solitons, Dislocations, Superlattices. 2nd ed. Kharkov: Wiley-VCH, pp.7-8.
- ↑ Prof. Nicholas Harrison. Lecture 4: Vibrations in Crystals. Imperial College London
- ↑ Joshi, S. and Rajagopal, A. (1968). Solid State Physics: Advances in Research and Applications. New York and London: Academic Press, p.160.
- ↑ 9.0 9.1 Dove, M. (1993). Introduction to lattice dynamics. Cambridge: Cambridge University Press, pp.14, 15.
- ↑ Lou, L. (2003). Introduction to Phonons and Electrons. Singapore: World Scientific Publishing Company, pp.89-90.
- ↑ 11.0 11.1 Brüesch, P. (1982). Phonons: Theory and Experiments I. Berlin, Heidelberg: Springer Berlin Heidelberg, pp.5, 55.
- ↑ Srivastava, G. (1990). The Physics of Phonons. 1st ed. CRC Press, p25-27, 361
- ↑ 13.0 13.1 13.2 Misra, P. (2012). Physics of condensed matter. Burlington, Mass: Academic Press, p.44.
- ↑ Simmons, J. and Potter, K. (2000). Optical materials. San Diego: Academic Press, pp.32-33.
- ↑ 15.0 15.1 15.2 15.3 Chen, G. (2005). Nanoscale energy transport and conversion. New York: Oxford University Press, pp.104-105, p106
- ↑ Srivastava, G. (1990). The Physics of Phonons. 1st ed. CRC Press, p25-27, 361
- ↑ Dove, M. (1993). Introduction to lattice dynamics. 1st ed. Cambridge: Cambridge University Press, pp.38-48.
- ↑ Sharma, S.S. Proc. Indian Acad. Sci. (Math. Sci.) (1950) 32: 268. https://doi.org/10.1007/BF03170830
- ↑ 19.0 19.1 Ishikawa, K. (1967). On the Quasi-Harmonic Theory of Phonons. physica status solidi (b), 21(1), p.137. doi: 10.1002/pssb.19670210111
- ↑ Li, S. (2006). Semiconductor Physical Electronics. 2nd ed. New York, NY: Springer Science+Business Media, LLC, p.36.
- ↑ Lou, L. (2003). Introduction to phonons and electrons. River Edge, NJ [u.a.]: World Scientific, p.90.
- ↑ 22.0 22.1 Calculating the anharmonic free energy from first principles. Physical Review B, 81(17).
- ↑ Terasaki, H. and Fischer, R. (2016). Deep Earth: Physics and Chemistry of the Lower Mantle and Core. 1st ed. Washington, D.C: American Geophysical Union and John Wiley & Sons, Inc, p.15. ISBN: 978-1-118-99247-0
- ↑ 24.0 24.1 24.2 Baroni, S., Giannozzi, P. and Isaev, E. (2010). Density-Functional Perturbation Theory for Quasi-Harmonic Calculations. Reviews in Mineralogy and Geochemistry, 71(1), pp.39-57. Doi: 10.2138/rmg.2010.71.3.
- ↑ Barron, T. and White, G. (1999). Heat Capacity and Thermal Expansion at Low Temperatures. 1st ed. Boston, MA: Springer US, p.14.
- ↑ Reeber, R. R.; Goessel, K.; Wang, K. Eur. J. Mineral. 1995, 7, 1039–1047. Doi: DOI: 10.1007/s002690050070.
- ↑ Erba, A., Shahrokhi, M., Moradian, R. and Dovesi, R. (2015). On how differently the quasi-harmonic approximation works for two isostructural crystals: Thermal properties of periclase and lime. The Journal of Chemical Physics, 142(4), p.044114. DOI: 10.1063/1.4906422.
- ↑ Muniz, A., Guarnetti, L. and Fonseca, A. (2015). Determination of the Thermal Expansion Coefficient of Nanostructured Materials Using Molecular Dynamics. Anais do XX Congresso Brasileiro de Engenharia Química, pp.1-3. Doi: 10.5151/chemeng-cobeq2014-1004-21752-154937.
- ↑ Andersen, H. (1980). Molecular dynamics simulations at constant pressure and/or temperature. The Journal of Chemical Physics, 72(4), pp.2384-2393. Doi: 10.1063/1.439486.
- ↑ Haynes, W.M. (ed.) CRC Handbook of Chemistry and Physics. 91st ed. Boca Raton, FL: CRC Press Inc., 2010-2011, p. 4-74. ISBN 978–1439820773.
