Rep:Kh1015TSEx1RD
Exercise 1 Results and Discussion.
(Fv611 (talk) Wonderful section. Well written and a lot of extra effort put into it. Well done!)
Note to Reader/Marker:
The compartmentalization of the Results and Discussion into 3 parts was based on relevant discussion idea and for convenient navigation during the write-up.
Part 1: Symmetry Discussion.
Figure 4.1 under Methodology section shows the reaction scheme for Exercise 1.
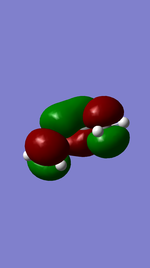
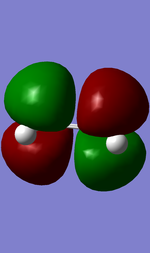
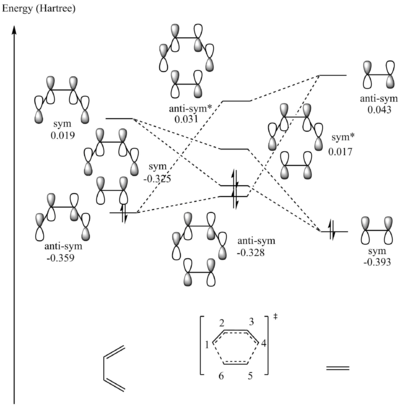
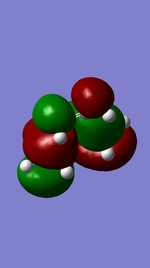
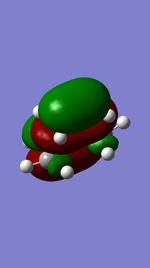
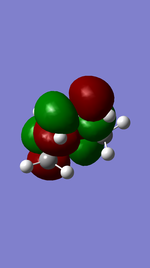
Figure 5.1.5 shows the graphical representation of MO interactions between s-cis butadiene and ethene during the formation of the TS. Figures 5.1.1-5.1.4 and 5.1.6-5.1.9 show the visualized MO output from GaussView (isovalue=0.02 and medium cube grid). Table 5.1.1 summarizes the MO interactions to form the TS in terms of the label of the constituent MOs in Gaussview outputs.
It can be concluded that the symmetry requirement of an allowed reaction is strictly when the constituent MOs have the same symmetry. Consequently, symmetrical-symmetrical or antisymmetrical-antisymmetrical interaction has a non-zero orbital overlap integral. Meanwhile, non-symmetrical interactions of the constituent MOs are symmetry-forbidden. Conversely, symmetrical-antisymmetrical or antisymmetrical-symmetrical interaction has a zero orbital overlap integral.
| TS Symmetry Label (in Increasing Energy Level) | Constituent Fragment Orbital Interactions (S-Cis Butadiene - Ethene) |
| Anti-Symmetrical | MO12-MO6 (Bonding) |
| Symmetrical | MO11-MO7 (Bonding) |
| Symmetrical* | MO12-MO6 (Anti-Bonding) |
| Anti-Symmetrical* | MO11-MO7 (Anti-Bonding) |
 |
 |
 |
 |
 | |||
 |
 |
 |
 |
Part 2: C-C Bond Length Evolution.
Note: The carbon labels are based on the TS labels in Figure 5.1.5.
Referring to table 5.1.2, as the reaction progressed from reactants to product at rtp, {C1-C2, C3-C4, C5-C6} bond lengths (in Å) increased from {1.33343, 1.33343, 1.32726} to {1.37977, 1.37979, 1.38177} to {1.50084, 1.50083, 1.53457}. At the same time, the {C2-C3, C4-C5, C1-C6} bond lengths (in Å) decreased from {1.47078, NA, NA} to {1.41110, 2.11469, 2.11479} to {1.33704, 1.53714, 1.53721}. The change in bond lengths were due to change in hybridization or change in bond order or both.
| State | C-C Bond Length (Å) | |||||
| C1-C2 | C2-C3 | C3-C4 | C4-C5 | C5-C6 | C1-C6 | |
| S-Cis Butadiene | 1.33343 | 1.47078 | 1.33343 | NA | NA | NA |
| Hybridization | sp2-sp2 Double Bond | sp2-sp2 Single Bond | sp2-sp2 Double Bond | NA | NA | NA |
| Ethene | NA | NA | NA | NA | 1.32726 | NA |
| Hybridization | NA | NA | NA | NA | sp2-sp2 Double Bond | NA |
| TS | 1.37977 | 1.41110 | 1.37979 | 2.11469 | 1.38177 | 2.11479 |
| Hybridization | Not clear | Not clear | Not clear | Not clear | Not clear | Not clear |
| Product | 1.50084 | 1.33704 | 1.50083 | 1.53714 | 1.53457 | 1.53721 |
| Hybridization | sp3-sp2 Single Bond | sp2-sp2 Double Bond | sp2-sp3 Single Bond | sp3-sp3 Single Bond | sp3-sp3 Single Bond | sp3-sp3 Single Bond |
Table 5.1.3 shows typical sp3 and sp2 C-C bond lengths in organic compounds at rtp. The calculated values at PM6 level show good agreement with literature values at rtp in table 5.1.3 with less than 1% difference for any given C-C bond length [1].
The average value of Van der Waals radius of C atom in literature is 1.88 [2]. The calculated distance between the centres of two C atoms of the two fragments in the TS (about 2.115 Å) is less than the sum of their Van der Waals radii (3.76 Å). This suggests presence of partly-formed C-C bond in the TS.
| Hybridization | sp3-sp3 Single Bond | sp3-sp2 Single Bond | sp2-sp2 Double Bond |
| C-C Bond Length (in Å) | 1.54 | 1.50 | 1.47 |
Part 3: IRC and Animated Vibrations.
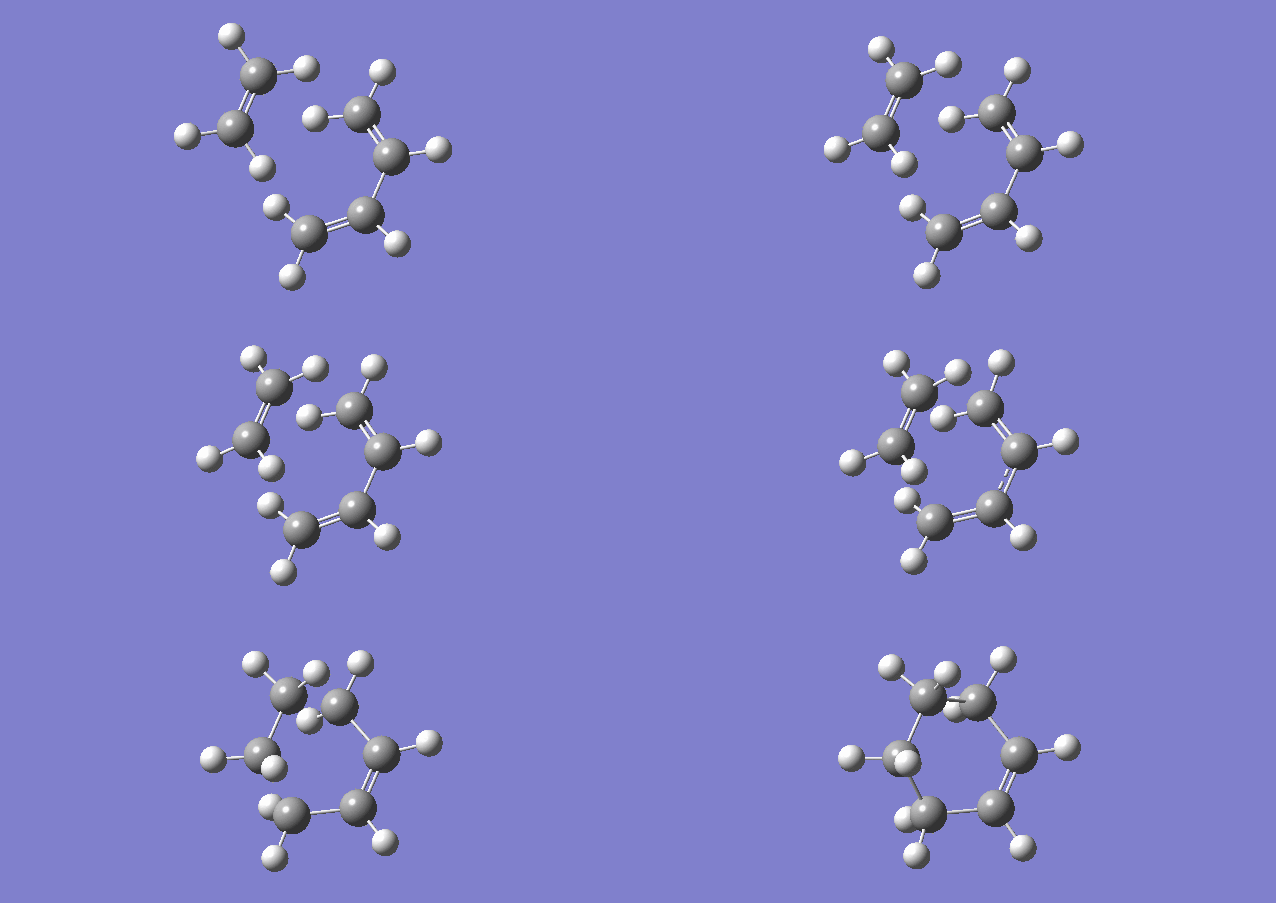
Referring to Figure 5.1.10, the IRC calculation at PM6 level showed that the two C-C sigma bonds were formed in a synchronous fashion in a concerted mechanism and that the TS had been optimized.
The calculated reaction profile at PM6 suggested that the reaction was spontaneous at 298.15 K and 1 atm. The activation energy was calculated to be 171 kJ mol-1 and Δ Gibbs-Free Energy was calculated to be -122 kJ mol-1 at 298.15 K and 1 atm, which means that there is a very high reaction barrier to be overcome before the reaction could proceed.
 |
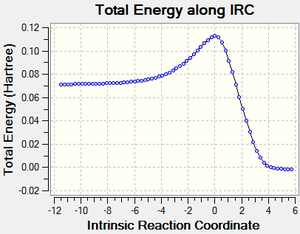 |
Figure 5.1.12 shows the HOMO of the TS system by default (MO 17). It is possible to right-click on the Jmol and choose any MO of interest.
Figure 5.1.13 shows non-covalent interactions at the TS (Red being non-favourable interaction and Blue being favourable interaction). There was no significant non-favourable steric clash in the reaction, which meant that steric clash was not a factor contributing to the high activation barrier.
|
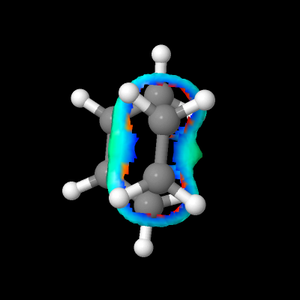 |
Figure 5.1.14 shows an interactive vibration animation of the TS (calculation at PM6 level).
Figure 5.1.14: Interactive Vibration Animation of the TS (PM6 Method). |
