Rep:Kh1015MgO
Aim:
Using Quasi-Harmonic Approximation and Molecular Dynamics to predict the expansion behavior of Magnesium Oxide when heated and calculating the corresponding thermal expansion coefficient ().
Abstract:
Isobaric thermal expansion coefficient for MgO was calculated using General Utility Lattice Program (GULP). The calculation assumes simple Buckingham potential and includes two different methods: Quasi-Harmonic Approximation method (QHM) or Lattice Dynamics (LD) and the Molecular Dynamics method (MD). In LD, the calculation was conducted from 0 - 2,750 K at 0 GPa and thermal expansion coefficient was calculated to be 3.340 x 10⁻⁵ K-1, applicable for 700-1,500 K, 0 GPa for comparison with MD. In the MD, the calculation was conducted from 25 - 7,000 K at 0 GPa and thermal expansion coefficient was calculated to be 3.660 x 10⁻⁵ K-1, applicable for 700-1,500 K, 0 GPa. The thermal expansion coefficient from MD is closer to the experimental results by Suzuki(1975) [1] over similar temperature and pressure condition than LD. Single-volume comparison at 300 K, 0 GPa between LD, MD and results by Suzuki(1975) [1] also highlights that MD prediction of the real MgO volume is superior than LD. Also, the boiling temperature of MgO at 0 GPa is calculated to be within 3,500 - 3,750 K.
Introduction:
Thermal expansion is an important parameter to understand residual stresses in composites and superlattices. It can also be used to model the state of matter beneath the earth's crust. Periclase (MgO) has been extensively used as the basis of the simulation due to its abundance in the Earth's mantle. [2]
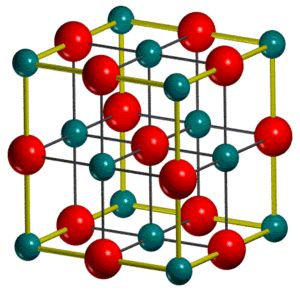
In the conventional cell, MgO has a face-centred cubic structure, which can be described using only one lattice parameter (afcc).
 |
In the primitive cell, MgO is described as a rhombohedron, which can be described using two lattice parameters (arh and = 600).
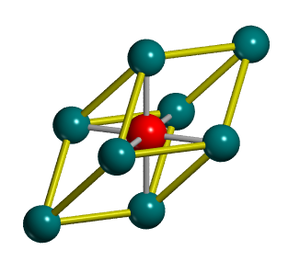 |
In this simulation, there are two types of MgO model used: the primitive cell (1 Mg and 1 O ions, rhombohedron) and the supercell, which has twice the lattice parameter of the former (32 Mg and 32 O ions, face-centred cubic). The former was used for the Quasi-Harmonic Approximation where the atoms occupy the lattice points (Lattice Dynamics) and the latter was used for Molecular Dynamics. Upon varying internal energy of system with the lattice size, sufficient convergence of internal energy was achieved for further simulation after the 64 atoms model was used.
Vibrations, discuss the concept of phonons.
The different vibrational modes of particles in the Bravais lattice form different waves or phonons. When Fourier transformation is applied onto the wave equation, each phonon is converted to its corresponding k point (wavevector) in the reciprocal space. Each k point in the space is related to the original wave via the following relationship:
---(Equation 1)
,where k is wavevector (cm-1) and λ is wavelength of the phonon (cm).
The dispersion relation of the frequency (ω) of the vibration is described by a periodic function in the reciprocal space:
---(Equation 2)
,where J is the elastic constant of spring (proportional to the electrostatic potential), M is the reduced mass of the atoms and a is the lattice parameter.
Due to periodicity, the frequency possesses unique solutions when the k point is within - ≤ k< , whereby a is the lattice parameter. This region is defined as the first Brillouin zone.
Thermal Expansion Coefficient
Thermal expansion coefficient () describes how a material expands when it is heated. It is described by:
---(Equation 3)
, where V0 refers to the optimized volume of the lattice at the lowest temperature in the applicable temperature range, V is optimized volume of the lattice at different temperatures and T is the temperature at which the calculation is carried out.
From literature, it is noted that the thermal expansion coefficient varies with temperature and pressure, as validated by both simulations and experimentation in laboratory.[1] [5][6] Hence, to compare between results of thermal expansion coefficient or to use the coefficient to predict expansion behavior, it is necessary to check the range of temperatures and pressure for which the specific thermal expansion coefficient is applicable to.
Quasi-Harmonic Approximation or Phonon Theory (F= E(V)-TS)
In the Harmonic Approximation, the bond between atoms can be viewed as a spring that obeys Hook's Law.
F=k.x ---(Equation 4)
, where F is Force (N), k is the spring constant (N/Angstrom) and x is the displacement of the atoms from the equilibrium separation (Angstrom).
When the MgO system experiences thermal expansion, there would be an increase in the volume of the system and therefore, the equilibrium separation of neighbouring atoms. Hence, quasi harmonic treatment is used to account for the lattice thermal expansion.[5]
In the quasi-harmonic model, the calculation attempts to minimize the Helmholtz Free Energy (F) as the calculation was carried at a constant pressure (0 GPa). It is given by:
---(Equation 5)
, where E0 is the lattice energy, is the frequency of vibration, T is temperature and S is the entropy.
The second term of the Helmholtz Free Energy is essentially the zero-point energy of the system.
Molecular Dynamics (Newtonian Approach)[7]
In a classical equation, a motion can be described by:
---(Equation 6)
, where F is the force, m is the mass of the object and a is the acceleration of the object.
The potential energy of the motion can also be described by:
---(Equation 7)
, where U is the potential energy of the object and x is the displacement of the object from equilibrium position as a result of non-bonded interaction with the atoms of its neighbours (direct or distant).
The calculation first computes the forces on the atoms (F) and accelerations (a). It would then update the velocity and position of atoms at , where is the time step (which was 0.00500 ps in the calculation). Ideally, the calculation is repeated for a certain number of equilibration step until the average total energy and volume have stabilized. After that, the calculation is repeated for a certain number of production step to export as output of the calculation.
Methodology:
All the calculations were done using General Utility Lattice Program (GULP) method and displayed in DL Visualize. The calculations assume Buckingham potential (also known as Exponential-6 potential) that operates between the ions. Buckingham potential was used because it has been optimized for ionic materials[8] and was determined to be more stable than the generic Lennard-Jones Potential.[9][10] For all calculations, the GULP potential used was ionic.lib and atomic shells were not considered in the calculation.
There are two models used in the calculation: MgO.str and MgO32.str. The MgO.str was a primitive unit cell (1 Mg and 1 O atoms). Its structure was a rhombohedron. The MgO32.str was a supercell (32 Mg and 32 O atoms). Its structure was a face-centred cubic.
1. Initial Calculation of MgO to determine Lattice Parameter and Energy
The model used was MgO.str. The calculation was carried out at 0 K and 0 GPa. The optimized output showed that the lattice energy was -41.075 eV or -3.963 kJ/mol unit cells.
2. Calculating Phonon Modes for MgO
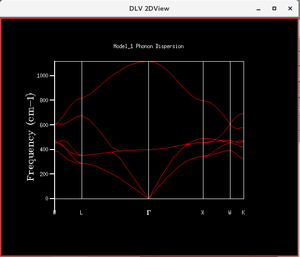
The model used was MgO.str. The calculation was carried out at 0 K and 0 GPa. The n-point was ramped up from 25 to 6,400 (Each successive data point was twice the former). The calculation tracked the energy along the conventional path in k-space, W-L-G-W-X-K, with n-point number of steps. Hence, the higher the n-point, the more sampling was made along the path. The optimal n-point was determined to be 1,600 using zero-point energy convergence (within 0.0001 eV) as a basis (which was the only variable output as the n-point was increased in this part of the experiment). The zero-point energy at 1,600 n-point was 0.171955 eV. The results of this calculation was the phonon dispersion function as shown in Figure 1.
 |
3. Calculating Effect of Temperature on Expansion and Energy of MgO
a) Quasi Harmonic Approximation (QHM) or Lattice Dynamics (LD) Method
The model used was MgO.str. The calculation was carried out at 0 GPa. The grid size was used was 24x24x24.
To optimize the grid size for subsequent calculation, a series of calculations was carried out at 300 K while varying grid size from 1x1x1 to 40x40x40. The product of the multiplication in the grid size was less than the number of k points that was sampled due to symmetry. The higher the number of samples, the better the "model" calculation would simulate the "true" situation. However, the higher the grid size, the longer the calculation time; and therefore, an optimization between the two was needed.
The basis for selection of the optimized grid size was the convergence of the Helmholtz Free Energy, as compared to other parameters like zero-point energy, entropy and heat capacity. This was because the free energy did not converge as fast as other parameters in response to increase in grid size. This can be compared to how a rate of reaction is determined by the limiting step in the series of reactions.
Using 2x2x2 grid, the calculations were accurate to 0.1 meV. However, the calculation was continued until 40x40x40 grid, when computational time became very slow beyond that. At 24x24x24 grid size, the free energy has converged within 0.001 meV, which was already the precision limit of the calculation. Hence, the 24x24x24 grid size was used for the subsequent calculations.
Using the 24x24x24 grid size, the free energy, lattice parameter and primitive cell volume were calculated for a range of temperatures from 0 - 2,750 K, near the melting point of MgO. The melting point of MgO was around K at 0.0001 GPa or 1 atm.[11] Unfortunately, there are no available literatures about the melting point of MgO at vacuum. However, it would definitely be less than 3,096 K because less work is needed for the solid MgO to overcome the intermolecular forces of attraction to exist in the liquid state.
The calculation failed at melting point because in liquid state, the ions would not be confined within the lattice anymore and due to entropy contribution, the relationship between the cation and anion could not be approximated using Hooke's Law. As a result, LD is useful at low temperatures where the entropy contribution is negligible.
b) Molecular Dynamics (MD) Method
The model used was MgO32.str. The MgO32.str model (64 atoms) was chosen instead of MgO.str (2 atoms) because the internal (total) energy calculation converged only when 64 atoms or above were used.
The GULP calculation was carried out at 0 GPa, at NPT (fixed number of particles (N), pressure (P) and Temperature (T)) and from 25 - 5,500 K, instead of from 0 - 5,500 K. It was unclear why the MD method could not optimize the results at 0 K. At 2,500 K and below, the time step was set at 1 fs, equilibration and production step were set at 500. Beyond 2,500 K, the time step was set at 5 fs, equilibration and production step were set at 500. Time step for the latter temperature range was five times the former to allow for parameters such as volume and total energy to be converged. Refer to Figure 4 and 5 for comparison.
 |
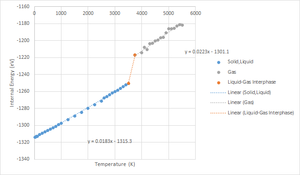 |
Figure 4 was when the time step was set at 1 fs for all temperatures. Figure 5 was when the time step was set at 5 fs beyond 2,500 K. The boiling point of MgO is 3,873 0C at 0.0001 GPa or 1 atm.[12] Unfortunately, there are no available literatures about the boiling point of MgO at vacuum. However, it would definitely be less than 3,873 K because less work is needed for the liquid MgO to overcome the intermolecular forces of attraction and atmospheric pressure to exist in the gaseous state. Indeed, from the calculation, there was a jump in the internal energy calculation between 3,500 - 3,750 K, suggesting that the boiling point at 0 GPa would be within this range. This is within reason because as the state of matter changes from liquid to gas, the intermolecular separation become much larger (refer to figure 9), which would affect the potential energy (V dependent) and therefore, the total internal energy, which is simply the sum of the potential and kinetic energy of the molecules.
Results and Discussion
| Temperature/K | Thermal Expansion Coefficient (x 10-5 K-1)
| ||
| Lattice Dynamics | Molecular Dynamics | Literature Values [1] | |
| 700-1500 | 3.3403 | 3.6600 | 4.0960 |
| Percentage Difference (%) | 22.6 | 12.0 | - |
The thermal expansion coefficients from LD and MD are 3.3403 x 10⁻⁵ and 3.6600 x 10⁻⁵ K-1 respectively at 700 - 1,500 K at 0 GPa. The temperature range and pressure of this calculation is comparable to that of the literature experimental value (300-1,073 K, 0 GPa). The percentage differences between literature value [1] and LD and MD are 22.6 % and 12.0 % respectively. It can be concluded that MD method is able to better describe the thermal expansion of MgO, an asymmetric ionic lattice, than the LD method within the pressure and temperature range specified.
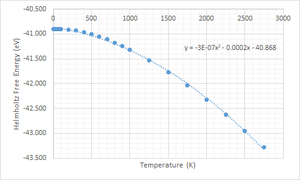
LD method derived their results by minimizing the Helmholtz Free Energy, F. When the temperature increases, the entropy contribution also rises. However, in the LD, the ions are confined within a lattice and therefore, the entropic contribution was not realistic, especially at temperatures near or above melting point (3,000 K at 0 GPa).
 |
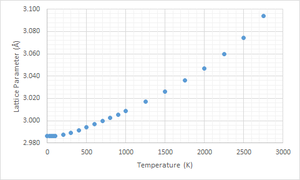 |
Referring to Figure 6 and 7, it could be seen that the general shape of Figure 7 is a reflection of Figure 6 about the x-axis. This is to be expected because in Figure 6, F is related to the lattice energy (E0) which was volume dependent (Figure 7). In both graphs, there are three parts to the graph, the horizontal part, the linear part and the exponential part. At temperatures below 100 K (close to 0), the entropic contribution to the free energy was muted. Hence, the free energy was independent of temperature and solely dependent on lattice energy and zero-point energy. As observed in Figure 7, LD predicted that the volume expansion is negligible from 0 - 100 K. There is a lack of experimental values to ascertain this prediction.
 |
Referring to Figure 8, to allow for comparison between the MgO.str and MgO32.str models used by the two methods, the primitive cell volume from LD was converted to the supercell volume by multiplying each volume by a factor of 32. Also, comparison could not done at other temperatures because the thermal expansion behavior between the two methods would be too drastically different. As has been specified before, the higher the temperatures, the more quickly the LD method breaks down and therefore, there can be no meaningful comparison. Below the specified temperature, it is not immediately clear which model describes the thermal expansion better. However, referring to table 2, a single volume comparison between LD and MD at 300 K, 0 GPa showed that MD was still a slightly better model to predict the real volume of MgO than LD.
Volume(Å3) at 300 K, 0 GPa
| |||
| Lattice Dynamics | Molecular Dynamics | Literature Values [1] | |
| 75.5601 | 75.3624 | 74.7913 | |
| Percentage Difference (%) | 1.02 | 0.80 | - |
Similar to Figure 5, Figure 9 was the MD prediction of the supercell volume thermal expansion when the time step was set at 5 fs beyond 2,500 K. Referring to Figure 8 and 9, LD predicts that supercell volume would increase exponentially, while MD predicts that the supercell volume of MgO would increase linearly. The jump in the supercell volume occurred at the calculated boiling temperature range (3,500-3,750 K at 0 GPa) and is due to phase transition from liquid to gas. Above 3,750 K, MD predicts that the supercell volume would increase linearly again.
The boiling point of MgO is 3,873 0C at 0.0001 GPa or 1 atm.[12] Unfortunately, there are no available literatures about the boiling point of MgO at vacuum. However, it would definitely be less than 3,873 K because less work is needed for the liquid MgO to overcome the intermolecular forces of attraction and atmospheric pressure to exist in the gaseous state. Indeed, from the calculation, there was a jump in the supercell volume between 3,500 - 3,750 K, suggesting that the boiling point at 0 GPa would be within this range. This is within reason because as the state of matter changes from liquid to gas, the intermolecular separation become much larger.
 |
Further Discussion
In order to obtain an accurate phonon dispersion calculation, there is a need to sum over all of the vibrations in the lattice, which means all the k-points in the reciprocal lattice. However, as the number of k-points is increased, the processing time also increases proportionally. Hence, there is a need to optimize the k-point used, one that is sufficiently large to approximate the accurate free energy, yet one that does not take too long for the computer's processing power.
In the phonon dispersion calculation, the calculation tracked the energy along the conventional path in k-space, W-L-G-W-X-K, with n-point number of steps. Hence, the higher the n-point, the more k-point sampling was made along the path. The optimal n-point was determined to be 1,600 using zero-point energy convergence (within 0.0001 eV) as a basis (which was the only variable output as the n-point was increased in this part of the experiment). The zero-point energy at 1,600 n-point was 0.171955 eV. The results of this calculation was the phonon dispersion function as shown in Figure 1.
Similarly, to obtain an accurate density of states, there is also a need to sum over all vibrations in the lattice to obtain the accurate Helmholtz Free Energy. Likewise, the processing time increases as more k-points are used.
In the density of states calculation, the reciprocal space are divided into grids and each k-point at the grid points are sampled. Hence, the higher the grid points, the more k-points that is sampled. The product of the multiplication in the grid size was less than the number of k points that was sampled due to symmetry. When grid size is equal to 1x1x1, only one k-point labelled L (0.5,0.5,0.5) was sampled.
 |
 |
Comparing Figure 10 and 11, it could be seen that in figure 10, there are sharp discrete values for the normalized frequency for 1x1x1 grid, whereas the density of state plot with 24x24x24 grid shows a continuous function, which agrees with the phonon dispersion plot (Figure 3). In the phonon dispersion plot of the MgO primitive unit cell, there are six branches as expected, where the number of branches is equals to the number of atoms multiplied by the dimension of the plot (3). Also, the six branches cover the frequency from 0 to 1,116 cm-1; hence, in the density of state plot, a continuous function that covers the said frequency is expected.
Phonon dispersion curve is a plot of the energy against k points. If we draw a horizontal line across the energy axis, the number of intersects between the horizontal line and the branches represent the frequency of a particular energy level amongst all the k-points. This information is then reflected in the y-axis of the density of state plot, where normalized frequency of a number of k-points sharing the same energy is plotted against the frequency.
Hence, sampling one k-point is definitely not enough to obtain an accurate density of states plot. To address this issue, there is a need to icnrease the grid size. The basis for selection of the optimized grid size was the convergence of the Helmholtz Free Energy, as compared to other parameters like zero-point energy, entropy and heat capacity. This was because the free energy did not converge as fast as other parameters in response to increase in grid size. This can be compared to how a rate of reaction is determined by the limiting step in the series of reactions. Using 2x2x2 grid, the calculations were accurate to 0.1 meV. However, the calculation was continued until 40x40x40 grid, when computational time became very slow beyond that. At 24x24x24 grid size, the free energy has converged within 0.001 meV, which was already the precision limit of the calculation. Hence, the 24x24x24 grid size was chosen for the subsequent calculations.
One discussion point is whether the optimized n-point for MgO(1,600 n-points) and grid size for MgO (24x24x24) is applicable to other materials: (a) CaO; (b)Faujasite; and (c) Lithium. Referring to Table 3, MgO and CaO have similar lattice parameters, which mean that the optimized n-point and grid size for MgO are transferrable to CaO. However, for MgO and Faujasite, Faujasite has a much larger cell volume, which means that the domain of its First Brillouin zone is narrower than that of MgO. This means that it requires less n-point and smaller grid size than those of MgO to achieve the same resolution or effect. In contrast, for MgO and Li, the Li has a slightly smaller cell parameter than that of MgO. This means that it requires more n-point and smaller grid size than those of MgO to achieve the same resolution or effect.
MgO[1] |
CaO[13] |
Faujasite[14] |
Lithium[15]
| |
| Lattice Parameter(Å) at 300 K, 1 atm | 4.2076 | 4.8110 | 24.638-24.650 | 3.49 |
The main approximation in LD is that (1) the ions are confined a lattice; and (2) the ionic bond between the two oppositely charged ions behave like a spring.
The physical origin of thermal expansion is that when a material is heated, its atoms vibrate faster and they maintain a greater average separation. When the temperature increases, the entropy contribution also rises. However, in the LD, the ions are confined within a lattice and therefore, the entropic contribution was not realistic, especially at temperatures near or above melting point (3000 K at 0 GPa).
In a diatomic molecule with an exactly harmonic potential, the equilibrium bond length does not increase with temperature. Higher temperature only causes greater displacement from the equilibrium bond length and causes the molecules to vibrate faster (constant spring constant). In other words, thermal expansion does not apply in the pure harmonic model. This is different from the quasi-harmonic approximation, where the system is allowed to expand (bond length or equilibrium separation is allowed to increase).[5]
In this calculation, the MgO32.str model (64 atoms) was chosen instead of MgO.str (2 atoms) because the internal (total) energy calculation converged only when 64 atoms or above were used.
Conclusion
In conclusion, this study has compared the effectiveness of LD and MD in calculating the isobaric thermal expansion coefficient of MgO using General Utility Lattice Program (GULP)(3.340 x 10⁻⁵ K-1 and 3.660 x 10⁻⁵ K-1 respectively, applicable for 700 - 1,500 K, 0 GPa). This study has concluded that beyond 300 K and 0 GPa, MD prediction is closer to existing experimental values from other studies than LD.
References
- ↑ 1.0 1.1 1.2 1.3 1.4 1.5 1.6 I. Suzuki, J. Phys. Earth, 1975, 23, 145-159.
- ↑ R. R. Reeber, K. Goessel, and K. Wang, Eur. J. Mineral, 1995, 7, 1039-1047.
- ↑ Example 1. A simple case: MgO, http://www.theochem.unito.it/crystal_tuto/mssc2008_cd/tutorials/geometry/geom_tut.html, (accessed December 2017)
- ↑ The bulk crystal (MgO), http://www.theochem.unito.it/crystal_tuto/mssc2008_cd/tutorials/surfaces/surfaces_tut.html, (accessed December 2017)
- ↑ 5.0 5.1 5.2 H. R. Clyde, and M. L. Klein, C R C Critical Reviews in Solid State Sciences, 1971, 2, 181-254.
- ↑ G.Fiquet, P.Richet, and G.Montagnae, Phys. Chem. Minerals, 1999, 27, 103-111.
- ↑ M.P.Allen, Introduction to Molecular Dynamics Simulation, John von Neumann Institute for Computing, 2004.
- ↑ T.S. Bush, J.D. Gale, C.R.A. Catlow, and P.D. Battle, J. Mater. Chem., 1994, 4, 831-837.
- ↑ T.C. Lim, Z. Naturforsch. , 2009, 64a, 200-204.
- ↑ A.K. Rappe, C.J. Casewit, K.S. Colwell, W.A. Goddard III, and W.M. Skiff, J. Am. Chem. Soc. , 1992, 114, 10024.
- ↑ Z.Panek, Silikáty , 1979, 23, 97.
- ↑ 12.0 12.1 W.M.Haynes, CRC Handbook of Chemistry and Physics, CRC Press Inc., 2010.
- ↑ O.Madelung, U. Rössler, and M. Schulz , II-VI and I-VII Compounds; Semimagnetic Compounds , Springer-Verlag Berlin Heidelberg, 1999.
- ↑ J.W. Anthony, R.A. Bideaux, K.W. Bladh, and M.C. Nichols, Handbook of Mineralogy, Mineral Data Publishing , 2000.
- ↑ K.Hermann, Crystallography and Surface Structure: An Introduction for Surface Scientists and Nanoscientists, WILEY-VCH Verlag GmbH & Co. KGaA, Weinheim , 2011.
