Rep:KT1902MgO
Introduction
Thermal expansion is the propensity of a material to change its shape or volume in response to a change in temperature. This behaviour can be attributed to the following: as temperature rises, the potential energy of the crystal also rises. This means that the internal vibrations of the atoms within the crystal occur at higher vibrational energy levels (at larger amplitudes) and thus, leads to a larger average interatomic separation and a larger volume. The degree of this volumetric expansion with respect to temperature is described below, as the thermal expansion coefficient, αV:
The division by the V0 term normalises the equation as it omits the intrinsic zero-point-volume (at 0 K) of the ionic solid. This allows valid comparison of thermal expansion coefficients between different materials. When the differences in volume and temperature are small, the equation can be approximated to state functions, as shown. Alternatively, the volume components (for a 3D system) can be directly swapped out for the lattice parameter equivalents (for the 1D system): .
This thermal expansion coefficient mathematically describes how the lattice volume changes as temperature changes for an isobaric system. Thermal expansion is a reflection of the innate strength of materials and is a crucial property in deciphering problems such as residual stresses in superlattices[1]. In particular, the thermal expansion and molar volume of MgO are vital parameters for the thermodynamic modelling of the Earth’s interior. Furthermore, the structure of MgO is common to many other ionic solids due to its high symmetry, high packing efficiency and high coordination number. Hence, accumulating this all together, MgO proves to be a very capable prototype material for modelling other ionic oxides. Because of its representability and its abundant nature, computational analysis will be performed on MgO. We will assume this system to be ideal (long- and short-range order), non-defective and periodic in all three dimensions. In the solid state, MgO has a face-centred cubic (fcc) geometry with only one lattice parameter, ac (due to its cubic symmetry).
The quasi-harmonic approximation (QHA) is an extension of the harmonic phonon model. If we attempt to treat the atoms using a harmonic (parabolic) potential, the model would fail to account for thermal expansion, as the interatomic equilibrium distance would be invariant with temperature. The harmonic phonon model predicts: that all interatomic forces are purely harmonic; that phonons don’t interact; and that each atom within the lattice can be treated as an independent simple harmonic oscillator. Hence, the QHA contains an additional anharmonic factor which changes the potential energy surface (PES) from a quadratic function, as in the harmonic phonon model, to a PES that closely resembles the Lennard-Jones potential. This anharmonic add-on is responsible for the change in interatomic distance (a reflection of the crystals volume) with the change in temperature, allowing the explanation of thermal expansion – the greater the temperature, the increased amplitude of phonons. In this respect, the QHA retains the harmonic expression for the Helmholtz free energy (shown below), whilst introducing an explicit dependence of phonon frequencies on volume[2].
where U0 is the zero-point internal energy at T = 0K, the second term is the vibrational zero point energy of the lattice, k is the k-vector, is the frequency of the jth phonon mode at the “k” value within the first Brillouin zone, T is the absolute temperature, and the final term represents the vibrational degrees of freedom. It is valid to determine the dependence of the crystal structure on temperature by minimising the free energy[3].
As stated before, the QHA model is based on phonons, which are the fundamental vibrations in a crystal lattice. Phonons are wave-like phenomena in classical mechanics but quantum-mechanically, they have particle-like properties, analogous to photons. The QHA present the phonons as oscillating throughout the crystal lattice in only one dimension. The internal energy of the crystal is related to the amplitude of the vibrational mode of the phonon. Hence, the total internal energy of the crystal lattice is calculated by summing the energy over all vibrational modes, over all of the energy bands.
A more classical computer simulation originates from the Molecular Dynamics (MD) approach, which is a numerical, step-by-step, solution of the classical equations of motion for each atom:
The fi above is derived from the atom’s potential, which in turn, is the sum of the pairwise potentials given by the Lennard-Jones potential. This approach operates on real space and so accounts for the breaking of bonds as the interatomic distance increases until a dissociation limit is reached, which is crucial when discussing the lattice’s behaviour at high temperatures. The atoms within the lattice are interacting via the interatomic anharmonic potential.
The foundation of this approach is as follows. The forces acting upon the atoms is determined from the negative differential of the potential energy (fi = - ∂Ui/∂ri)[4]. The atoms are then accelerated using the law above (a = F/m). The new velocity of the atoms is calculated using vnew = vold + a dt). From this, the new atom positions are found, this step being considered a time step(rnew = rold + vnew dt). This cycle is repeated until the lattice parameters of the solid are optimised and their values converge.
Utilizing the law above, the trajectories of the atoms can be computed periodically and subsequently, time averages can be obtained, from which thermodynamic properties are obtained (but only for systems that obey the ergodic hypothesis).
The MD simulations are carried out by simulating the actual vibrations of the units within the lattice and this allows movement in all three dimensions. DLVisualize (DLV) and the General Utility Lattice Program (GULP) within RedHat Linux were used to model the periodic structure of MgO and operate on it. The use of Redhat Linux allowed the possibility of running complex numerical calculations as those required when modelling the behaviour of MgO. DLV modelled the structure of MgO and highlighted the changes in the crystal structure of MgO within different thermal environments. The GULP authorizes the running of simulations on lattices with the use of boundary conditions. It uses symmetry arguments and force field methods to calculate the properties (free energy, lattice parameters etc.) of the crystal lattice by focusing on the atoms within the lattice, not the electrons.
Internal energy of the MgO lattice
The smallest cell that can be used to generate the whole crystal lattice of MgO upon repetition, the primitive cell, is a rhombohedron of side length (lattice parameter) 2.9783 Å (a=b=c) and an internal angle of 60° (α=β=γ). This lattice parameter agrees well with the literature value, where a = 2.573 Å, attained through the Linear Combination of Atomic Orbitals Hartree-Fock calculations[5]. One MgO unit (2 atoms) is contained within one primitive cell The value of the side length is derived from the cell vectors of the primitive cell, shown in Table 1:
| 0.00000 | 2.10597 | 2.10597 |
|---|---|---|
| 2.10597 | 0.00000 | 2.10597 |
| 2.10597 | 2.10597 | 0.00000 |
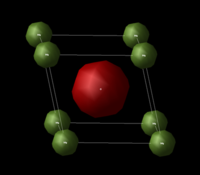
The same MgO lattice can also be described by a crystallographic cell, a conventional cell, which has a cubic symmetry. The side of the cube, the lattice parameter, is 4.212 Å (a=b=c), with an internal angle of 90° (α=β=γ). Yet again, this lattice parameter calculation correlates well with the literature value of 4.211 Å. A conventional cell is primarily made up of four joined primitive cells but it is a cube, which better reflects the true symmetry of the MgO crystal. The density (ρ) of the primitive and conventional cells are the same. The conventional cell encloses 4 MgO units but its volume is four times that of the primitive cell.
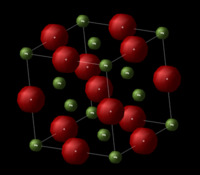
The internal energy of the MgO crystal was determined from GULP calculations. To be able to do this, a model had to be implemented for the interaction between the Mg and O atoms. The model used assumed only electrostatic interactions between the two so of course, the oxygen carried a -2 charge and Mg, the +2 charge. The mathematical equivalent of the model is the Coulomb-Buckingham potential[6].
A, B and C are experimentally-determined constants. The first two terms represent the Buckingham potential – the repulsion between two ions at very small inter-ionic distances. The third term describes the Coulomb potential, which greatly dominates at relatively large inter-ionic distances. Summing all the individual repulsive and attractive potentials gives the internal energy of the MgO crystal – the energy required to pull all of the ions from an equilibrium distance apart to infinite separation. The internal energy of the MgO lattice, per primitive cell, at 0 K, is given by: .
Phonon modes of MgO
Phonon dispersion curves
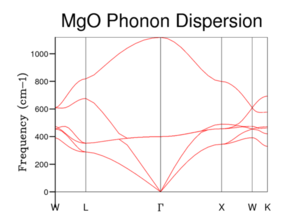
For the phonon dispersion curve of MgO, the frequency/energy of the phonons were computed as a function of their wave-vector (k), at 50 values of k, along the conventional path in reciprocal space. The conventional path being that define by the symmetry points: W-L-Γ-X-W-K. The use of these symmetry points reflect an important simplification – they simplify the vibrations of the crystal lattice. In 3D, an infinite lattice, as in MgO, has an infinite number of vibrational modes (each of which has an associated k-label) which cannot be visualised and so it’s simpler to assign a symmetry label to every vibration possible of the crystal – to categorise the vibrations based on symmetry (specific k values).
The MgO phonon dispersion curve derived from GULP calculations match that of the phonon dispersion curve for MgO, calculated from computer simulations based on density-functional perturbation theory[7]. The curve displays six different phonon vibrational modes, which is apparent as each Cartesian axis (a degree of freedom) has associated with it two distinct vibration modes, acoustic and optical, giving rise to three acoustic bands and three optical bands for the two atoms in the primitive cell.
The optical vibrational modes are IR active (are able to interact with infrared radiation) and take place when the Mg cations and O anions move in opposite directions, when excited. This is an out-of-phase vibration and causes the phonon vibrations to have a non-zero frequency at the origin in reciprocal space, Γ. The number of optical modes is given by (3N-3), where N is the number of atoms in the primitive cell. They are responsible for Raman scattering. On the other hand, the acoustic vibrational modes originate from in-phase vibrations (excited Mg and O ions move in the same direction). Acoustic phonons are responsible for Brillouin scattering. A consequence of these in-phase vibrations is that the wavelength of the vibrations tend to infinity due to the relationship between the wave-vector, k, and the phonon wavelength, λ: . Ergo, the acoustic vibrational modes have a zero frequency at Γ.
Phonon density of states
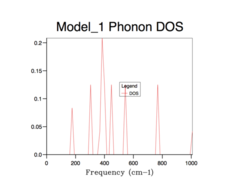
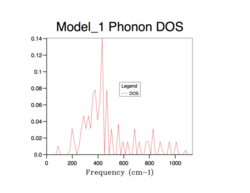
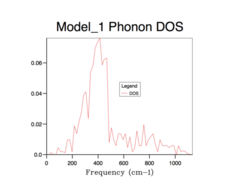
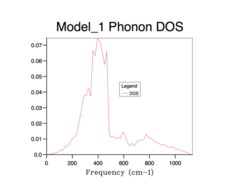
The density of states (DOS) describes the number of electronic states (n) with an energy in a particular infinitesimally small energy interval, [E, E+ΔE]: . It tells us the number of states at each k-value. As will be evident in subsequent DOS(E) plots, the DOS is merely a summation of the phonon energy dispersion at infinitesimal increments of energy. The DOS plots show the distribution of phonons in terms of their vibrations by the extension of the equation: E = hν. Therefore, when comparing the DOS(E) plots to the phonon dispersion curve shown before, the flat regions (where the gradient = 0) of the phonon dispersion curve gives the k-value of maximum vibrational density of states[8].. Alternatively, this can be interpreted as an inverse relationship between the phonon DOS and the gradient of the phonon dispersion curve (as evidenced by the formula above). This means that flatter vibrational bands equal larder phonon DOS values at that particular frequency. Using an infinitely large grid size (∞x∞x∞), to sample over all possible k values, would provide perfect resolution and a maximum amount of information gained and thus, total accuracy. However, this computation would be infinitely long and so a balance must be found between an acceptable computation time and a sufficient resolution (enough information gathered) and accuracy to sample enough k values to represent the true phonon DOS.
 |
 |
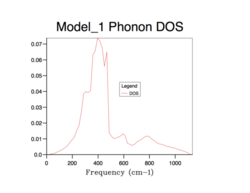 |
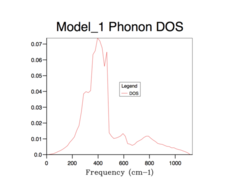
All of the phonon DOS plots highlight that the most reoccurring phonon frequency in the MgO lattice occurs just below 400 cm-1. As is evident and as mentioned before, a larger grid size means that more k values were sampled in reciprocal space. This leads to a more averaged DOS plot with a better resolution, which ultimately causes a better accuracy. The drawback of having larger grid sizes is the proportional increase in computation time. Therefore, a grid size of 32x32x32 was chosen as the optimum balance between accuracy and computation time and so was used in subsequent thermal expansion calculations as it seemed to represent well the true phonon DOS. Grid sizes smaller than 32x32x32 produced quicker results but at the unacceptable cost of creating phonon DOS curves which were very jagged and not continuous. This was the result of sampling too few points in k space. Furthermore, the phonon DOS curves originating from smaller grid sizes appeared to cross the x-axis, which would lead to a negative DOS – a physical impossibility. This reflects the poor accuracy of using too small of a grid. On the other hand, a grid of size 64x64x64 did show a more resolved and more accurate curve, but the difference between this and the 32x32x32 grid size curve is not significant enough to allow the increase in computation time.
The same concept, for accurately representing a phonon DOS, can be applied for other lattices. The idea of optimal grid sizes is related to the lattice constants, in both real- and reciprocal-space, of a material: , where a* is the lattice constant in reciprocal space and a is the lattice constant in real space. It is worth noting that if a primitive cell is small in real space due to a small lattice constant, the corresponding Brillouin zone in reciprocal space will be large due to the inverse proportionality of the lattice constants in real- and reciprocal-space.
Comparing to the MgO ionic lattice, lithium has a smaller lattice constant in rel space. This can be expected as Li is in group 1 and period 1 of the periodic table, making the ionic radius of Li+ much smaller than that of Mg2+ and O2-. This means the lithium cations can pack more closely together amongst the sea of delocalised electrons, leading to a smaller lattice constant in real space. The sea of delocalised electrons shield and mediate the electrostatic repulsion between identically charged Li+ cations, causing narrower energy bands in metals. Consequently, the lithium lattice will have a larger lattice constant in reciprocal space, due to the inverse proportionality. Thus, in order to more accurately represent the true phonon DOS and the true phonon dispersion curves for lithium, a larger grid size will be needed – more k-points will need to be sampled in reciprocal space. The more k-points sampled, the more vibrational modes are computed. This hypothesis is supported by a literature value that specifies the lattice constant, for lithium, in real space, as 3.51 Å[9], which is significantly smaller than the respective lattice constant for MgO.
As for Faujasite, a member of the family of zeolites, it has a much larger lattice constant in real space, which results in much smaller lattice constant in reciprocal space. Therefore, in order to accurately represent the true phonon DOS and the true phonon dispersion curves for Faujasite, a smaller grid size will suffice. Less k-points in reciprocal space will need to be sampled. The smaller lattice constant in reciprocal space means that the k-points will be very close together in the smaller cell, and so not sampling all of them won’t have any significant effects on the accuracy of the results due to how close they are together. On that account, the drawback of having poor resolution and unsatisfactory accuracy using smaller grid sizes for MgO doesn’t apply here as there is no benefit, just a greater time cost, of using the larger grid sizes for Faujasite. Again, this hypothesis is reinforced by literature, which gives the lattice constant for Faujasite, in real-space, as 24.45 Å [10], which is greatly larger than that for MgO.
As they are both group 2 metal oxide lattices, it is presumed that not much will differ when comparing CaO with MgO. It is assumed that the lattice constants for both lattices, in real- and reciprocal-space, will be practically equivalent. This claim is corroborated by literature, which gives the lattice constant for CaO, in real space, as 4.8 Å[11]. The similarity in the sizes of the Brillouin zones for both CaO and MgO means that very similar grid sizes can be used for both to accurately represent the phonon DOS and phonon dispersion curves for both lattices. Thus, a grid size of 32x32x32 would suffice for the CaO lattice. Furthermore, the CaO lattice has an identical geometry to the MgO lattice (fcc in real space and bcc in reciprocal space), highlighting the similarity between the two.
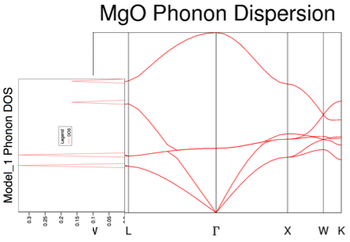
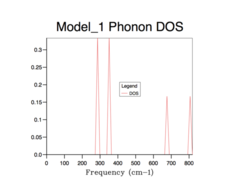
Figure 4 presents the phonon DOS for a 1x1x1 grid which was computed for a single k value of kx=ky=kz= ½. This phonon DOS(E) plot was constructed from the results of the phonon dispersion curve. As there are 6 phonon vibrational modes, it is expected that there’d be 6 distinct peaks in the phonon DOS. However, only 4 peaks from 4 distinct vibrational modes are shown. Figure 11 shows clearly that the corresponding k value of ½ is due to the symmetry label, L. The vector (½, ½, ½) matches the frequencies of the peaks observed. The vibrational bands merge together at that specific k value of ½ to become degenerate, which explains the relative intensities of the peaks as a 2:2:1:1 ratio. The peaks at 286 cm-1 and 351 cm-1 are degenerate and have double the intensity as the degenerate peaks at 676 cm-1 and 806 cm-1, which is what we observe for the bands at L.
Helmholtz free energy of MgO
The Helmholtz free energy (A) of the entire MgO lattice was calculated by summing the free energy over all of the vibrational modes (j) and over all k points of the lattice, according to the QHA approximation.
| Grid size | Helmholtz free energy (A) per primitive cell of MgO at T = 300 K(eV) | Difference in A of the A of an infinitely large grid (meV) |
| 1x1x1 | -40.9303 | 3.8180 |
| 2x2x2 | -40.9266 | 0.1260 |
| 4x4x4 | -40.9265 | 0.0330 |
| 8x8x8 | -40.9265 | 0.0050 |
| 16x16x16 | -40.9265 | 0.0010 |
| 32x32x32 | -40.9265 | 0.0000 |
| 64x64x64 | -40.9265 | 0.0000 |
The difference in Helmholtz free energy between the grid sizes rapidly converges to zero, as the grid sizes increase, until a limit is reached that aligns with an infinitely large grid. Initially, the free energy differences between grid sizes is small (on a meV scale) as the Coloumb-Buckingham potential covers the main contributions to the free energy (eg. the interatomic potentials).
The difference in free energy, between the true value and the value computed for the different grid sizes, reinforces the previous claim that the smaller grid sizes are less accurate in representing the true phonon DOS and phonon dispersion curve of the lattice. The increase in accuracy for the larger grid sizes comes from sampling more k-points, which in turn, samples more vibrational modes. This means that less vibrational modes are left out and less of their respective energies are assumed. The calculations of the free energy support the judgement that the 32x32x32 grid size is representative of the true phonon DOS and true phonon dispersion curve, as the difference between the 32x32x32 grid and the infinitely large grid is negligible.
For calculations accurate to 1 meV and even 0.5 meV, a 2x2x2 grid size would more than satify. For an accuracy within 0.1 meV, a grid size of 4x4x4 would be enough.
As you increase the grid size, the Helmholtz free energy of the MgO lattice seems to decrease, approaching the limit coinciding with an infinitely large grid. This trend can be accounted for by considering the internal energy of the lattice, U = H – PV. A larger grid size can be considered analogous to an increase in volume (V). Keeping the enthalpy (H) and pressure (P) constant, the increase in volume causes a decrease in internal energy (U). On the other hand, a larger grid size increases the number of possible microstates (W) which, using the Boltzmann equation, S = kbln(W), corresponds to a larger entropy. Coupling these ideas together and using the Helmholtz free energy, A = U – TS, the smaller internal energy and larger entropy produces a more negative Helmholtz free energy (A), as is witnessed.
Alternatively, the decrease in Helmholtz free energy as you increase grid size can be attributed to: . The first term is the zero-point energy (at 0 K). The second term (first summation) is the harmonic contribution. The third term (second summation) is the entropic contribution to the vibrational energy and is the only term with a strong dependence on temperature. As more vibrational modes are sampled, as a result of an increased grid size, the second summation includes more terms, all of which are negative and large due to T = 300 K. The contribution from the second summation negates the opposing contribution from the first summation due to T = 300 K.
Thermal expansion of MgO, using the QH approximation
Running the GULP calculations samples the internal energy and the phonons at a range of geometries of MgO, in the hope of achieving a geometry of MgO that minimises the Helmholtz free energy (the lattice parameters are optimised). These optimisations were carried out between temperatures of 0-1000 K, at 100 K increments. Subsequently, the Helmholtz free energy was determined using the QHA, obeying the approximations specified in the introduction.
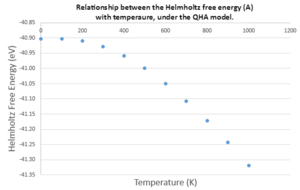
As the temperature is increased, the Helmholtz free energy decreases exponentially. This can be understood by returning to the Helmholtz free energy equation. The second summation, which relates to the entropy of the system, is negative and is the only term dependent upon the temperature. As temperature increases, this second summation becomes more and more dominant, and diminishes the contribution from the other terms, leading to a single, negative exponential summation. This can be understood physically. At higher temperatures, the phonons from the ground state populate more of the higher vibrational energy levels, leading to an increase in microstates (W) and entropy (S). At temperatures approaching 0 K, this entropic term tends to 0 as all of the phonons occupy the ground vibrational energy level, causing the system to remain at the zero-point energy, E0.
The population of the higher vibrational energy levels by the phonons is accompanied by an increase in the MgO lattice parameters. The increase in the lattice parameters highlights how temperature shifts the equilibrium inter-ionic distance to larger values, in MgO – the thermal expansion.
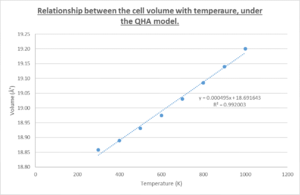
It appears that the classical limit is reached at high temperatures because the energy spacings between adjacent vibrational energy levels becomes smaller as the anharmonicity increases. These energy spacings then become negligible when compared to the provided thermal energy (kbT). This causes the spectrum of vibrational energy levels to seem like a continuous band. This shows that, at higher temperatures, the classical treatment is more accurate.
The points corresponding to the cell volume at 0 K, 100 K and 200 K have been omitted as they fail to follow the linear relationship depicted by the line of best fit. They were ignored in the calculation of the thermal expansion coefficient in an attempt to improve the accuracy of the data. The zero-point volume of the MgO cell, V0, was determined by extrapolation to the y-axis, where T = 0 K. This does carry a degree of intrinsic error.
Taking V0 to be 18.691884 Å3, the volumetric thermal expansion coefficient (for temperatures between 300 K and 1000 K, for reasons specified before) is calculated as:
This small thermal expansion coefficient for the MgO lattice is expected, due to the heavy ionic bonding of MgO.

Furthermore, using L0 as 2.653967 Å, the linear thermal expansion coefficient is:
The ratio of the volumetric thermal expansion coefficient to the linear equivalent is:
This ratio is fitting to the relationship proposed by B. S. Mitchell, = [12]. This relationship announces that our MgO system is an isotropic system.
The literature value for the volumetric thermal expansion coefficient for MgO, between 25–1000 K, is 1.39x10⁻⁵K-1[13]. This is of the right scale as our experimental value but it is significantly different, nevertheless, by a factor of 2. Firstly, this can be attributed to the temperature range used in each respective calculation. The literature value included the non-linear relationship between the volume and the temperature (between 0 – 300 K), that we omitted, leading to a variation in the values. Secondly, and most importantly, the deviation is mostly due to the QHA model implemented in the calculations. The model assumes that the system we are using is a perfect, defect-free, infinite crystal. In the real system, as temperature increases, the thermal equilibrium defect concentration also increases which causes a weaker ionic bonding in certain places, leading to a larger thermal expansion coefficient. In addition, the QHA approximation doesn’t account for the larger anharmonic contribution to the potential at high temperatures. This larger anharmonic contribution really stunts the accuracy and reliability of the model as temperatures increase. This is because the phonon frequencies are taken to be volume dependent. The QHA approximation also utilizes the Born-Oppenheimer approximation – the nuclear vibrations are decoupled from electronic motion.
Further discussion on the quasi-harmonic approximation
The physical origin of thermal expansion arises from the increase in the amplitude of the vibrations within the lattice, as temperature increases. This means that the phonons are at higher vibrational energy levels and have a larger amplitude causing the Mg+2 and O-2 ions to be, on average, further from each other which causes the increase in cell volume of the MgO lattice.
When temperatures begin to approach 3125 K, the melting point of MgO, there is a colossal displacement of the ions from their equilibrium inter-ionic distance and the ionic bonding ceases to exist. This is due to the amplitude of the phonons being so large that the ions are separated enough to deem the electrostatic attraction to be negligible. This results in zero attraction between the ions and the lattice breaks down at the melting point. At temperatures approaching the melting point, the QHA model is no longer accurate as it only accurately accounts for the small displacements from the equilibrium inter-ionic distance (eg. the harmonic portion of the Lennard-Jones potential). Furthermore, at such high temperatures, phonon-phonon interactions become significant due to the larger phonon populations in the higher vibrational energy levels. This breaks the QHA model, which assumes the phonons are independent.
Ultimately, at temperatures approaching the melting point of MgO, the simulated phonon modes fail to accurately describe the actual motion of the ions in the solid lattice as the QHA model and its approximations fail to accurately stretch to higher temperatures. Due to its anharmonic modifications mentioned in the introduction, the QHA models allows the lengthening of a bond as temperature increases. If the anharmonicity was excused, this would not be the case. Therefore, for a diatomic molecule abiding by a totally harmonic potential, the bond lengthen would not lengthen with increasing temperature. The inter-atomic distance would remain constant, with occasional small fluctuations, due to the symmetry of the harmonic potential. For a solid, and when using the QHA model, the anharmonic contributions allow the bond length to increase, as temperature increase, until a point of dissociation is reached, where the bond breaks and the ions go to infinite separation. This would only be the case for the diatomic molecule if a Lennard-Jones potential was used to model the bond length.
Thermal expansion of MgO, using the MD simulations approach
The primitive unit cell for MgO is sufficient for the QHA model due to its simplicity – run the simulations on a single MgO unit in the unit cell and then scale-up to account for all the primitive unit cells in the whole MgO lattice. The MD simulations approach, however, requires the use of the supercell representation, containing 32 MgO units, of the MgO lattice. This is because the MD approach aims to simulate the actual vibrations of the MgO units, in all 3 dimensions, within the lattice. Using the supercell representation allows the calculations to account for the fact that the vibration of a single MgO unit cascades and effects the neighbouring MgO units.

The same principle applies for the MD approach as the QHA approach – the use of larger sized supercells generates more accurate results as they sample more data and so reflect, more accurately, the real phonons within the lattice, at the cost of time.
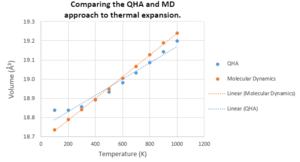
Both the QHA and MD simulations successfully, but accuracy yet unknown, model the thermal expansion of MgO as both show an increase in cell volume as temperature increases, as shown in Figure 16.
The volumetric thermal expansion coefficient of MgO, under the MD approach, in the temperature range of 100 – 1000 K, is given as:
K-1
Comparing with the respective expansion coefficient using the QHA approach, αV (QHA) = 2.249 x 10⁻⁵ K-1, the two approaches produce very similar results, respecting the different temperature ranges of both calculations. The similar coefficients prove the approaches are as reliable as each other in simulating the phonons in the MgO lattice, but both are inaccurate in representing the real phonons in MgO.
As can be seen, the cell volume predicted using the QH approximation is always larger than that using the MD simulation. This trend is more prominent at lower temperatures due to the non-linear section of the QHA curve. The physical origin of this non-linear section is that at low temperatures, the inter-ionic distance, between the Mg+2 cation and the O-2 anion, is modelled as being totally harmonic which means this distance is invariant with temperature, leading to a gradient of zero in Figure 16. As temperature increases, the anharmonic contribution of the QH approximation becomes more dominant and resembles more closely the phonons modelled by MD.
There is an interesting discrepancy between the two models at temperatures below 200 K, as seen in Figure 16. The QHA predicts a volume independent of temperature, below 200 K, but the MD approach predicts a linear dependence. The classical treatment sets a continuous energy band for the quasi-harmonic system, and this has a minimum energy value of zero. Thus, the energy will keep decreasing, with temperature, until it hits zero. On the other hand, the quantum mechanical treatment provides a more discrete vibrational energy spectrum. Hence, the minimum energy here is given as and so the system will remain in this ground state at the temperatures below 200 K. This shows that the quantum mechanical approach is more accurate at low temperatures.
As previously mentioned, the MD simulation accounts for the ions of the lattice to move in all 3 dimensions. On the other hand, the QHA approach only describes ionic motion in a single dimension. As a result, the thermal expansion, at high temperatures, of the MD cell causes a more distorted geometry of the lattice, which should induce a larger cell volume, than that predicted by the QHA model. This claim arises from the two gradients in Figure 16. At temperatures larger than 1000 K, the MD cell volume looks as if it’ll surpass the QHA cell volume.
As the MD model is more classical, the equipartition thereom can be considered. It can be used to explain the linearity of the MD thermal expansion data. As it encompasses 3 dimensions, it is estimated that the internal energy is equal to: , which explains the linear relationship between internal energy and temperature.
Conclusion
The thermal expansion of MgO was explored from the significantly different viewpoints of the quasi-harmonic approximation, and of the molecular dynamics model. Both models did successfully reflect the increase in volume as temperature increases, but both models failed to accurately represent the true thermal expansion of MgO. This large degree of inaccuracy arises from the poor approximations utilized by each respective model.
For the QH approximations, it seemed that the degree of inaccuracy increases with temperature. This was due to the anharmonic modification of the QHA not being accurate enough to reflect the true situation within the MgO lattice as temperature increases. The QHA approach seems to be too simplistic to accurately reflect the real thermal expansion of MgO, and too many approximations (the Born-Oppenheimer approximation and the anharmonic modification) made be set out. This model seems to break down for crystal MgO, at temperatures above 1000 K, which is unacceptable providing the melting point of MgO is 3125 K. Nonetheless, all models will fail at temperatures approaching the melting point as the solid phase will cease to exist beyond that. Although these approximations achieve a short computation time, they come at the great cost of accuracy. That being said, the QH approximation serves the system well at low temperatures but this isn’t useful as the thermal expansion of a lattice at temperatures near 0 K is barely thermal expansion at all!
As said before, the MD model was just as inaccurate in determining the thermal expansion coefficient, as the QH approximations. The MD approach attempted to simulate the real vibrations amongst the MgO units of the lattice, in all 3 dimensions. Thus, it tried to minimise the amount of approximations it used but this did not translate into an increase in accuracy. The MD approach required a much larger representation of the MgO lattice (a supercell containing 32 MgO units) compared to the humble primitive cell, containing just one MgO unit, as in QHA.
Both models benefitted from the use of a larger grid size/supercell as more data points were sampled and so less predictions were made. For the QHA approach, the larger grid size meant more k-points were sampled. The larger sampling, however, did come at the growing cost of time.
It may be the case that a weighted contribution from both of these models may more accurately represent the true thermal expansion of MgO. This claim originates from the analysis earlier where the classical treatment is more accurate at higher temperatures, whereas quantum mechanics are a better representation at lower temperatures.
Both models treat each sets of ions as hard spheres and in a classical manner, which doesn't take into consideration any atom overlap that would be described in a quantum mechanical manner.
Ultimately, and despite the harsh critique, both methods did permit the study of the thermal expansion of MgO, and from that, thermodynamic properties could be determined. The phonon dispersion curve was accurately determined, and confirmed by literature, so credit to the GULP calculations must be given. This could all be achieved within minutes, highlighting the huge advantage of these two methods.
Instead of experimenting further with these methods, I would like to investigate the thermal expansion coefficient of MgO using a high temperature powder camera, with Cu Kα radiation, to collect high temperature lattice parameter data in the range of 350 – 700 K. This would build upon the work of Damodar Reddy et al. [14]. The thermal expansion coefficient would be determined using Cohen’s least-squares method. This method would be so heavily based on approximations and so should achieve a more accurate result.
References
- ↑ Reeber, Robert R., Kathryn Goessel, and Kai Wang. "Thermal Expansion and Molar Volume of MgO, Periclase, from 5 to 2900 K." European Journal of Mineralogy 7.5 (1995): 1039-048.
- ↑ Erba, A., M. Shahrokhi, R. Moradian, and R. Dovesi. "On How Differently the Quasi-harmonic Approximation Works for Two Isostructural Crystals: Thermal Properties of Periclase and Lime." The Journal of Chemical Physics 142.4 (2015).
- ↑ Gale, Julian D. "GULP: A Computer Program for the Symmetry-adapted Simulation of Solids." Journal of the Chemical Society, Faraday Transactions 93.4 (1997): 629-37.
- ↑ Allen, Michael P. Computational Soft Matter: From Synthetic Polymers to Proteins. JuÌlich: NIC, 2004. Print.
- ↑ Madelung, O., U. Rossler, and M. Schulz, eds. II-VI and I-VII Compounds ; Semimagnetic Compounds. Berlin: Springer, 1999. Print.
- ↑ Rudolph, Peter, ed. Handbook of Crystal Growth: Bulk Crystal Growth. S.l.: Elsevier Science, 2014. Print.
- ↑ Hasnip, Philip J., Keith Refson, Matt I. J. Probert, Jonathan R. Yates, Stewart J. Clark, and Chris J. Pickard. "Density Functional Theory in the Solid State."ChemInform 47.32 (2016).
- ↑ Hoffmann, Roald. "How Chemistry and Physics Meet in the Solid State."Angewandte Chemie International Edition in English 26.9 (1987): 846-78.
- ↑ Callaway, J., Xianwu Zou, and D. Bagayoko. "Total Energy of Metallic Lithium." Physical Review B 27.2 (1983): 631-35.
- ↑ Kaduk, J. A., and J. Faber. "Crystal Structure of Zeolite Y as a Function of Ion Exchange." Rigaku 12.2 (1995): 14-34. Print.
- ↑ Rodriguez, JoseÌ A., and Marcos Fernandez Garcia. Synthesis, Properties, and Applications of Oxide Nanomaterials. Hoboken, NJ: Wiley-Interscience, 2007. Print.
- ↑ U. Rossler, and R. Blachnik. "Magnesium Oxide (MgO) Crystal Structure, Lattice Parameters, Thermal Expansion." II-VI and I-VII Compounds; Semimagnetic Compounds Landolt-Barnstein - Group III Condensed Matter (1999): 1-6.
- ↑ Touloukian, Yeram S., R. K. Kirby, R. E. Taylor, and T. Y. R Lee. Thermophysical Properties of Matter. New York: IFI/Plenum, 1977. Print.
- ↑ Reddy, K.Damodar, P. Kistaiah, and Leela Iyengar. "Temperature Dependence of the Lattice Parameter and the Coefficient of Thermal Expansion of CsCdF3." Journal of the Less Common Metals 92.1 (1983): 81-84.

