Rep:Jyc08module3
The following exercise will involve the characterisation of transition structures on potential energy surfaces for the Cope rearrangement and Diels Alder cycloaddition.
The transition structures of molecules larger than triatomic systems will be studied. Molecular mechanics and force field methods will not work well for the following structure determination because they cannot describe bonds being made and broken, or changes in the bonding type and electron redistribution.
Molecular orbital-based methods will be used instead which numerically solve the Schrodinger equation and locates transition structures based on the the local shape of the potential energy surface. The structure of transition structure will be found, reaction paths and barrier heights will be calculated.
Cope Rearrangement of 1,5-hexadiene
The following exercise will involve the locating of the low-energy minima and transition structures on the C6H10 potential energy surface. This will determine the preferred reaction mechanism of the [3,3]-sigmatropic shift rearrangement of 1,5-hexadiene.
The [3,3]-sigmatropic shift rearrangement of 1,5-hexadiene is known to occur with a concerted mechanism via either a chair or a boat transition structure. It was thought that the boat transition structure is higher in energy than the chair structure, and this has been proved by B3LYP/6-31G theory, both in term of activation energies and enthalpies.
In the following exercise, these will be calculated using Gaussian.
Optimising the Reactants and Products
The following exercise will involve the optimisation of a structure, the symmetry will be used to find its point group, the vibrational frequencies will be calculated and visualised and the potential energies will be calculated and compared to experimental values.
anti - 1,5-hexadiene optimisation
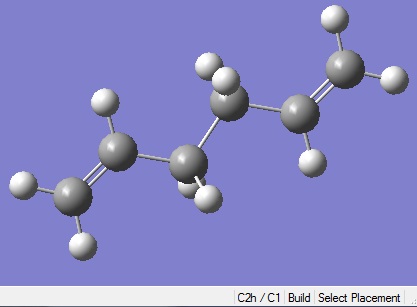
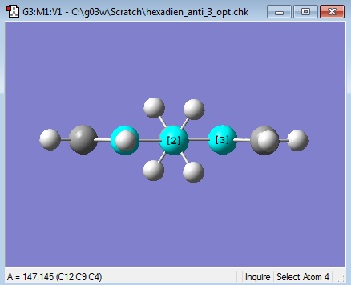
The molecule 1,5-hexadiene was drawn in Gaussview 3 with , making sure that the central 4 C atoms all had anti-periplanar conformations. The structure was cleaned in Gaussview, to give the following structure:
This structure was then optimised Gaussian. The input file was set to do an optimisation, with the method Hartree Fock and the basis set 3-21G. Under the LINK 0 tab the %memb was set to be "%mem=250MB". This input file was submitted to SCAN.
When the calculation had finished, the checkpoint file was opened and visualised in Gaussview 3. The Summary after the optimisation is shown.
The energy of this optimised structure can be seen to equal -231.68539619 a.u., which is only accurate to 2 decimal places compared the energies given in Appendix 1.
The optimised structure was symmetrised and the point group C2h/C1 was found:
It was decided that another attempt should be made in the optimisation of another anti conformation, to try and obtain an optimised molecule with a more accurate energy.
Another anti structure was drawn in Gaussview 3 with the following structure:
The method for optimisation was the same as before, Hartree Fock and the basis set 3-21G. Under the LINK 0 tab the %memb was set to be "%mem=250MB". This input file was submitted to SCAN.
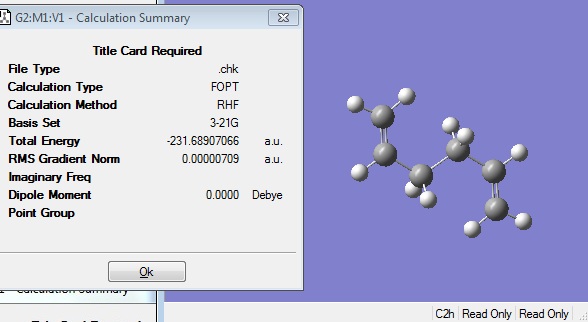
When the calculation had finished, the checkpoint file was downloaded, and the following structure was obtained:
The energy, -231.68907066 a.u., of this optimised structure was now correct to 5 decimal places when compared to the anti 3 structure in Appendix 1. The point group symmetry of C2h was also the same as that found in the Appendix.
Gauche - 1,5-hexadiene optimisation
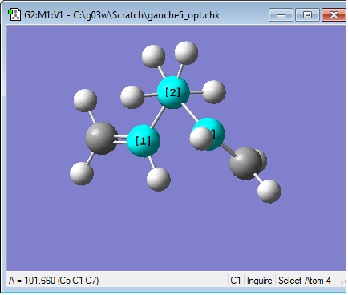
A gauche form of 1,5-hexadiene was drawn in Gaussview, with the following structure:
An input file was created using the same method as before, and submitted to SCAN.
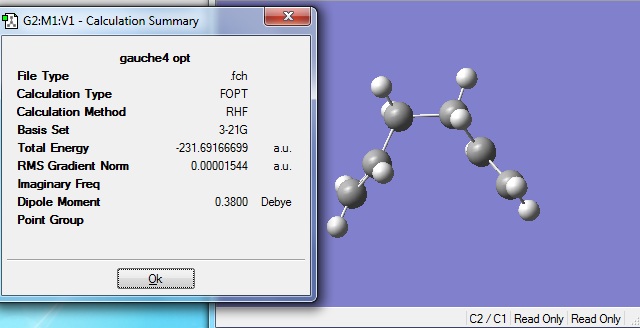
When the calculation was completed, the structure was opened in Gaussview 3 and viewed:
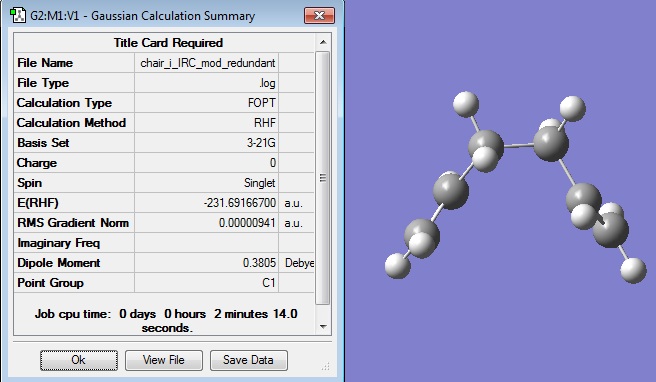
The energy of -231.69166699 a.u. was found to agree with the energy of the gauche 2 structure in Appendix 1 to 5 decimal places.
The symmetry found for this structure was C2, compared to the Appendix structure which was C2 also symmetry.
Another gauche optimisation was done, using the same method and basis set.
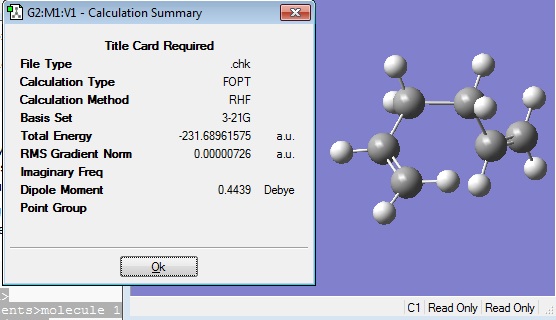
The optimised structure gave the following energy and symmetry:
The energy of -231.68961575 a.u. was the same as that reported in the Appendix for the gauche 5 conformation, -231.68962 a.u., to 5 decimal places.
The C1 symmetry was also the same as that found in the Appendix.
Considering both the anti and gauche conformations, it would be expected that the lowest energy conformation is the anti :
The diagram shows the view down the central C-C bond, from which the dihedral angle is measured and thus the conformation of the molecule is determined.
It can be seen that in the case of the anti conformation, the two ends of the molecule are as far apart from each other (on the basis of the dihedral angle) as possible, whereas in the case of the gauche conformation, the two ends of the molecule are closer together, and therefore are expected to have a steric clash, causing unfavourable repulsive interactions.
However, considering the calculations that have been done in this exercise, it can be seen that the gauche conformations are actually lower in energy than the anti conformation:
| Energy | anti 3 | gauche 2 | gauche 5 |
|---|---|---|---|
| Hartree | -231.6890707 | -231.691667 | -231.6896158 |
| kcal/mol | -145,386.977 | -145, 388.6063 | -145, 387.3191 |
The difference in energy between anti 3 and gauche 2 is 1.6292 kcal/mol where gauche is more stable than anti. This indicates that another effect is contributing to the relative energies of these two conformers.
The two things that must usually be considered to explain stability are sterics and electronics. Since it has been proved from the data that sterics are not the predominant factor in the stabilisation of the gauche conformer with respect to the anti conformer, then the answer should lie in the electronics of this molecule.
It was found that literature[1] had suggested that the discrepency between the expectation that antiwas more stable, and the result that gauche was actually found to be more stable, could be explained by considering interactions between the MOs.
It was cited that the observation of a more stable gauche conformer was due to interactions between the C=C pi-orbitals and the H atoms (or the C-H sigma*-orbitals).
Anti 2 Ci Conformation
The structure of the anti 2 conformation of 1,5-hexadiene was drawn in Gaussview 3 and optimised using the method HF/3-21G.
The optimised structure had the following structure, energy and symmetry: File:ANTI2 OPT.LOG
Return to Main Page.
The energy of -231.69253506 a.u. was found to agree with that given in Appendix 1, -231.69354 a.u. . The Ci symmetry was also found to be the same.
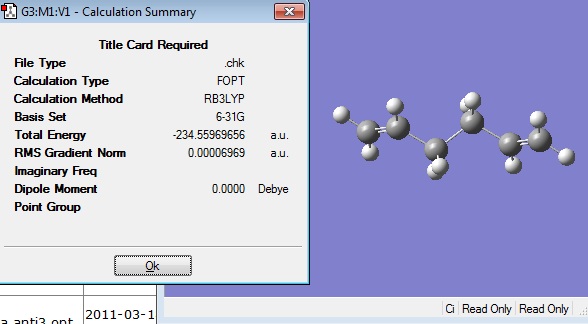
This optimised structure was then reoptimised at DFT B3LYP/6-31G level.
The optimised structure had the following energy and symmetry: File:ANTI2 OPT 6 31G.LOG
The energy of this optimised structure was slightly different to the energy given in the appendix, -234.611710, therefore another attempt was made to optimise the anti 2 conformer.
Once again, the 3-21G optimised structure was used to create an input file , with optimisation to a minimum as the job type, DFT/B3LYP as the method and 6-31Gd as the basis set. This input file was submitted to SCAN.
The completed calculation gave the following structure:
This energy is closer to the energy given in the appendix, -234.611710, although there is still a slight difference.
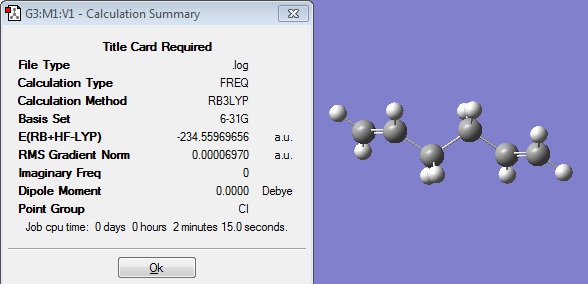
Therefore it was decided to carry out a opt+freq calculation in order to attempt to minimise the energy slightly further, and also to obtain some thermochemistry information. The method was kept the same as DFT/B3LYP and the basis set 6-31Gd.
The opt+freq calculation gave the following structure:
It can be seen that this optimisation did indeed further minimise the energy of the structure from the previous optimisation, although it is now slightly below the energy of that given in the appendix. No imaginary frequencies have been calculated, which indicates that this is a minimum energy structure of the anti 2 conformer.
The energy of both anti 2 structures optimised using the different methods of calculation cannot be directly compared because the total energies that are given following a calculation is highly dependent on the method that has been used for that calculation, and the details of the calculation such as the basis set. In this instance, two difference methods were used (Hartree-Fock and DFT), as well as different basis sets (3-21G and 6-31G).
However, it is possible to compare the two structures obtained from the different methods by comparing their geometries after the calculation.
| C1-C2 | C2-C3 | C3-C4 | C4-C5 | C5-C6 | C1-H | C2-H | C3-H | C4-H | C5-H | C6-H | |
|---|---|---|---|---|---|---|---|---|---|---|---|
| 3-21G | 1.32 | 1.51 | 1.55 | 1.51 | 1.32 | 1.07 | 1.08 | 1.09 | 1.09 | 1.08 | 1.07 |
| 6-31G | 1.33 | 1.50 | 1.55 | 1.50 | 1.33 | 1.09 | 1.09 | 1.10 | 1.10 | 1.09 | 1.09 |
It can be seen that the higher level 6-31G results in roughly the same C-C bonds lengths but slightly longer C-H bonds than the lower level 3-21G.
The angles in both structures were almost indentical, including the angles around the double bond, and the dihedral angle about the central C-C-C-C .
Therefore, it can be concluded that the two different methods used to optimise anti 2 both yield the same general structure, with very little change in the bond lengths and angles.
It can therefore be concluded that in this case and similarlysimple cases, it is reasonable to first carry out a rough optimisation using a lower level method, followed by a higher level method to give a better and more accurate optimised structure.
Frequency Analysis
As mentioned previously, the opt+freq calculation at the 6-31Gd level yielded no imaginary frequencies which indicated that the structure was a minimum energy structure.
The logfile was then viewed to study the thermochemistry section of the file. http://hdl.handle.net/10042/to-8059
It is known that:
- (i) refers to the potential energy at 0 K including the zero-point vibrational energy (E = Eelec + ZPE)
- (ii) refers to the energy at 298.15 K and 1 atm of pressure which includes contributions from the translational, rotational, and vibrational energy modes at this temperature (E = E + Evib + Erot + Etrans)
- (iii) contains an additional correction for RT (H = E + RT) which is particularly important when looking at dissociation reactions
- (iv) includes the entropic contribution to the free energy (G = H - TS)
| (i) Sum of electronic and zero-point energies | (ii) sum of electronic and thermal energies | (iii) sum of electronic and thermal enthalpies | (iv) sum of electronic and thermal free energies |
|---|---|---|---|
| -234.469198 | -234.461863 | -234.460919 | -234.500718 |
(i) and (iii) are slightly different to the values given in the appendix, -234.469203 and -234.461856 (a.u.) respectively.
The very first 6-31G-optimised structure from the previous optimisations of anti 2 to a minimum was also used to run a frequency calculation.
Frequency calculations give an indication of whether or not the preceding optimisation calculation was successful. When optimising to a minimum, it is expected that all vibrational frequencies are positive. When optimising to a transition state, it is expected that one of the vibrational frequecies is negative. If more than one of the vibrational frequencies are negative, it is an indication that the structure has not optimised fully. Negative vibrational frequencies are known as imaginary frequencies. The calculated values of vibrational frequencies are able to produce a simulated IR spectrum for the structure.
The method was set to DFT/B3LYP and the basis set 6-31G was used. This input file was submitted to run in Gaussian.
When the job was finished, the log file was opened, and the summary file was viewed.
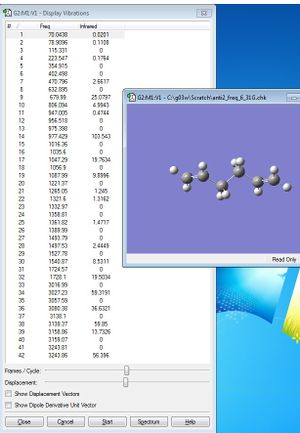

It can be seen that no imaginary frequencies were found after the calculation. This indicated that the previous optimisation of the anti 2 conformer had successfully optimised to a minimum energy structure.
The vibrational frequency values are given. The simulated IR spectrum is also given.
The output file was then opened to view the section titled "Thermochemistry".
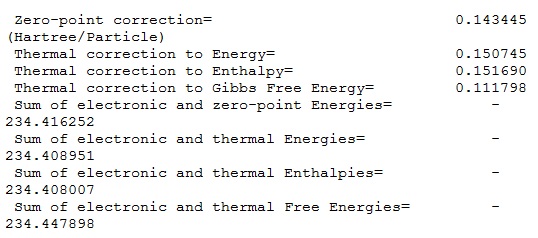
This section contained the following information:
| (i) Sum of electronic and zero-point energies | (ii) sum of electronic and thermal energies | (iii) sum of electronic and thermal enthalpies | (iv) sum of electronic and thermal free energies |
|---|---|---|---|
| -234.416252 | -234.408951 | -234.408007 | -234.447898 |
The values (i) and (ii) are now even further from the values given in the appendix, -234.469203 and -234.461856 (a.u.) than in the case shwon above.
Therefore it was decided that for the purposes of this exercise, and the exercises to follow, the thermochemistry of trans 2 conformer will be taken to be those found previously, since they were the closest to the given values:
| (i) Sum of electronic and zero-point energies | (ii) sum of electronic and thermal energies | (iii) sum of electronic and thermal enthalpies | (iv) sum of electronic and thermal free energies |
|---|---|---|---|
| -234.469198 | -234.461863 | -234.460919 | -234.500718 |
These values will be used in subsequent exercises to calculate the activation energies of the chair and boar TS structures.
Optimising the "Chair" Transition Structure
This section will involve setting up a transition structure optimisation by 1.) computing the force constants at the beginning of the calculation 2.) using the redundant coordinate editor 3.) using QST2. The reaction coordinate will be visualised, the IRC (Intrinsic Reaction Coordinate) will be run and the activation energies will be calculated for the Cope rearrangement via the "chair" and "boat" transition structures.
Firstly, an allyl fragment was drawn in Gaussview 3 and optimised using the method HF/3-21G.
The optimised structure and summary is given: File:CHAIR TS OPT AND FREQ BERNY.LOG
Two of these allyl fragments were then used to draw a rough chair transition state, with the structure shown. The distance between the two fragments was set to roughly 2.2 angstrom.
This initial rough structure for the chair transition state was used to create an input file for the optimisation of the chair transition state. The calculation was set to "opt+freq", "optimisation to a TS (Berny)", "force constants once" and the additional keywords "opt=NoEigen" were added.
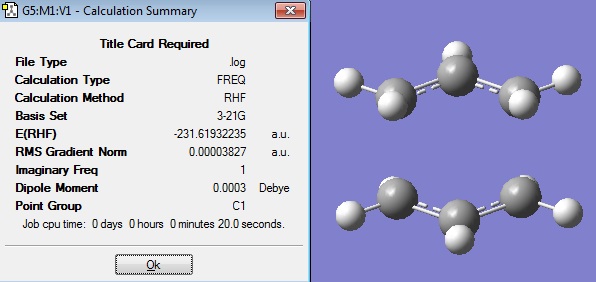
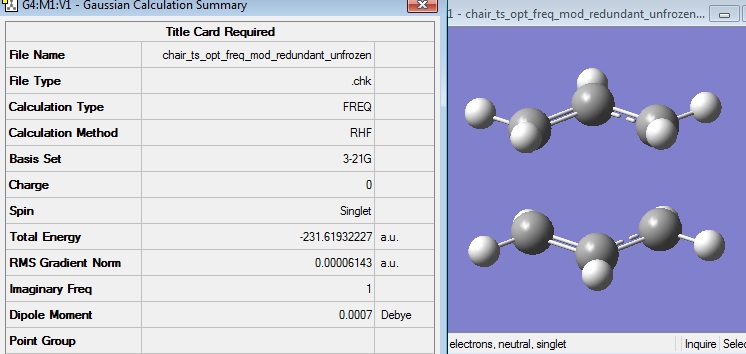
After this calculation had run, the log file was opened and the structure and summary was viewed:
The energy of this optimised chair transition state was seen to be equal to that given in the Appendix -231.619322 a.u.
It can be seen that one imaginary vibration was calculated, as expected for a transition state.
The vibrational frequencies were viewed and it was seen that the imaginary frequency had a value of 818 cm-1, as shown.

Mod Redundant Method
The initial rough structure for the chair transition state was then used to carry out an optimisation of the transition state using the frozen coordinate method.
The "Redundant Coord Editor" was used, and coordinates were added by clicking on the icon. Two terminal carbon atoms from both fragments which are involved in one bond formation/breaking were selected, "bond" was chosen, and "freeze coordinate" was chosen.
The icon was used to generate another coordinate. This time the two terminal carbons on the other end of both fragments were chosen, and the same selections were made.
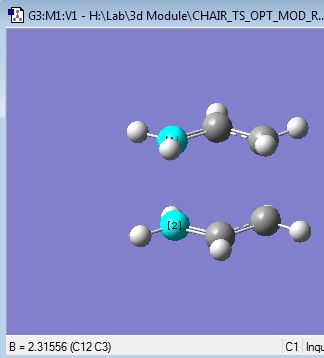
It was known that the distance between the terminal C atoms on the two fragments was 2.2 on one end, and 2.31 on the other end.
Now an input file was created for an "optimisation" to a "minimum" and it was seen that "opt=modredundant" was already in the input line. This was submitted to Gaussian. File:CHAIR TS OPT MOD REDUNDANT.LOG
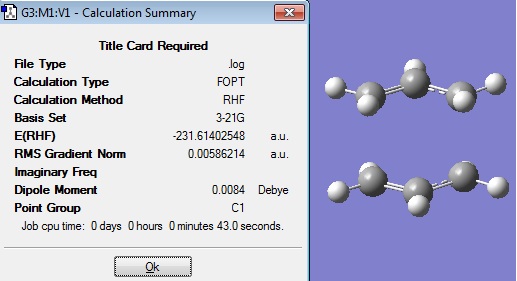
After the calculation was done, the checkpoint file was opened and it was seen that the structure was very similar to the transition that was obtained in the earlier optimisation, when the calculation was for "opt+freq" and the optimisation was to a "TS(Berny)".
It could be seen that the energy was not yet the expected minimum energy of -231.619322 a.u.
It was seen that the distances between the fragments, ie. the bond forming/breaking distances were still 2.2 and 2.3 angstrom.
Now to unfreeze the reactive coordinate of the previously "frozen" optimisation, the "Redundant Editor" was used to create a new coordinate. Two of the C atoms which were frozen in the previous optimisation were now selected and "bond" and "derivative" were selected. The same was done for the other pair of C atoms.
Now a calculation was set up for "opt+freq" to a TS(Berny), and force constants was kept as "never". The name of the file was changed in Link 0 and this was submitted to Gaussian to calculate. File:CHAIR TS OPT MOD REDUNDANT UNFROZEN 2.LOG
When this calculation had finished, the checkpoint file was opened, and the optimised transition state had the following structure.
The structure was summary was viewed:
The energy of this optimised chair transition state was seen to be the same as given in the Appendix -231.619322 a.u.
It can be seen that one imaginary frequency had been found, and this was seen to have a value of -817.86 cm-1, as shown.
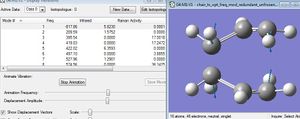
The imaginary vibration was visualised:
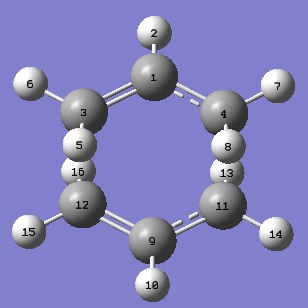
In order to compare the final geometries of the structures after both methods of optimisation, the two structures were labelled as follows: (Berny on the left, Mod Redundant on the right)
| C11-C4 | C12-C3 | C11-C9 | C9-C12 | C4-C1 | C1-C3 | C-H | C-H | C3-C1-C4 | C12-C9-C11 | ||
|---|---|---|---|---|---|---|---|---|---|---|---|
| Berny | 2.02 | 2.02 | 1.39 | 1.39 | 1.38 | 1.39 | 1.07 | 1.08 | 120.5 | 120.5 | |
| mod redundant | 2.02 | 2.02 | 1.40 | 1.40 | 1.39 | 1.39 | 1.07 | 1.08 | 120.5 | 120.5 |
It can be seen both methods of optimisation yield the same optimised structure as there is very little difference in the bond lengths and angles shown above.
Therefore it can be concluded that for a relatively small system such as the one under study here, our initial guess is close enough to the transition state structure for both the "optimisation to TS(Berny)" and "frozen cooradinates" methods to give a reasonable structure for the TS. The "frozen cooridnates" method is known to be a faster and cheaper method but in the current case, the system is relatively small and the TS structrue was relatively easy to predict and therefore both methods took roughly the same amount to calculate and gave very similar optimised structures.
Optimising the "Boat" Transition Structure
The method for optimisation will be the QST2 method, in which the reactants and products are specified and the calculation will interpolate between the two structures in order to find the transition structure between them. It is essential that the atoms in the reactants and products are numbered in the same way, and this will need to be done manually in this exercise, to ensure that the products molecule will correspond to the numbering that would be obtained if the reactant molecule had rearranged.
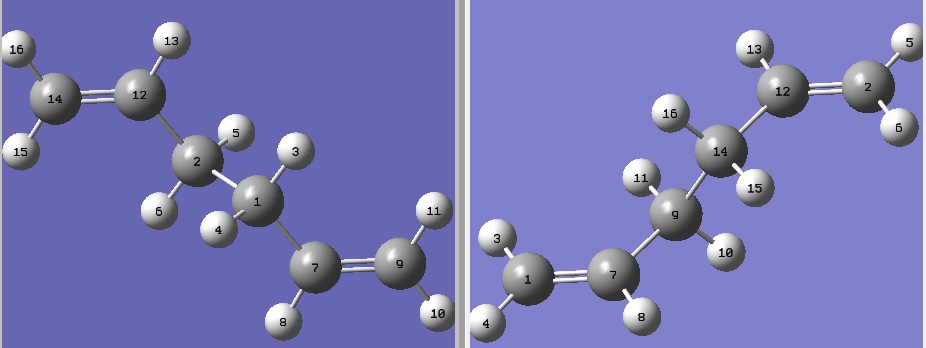
Firstly, the 6-31G optimised anti 2 reactant molecule input file was opened. This molecule was copied and pasted into two new windows so that a reactant window and a product window could be viewed side-by-side.
The atoms labels were edited so that the labels for the product molecule corresponded to the labels for the reactant molecule.
A calculation was then set up for "opt+freq" to optimise to the transition state "TS(QST2)", and the Link 0 was edited for 250MB. This was submitted to Gaussian to run.
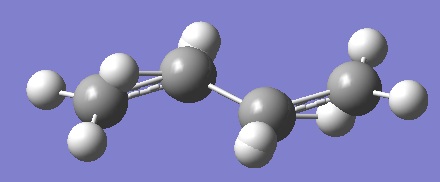
When the calculation failed, the checkpoint file could not be opened, so the log file was opened instead. The failed structure is shown. File:BOAT OPT FREQ FAIL.LOG
It is known that when the calculation linearly interpolated between the two structures, it simply translated the top allyl fragment and did not consider rotation around the central bonds. Therefore it is clear that the QST2 method will not be able to locate the boat transition structure, starting from the reactant and product structures shown above.
The original input file used for the above QST2 calculation was then used to modify the reactant and product geometries in order to get them closer to the boat transition structure.
The central C-C-C-C dihedral angle was modified to 0 degrees, and the two inner C-C-C angles were modified to 100 degrees.
It was found that the product molecule had to once again be re-numbered in order to correspond to the reactant molecule.
This was set-up for another QST2 calculation as before, and submitted to Gaussian to run. File:BOAT OPT FREQ.LOG
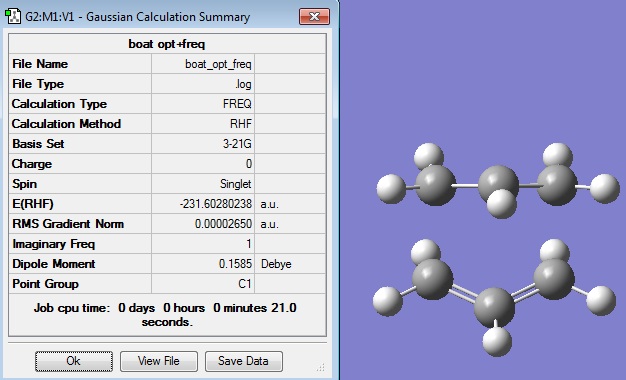
When the calculation was successfully completed, the log file was opened in Gaussview 5 to give the following structure and summary:
The energy agreed with that given in the Appendix, -231.602802 a.u.
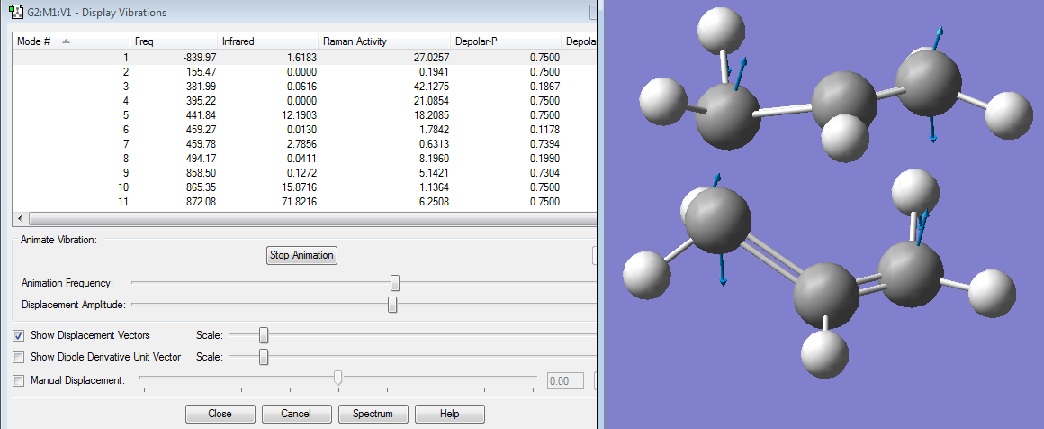
Only one imaginary frequency was found, as expected, and this was visualised.
It can be seen that although the QST2 method allows the transition state to be found in essentially one step, more effort is required in preparing the relative structures of the reactant and product. Consideration must also be put into the form of the transition state and hence the form that the reactant and product molecules should take in order for the calculation to work.
Looking at the structures of the optimised chair and boat TS, it is difficult to predict which conformer of hexadiene will form as the product. Therefore the next section will involve an IRC calculation which will aim to optimise the TS to a minimum energy structure, and hence give the structure of the predicted product.
IRC (Intrinsic Reaction Coordinate) Method
The checkpoint file of the mod redundant optimised chair transition state was opened in Gaussview 5 and an input file was created. "IRC" was selected as a job type, "forward direction" and "once" were chosen and the number of points along the IRC was changed from 10 to 50. This was submitted to Gaussian.
When the calculation was not able to complete but the log file was opened up to give the following structure and summary:
It was seen that this structure was optimised after 37 steps, however the final energy, -231.67232608 a.u. did not match with any of the anti or gauche structures given in the appendix. It was noted that this energy was higher than any of the energies listed in the appendix, therefore it could be concluded that this calculation had not fully minimised the energy of the structure yet.
This could also be seen from looking at the IRC plot from the calculation, showing the change in the total energy during the course of the calculation, as well as the change in the gradient during the course of the calculation.
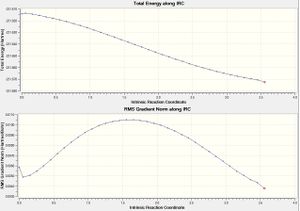
The first plot shows that the calculation is converging in the right direction because the total energy is decreasing.
The second plot shows that the gradient is also decreasing as expected, but the important thing to note is that it has not decreased to zero and therefore a stationary point has not been found following the calculation.
It was thus known that the structure obtained from this IRC calculation was not yet the minimum geometry, so this structure was further minimised (i). An input file was created to do an optimisation to a minimum as the job type, using the same method and basis set as previously, HF/3-21G.
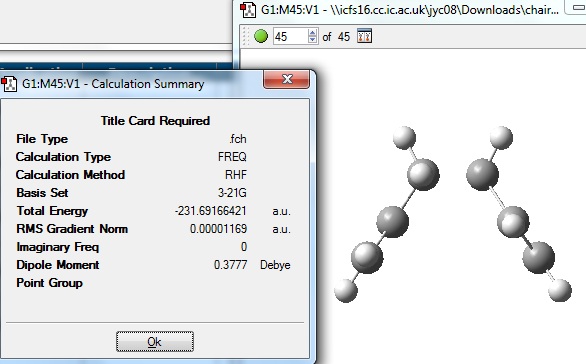
After the minimisation, the following structure and summary was obtained:
The energy of this structure was seen to match with the energy of the gauche 2 conformer, -231.69167 a.u. given in the appendix, therefore it could be concluded that this minimisation had successfully found the product conformer that the chair TS would form.
Another IRC calculation (iii) was run using 100 points, during which the force constants were set to calculate at every step of the iteration.
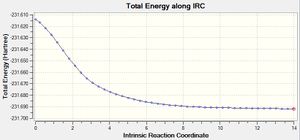

The energy of this structure agrees closely with the energy of the gauche 2 conformer given in the appendix, -231.69167, as expected
The IRC path shows that this calculation optimised the structure successfully.
The first plot of the total energy shows that the energy has been optimised to a minimum, and the second plot shows that the gradient has converged successfully to zero, to a stationary point.
If this IRC plot (iii) is compared to that obtained in the initial IRC calculation, in which the force constants were only calculated once and only 50 steps were used, it can be seen that the total energy of (iii) reaches a lower value and has a more flat plateau. This probably owes to the fact that 100 steps were used in calculation (iii) whereas only 50 steps were used in the initial calculation.
The gradient from the initial IRC calculation does not reach zero, whereas the gradient in calculation (iii) reaches zero and also has a plateau. This is again owing to the larger number of steps used in (iii) and hence the calculation is allowed to continue until a stationary point has been found.
Therefore it can be concluded that it is preferable to use many steps in an IRC calculation because this gives the calculation the chance of reaching a stationary point. It was found in this system that 100 points were sufficient for the stationary point to be found, but this may be more for larger or more complicated systems.
Activation Energies
Chair
The checkpoint file of the mod redundant optimised Chair transition state was used to create an input file to re-optimise the structure at a higher level. The job type was chosen as optimise to "TS(Berny)", the method was "DFT/B3LYP/6-31G" and "opt=noeigen" was added as additional keywords. This was submitted to SCAN.
The output file was viewed: http://hdl.handle.net/10042/to-8192
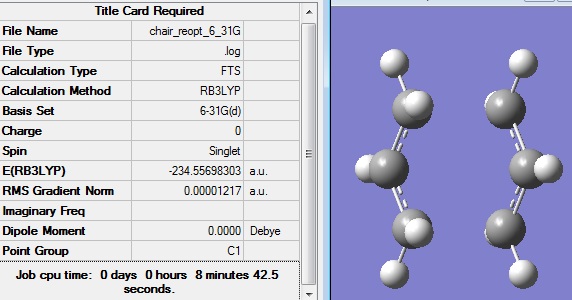
It was seen that the energy of the optimised structure agreed with the energy given in the appendix, -234.556983 a.u.
The geometry of the 3-21G optimised and the 6-31G optimised structures were compared:
| Distance between 2 fragments | C-C bond lengths | C-H bond lengths | central C-C-C angle within fragment | H-C-H angle within fragment | |
|---|---|---|---|---|---|
| 3-21G | 2.02 | 1.40 | 1.08 | 120.5 | 113.8 |
| 6-31G | 1.98 | 1.41 | 1.09 | 120.0 | 112.5 |
It can be seen that the inter-fragment distance is shorter for the higher level 6-31G than the lower level 3-21G. The higher level 6-31G gives slightly longer bond lengths, and slightly smaller angles. However, these differences in bond distances and angles between the two levels of theory are in fact very small, and it can be seen that the geometries of structures optimised using either method are indeed very similar.
Therefore it can be concluded that when optimising a particular structure it is reasonable to firstly optimise it at a lower level, which would give a good estimate of the optimised structure, and subsequently to optimise this structure using a higher level theory to give a more accurate optimised structure.
A frequency calculation was now going to be done in order to obtain the thermochemistry information.
The optimised structure was used to create the input file, setting the job type as "frequency", using the same method of "DFT/B3LYP/6-31G" and "opt=noeigen".
The calculation gave the following structure:
The vibrational frequencies were viewed:

It was confirmed that the chair TS had been successfully found in the above optimisation due to the single negative vibrational frequency -565.54 cm-1.
The log output file was viewed to look for the Thermochemistry information:
File:Chair freq AFTER OPT 6 31Gd.out
The output file for Chair 3-21G is File:CHAIR TS OPT AND FREQ BERNY.LOG
The output file for anti2 3-21G is File:Anti2 freq.out
The output file for anti2 6-31G is File:Anti2 freq 6 31Gd.out
The thermochemistry data will then be used to calculate the Activation Energy of the formation of both the chair and the boat transition state, from the anti 2 reactant.
Boat
The structure obtained from the QST2 optimisation was used to create an input file for the re-optimisation of the boat transition state structure. The job type was chosen as opt+freq and the method was DFT/B3LYP 6-31Gd.
The reoptimisation and frequency calculation gave the following structure and summary:
The vibrational frequencies were viewed to check that this structure was indeed a transition state:

It can be seen that one negative vibrational frequency had been calculated, which corresponded to -530.58 cm-1.
The logfile was then viewed to collect the thermochemistry data.
File:BOAT REOPT FREQ 6 31GD.LOG
All of the Thermochemistry data was collected, from the anti 2, chair and boat optimisations at both the 3-21G and 6-31G levels.
| HF/3-21G | B3LYP/6-31G* | |||||
|---|---|---|---|---|---|---|
| Electronic energy | Sum of electronic and zero-point energies | Sum of electronic and thermal energies | Electronic energy | Sum of electronic and zero-point energies | Sum of electronic and thermal energies | |
| at 0 K | at 298.15 K | at 0 K | at 298.15 K | |||
| Chair TS | -231.619322 | -231.466703 | -231.461342 | -234.556983 | -234.414929 | -234.409008 |
| Boat TS | -231.602802 | -231.450932 | -231.445303 | -234.543093 | -234.402340 | -234.396006 |
| anti2 | -231.692535 | -231.539542 | -231.532571 | -234.611710 | -234.469198 | -234.396006 |
From this data, the energies in Hartree were converted to kcal/mol and from this, the activation energies were able to be found.
| HF/3-21G | HF/3-21G | B3LYP/6-31G* | B3LYP/6-31G* | Expt. | |
| at 0 K | at 298.15 K | at 0 K | at 298.15 K | at 0 K | |
| ΔE (Chair) | 45.71 | 44.70 | 34.05 | 33.17 | 33.5 ± 0.5 |
| ΔE (Boat) | 55.60 | 54.76 | 41.95 | 41.32 | 44.7 ± 2.0 |
This results were found to be in good agreement with those given in the Apendix. It can be seen that the higher level 6-31G method gave results which were closer to experimental values than the lower level method, despite both methods giving very similar structures as discussed above.
This thermochemistry information confirms that the chair TS has a lower activation energy than the boat TS and thus, under kinetic conditions, the chair will be the predominant product.
The Diels Alder Cycloaddition
The Diels Alder cycloaddition reaction between butadiene and ethylene will be the subject of the following exercise. This is a reaction in which the π-orbitals of the dienophile (ethylene) form new σ-bonds with the diene (butadiene), also via the π-orbitals of the diene.
The concerted and stereospecific mechanism of a Diels Alder reaction is determined by the nodal properties of the two reactant fragments. The reaction is allowed when the HOMO of one reactant can interact with the LUMO of the other reactant.
Interaction is dependant on the the amount of overlap of electron density, which in turn is determined by the MOs of each reactant. When the symmetry properties of the MOs of both reactant fragments are the same, then overlap is possible and the reaction is allowed.
Furthermore, substituted dienophiles might feature substituents with π-orbitals that might interact with the new double bond which is formed during the Diels Alder reaction, and if this interaction is able to stabilise a particular regiochemistry, then this regiochemistry may be the predominant product.
It is clear that the factors which control the nature of the transition state are quantum mechanical, therefore quntum mechanical methods will be used in the following exercise.
It is known that during the reaction of cis-butadiene with ethylene, shown, the principle orbital interactions involve the π/π*-orbitals of ethylene and the HOMO/LUMO of butadiene. This is a [4s+2s] reaction because the butadiene has 4 electrons in its π-system and ethylene has 2 electrons in it π-system. The s refers to the symmetry of the orbitals of butadiene and ethylene with respect to the plane of symmetry going through both fragments.
In this case, it is the HOMO of ethylene and the LUMO of butadiene which interact to result in a reaction, and both of these are symmetric,
The two new σ-orbitals which are formed in the product have antisymmetric symmetry.
cis-Butadiene and ethylene MOs


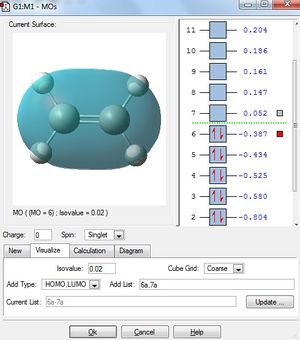
Cis-Butadiene was drawn in Gaussview, and optimised to minimum using the semi-empirical AM1 method.
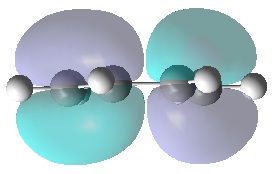
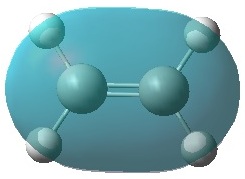
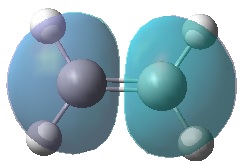
The HOMO and LUMO of the optimised butadiene were visualised. The visualisation of these are shown in the table below.
The same optimisation was done for the ethylene reactant, to give the optimised structure and summary shown. File:BUTADIENE FREQ.LOG
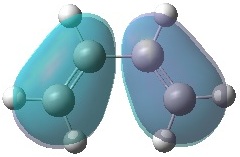
Below shows the HOMOs and LUMOs of both the butadiene and ethylene reactants.
 |
 |
 |
 |
 |
 |
 |
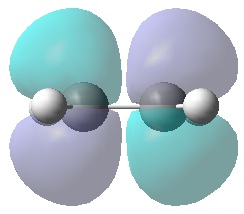 |
It can be seen that, just as expected, the HOMO of the ethylene and LUMO of butadiene are both symmetric with respect to the mirror plane, whereas the LUMO of ethylene and HOMO of butadiene are anti-symmetric. Any interactions between the two reactant fragments must take place between these specific pairs in order to have the same respective symmetry and therefore orbital interaction.
Computation of the T.S. Geometry and Examination of the Reaction Path
The transition state of the Diels Alder cycloaddition has an envelope type structure in order to maximise the overlap between the π-orbitals of the ethylene and the π-orbitals of the butadiene.
The initial guess geometry can be obtained by building a bi-cyclic system and then removing a fragment of this bicyclic system.
The distance between the two reactant fragments must also be estimated initially.
This initial guess structure of the T.S. can then be optimised in order to characterise the transition structure, and also confirmed following optimisation.
Once the correct T.S. structure has been obtained, the HOMO and LUMO will be plotted.
Optimisation of Ethylene and cis-Butadiene TS
The bicyclic template in Guassview was used to draw the initial guess structure for the transition state. A CH2-CH2 frragment was removed, and a double bond was added to give the following structure:
An input file was created using this structure, the job type was "opt+freq", the optimisation was set to "TS(Berry)" and the force constants were set to calculate "once".
The method was Semi Empirical/AM1 and the additional keywords "opt=noeigen" were added. This optimised structure gave the following structure: File:TS BICYCLIC OPTFREQ AM1.LOG

The bond distances of the optimised structure are given below:
| Partly formed C-C bonds | "sp3" C-C | "sp2" C-C |
|---|---|---|
| 2.12 | 1.38 | 1.40 |
The sp3 and sp2 bond distances have been assigned according to the hybridisation of the product structure.
It was found in literature[2] that an sp3 C-C bond is 1.54 angstrom and an sp2 C-C bond is 1.47 angstrom. The Van der Waals radius is 1.7 angstrom for a carbon atom.
Comparison of the literature values with the bond distances found from the optimisation show that the calculation gave shorter bond distances than expected for the sp3 and sp2 C-C bonds.
However, the partly formed C-C bond distance of 2.12 is much larger than either of the sp3 and sp2 C-C bonds distances from literature. This is expected, since these two bonds are only partially formed in the transition state, and they form during the approach of one reactant onto another and therefore these partial bonds are expected to be longer than normal bonds.
It can be seen that the partially formed bond distances are shorter than twice the VdW radius, which indicates that there is some level of bonding present, even if the bonds are not yet fully formed.
The imaginary frequency of the optimised TS was found to be -955.62 cm-1.
It can be seen that the imaginary frequency, ie. the frequency of the transition state, involves the making and breaking of the two bonds on either side of the two fragments in a concerted motion and therefore it is synchronous.
The lowest positive frequency vibration was found to be asynchronous at 146.77 cm-1.
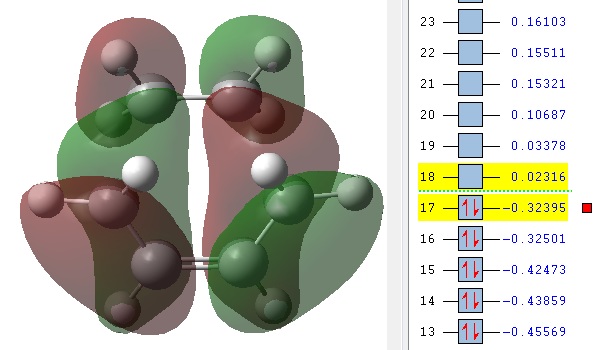
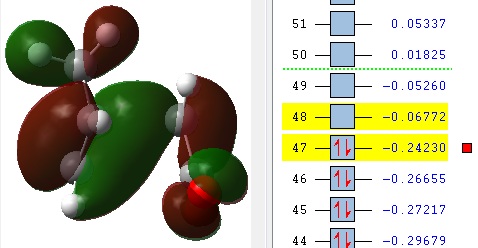
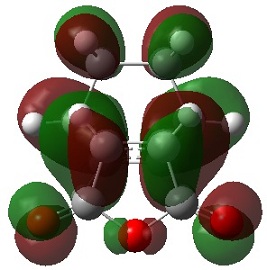
The checkpoint file was used to visualise the HOMO and LUMO:
| HOMO |  |
 |
 |
 |
 |
| LUMO |  |
 |
 |
 |
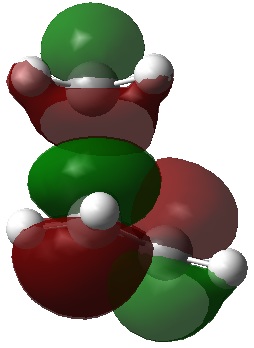 |
It can be seen that the HOMO is anti-symmetric with respect to the plane of symmetry, whereas the LUMO is symmetric. On this basis, upon comparison with the symmetries of the HOMO and LUMO of both ethylene and butadiene above, it can be concluded that the anti-symmetric HOMO shown here is made from the interaction between the HOMO of butadiene and the LUMO of ethylene, both anti-symmetric; whereas the symmetric LUMO shown here is made from the LUMO of butadiene and HOMO of ethylene, both symmetric.
This can be confirmed by studying the visualised MOs, which validates this conclusion.
Regioselectivity of Diels Alder
The reaction between cyclohexadiene and maleic anhydride undergoes a Diels-Alder reaction from which two products are possible.
The following exercise will involve the calculation of the transition state structures endo and exo, and the subsequent study of their relative structures, geometries and finally their HOMO.
Exo TS
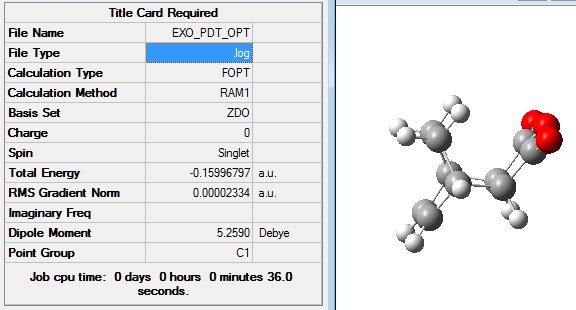
Firstly, the exo product was drawn in Gaussview 5 and optimised in order to generate the lowest energy structure. The job type was optimisation to a minimum and the method semi=empirical/AM1 was used.
The optimised exo product had the following structure and summary: File:EXO PDT OPT.LOG
The optimised product molecule was then modified to make it resemble the exo transition state. The two sigma bonds which are formed during the reaction were removed from the optimised product structrue, and the distance between the two fragments were adjusted to roughly 2.2 angstrom. The double bond in the optimised product were also changed to delocalised bonds.
The guess of the transition state structure:
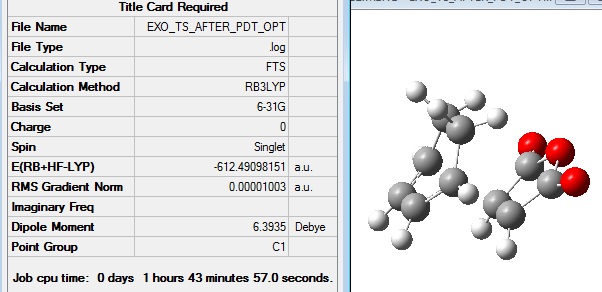
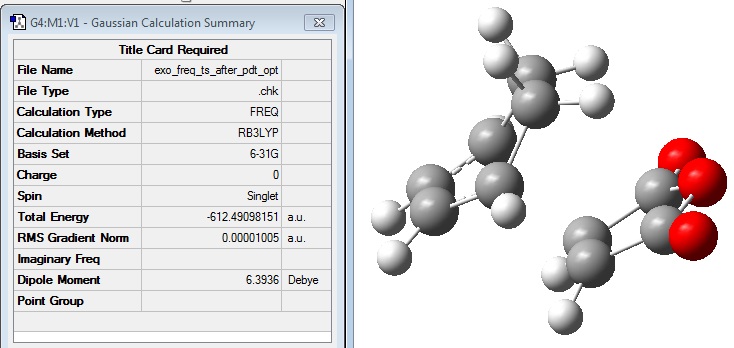
This guess of the transition state structure was then optimised to a transition state using the B3LYP/6-31G method to give the following structure: File:EXO TS AFTER PDT OPT.LOG
A frequency calculation was then run with this optimised structure, using the same method as the optimisation, to confirm that a transition state had indeed been found.
The frequency calculation gave the following summary file: File:EXO FREQ TS AFTER PDT OPT.LOG
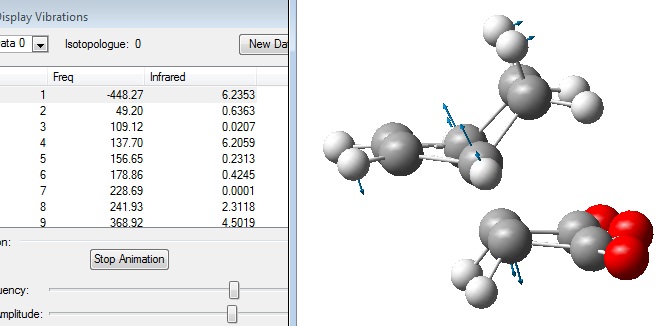
The calculated frequencies were viewed to confirm that a transition state had been calculated:
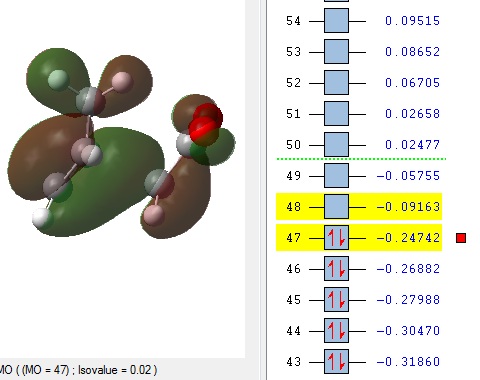
The HOMO of the optimised exo transition state was visualised:
Endo TS
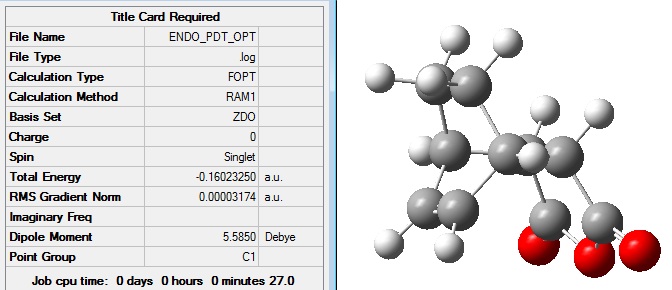
The endo product was drawn in Gaussian and optimised to give the lowest energy structure.
This optimised structure was then modified to resemble the endo transition state by removing the inter-fragment bonds and setting the distance between the two fragments to 2.2 angstrom.
The guess structure is given:
https://wiki.ch.ic.ac.uk/wiki/index.php?title=Special:Upload
This structure was used to create an input file with the job type Opt+freq, the method DFT/B3LYP and the basis set 6-31Gd. The additional keywords opt=noeigen were added, and this was submitted to SCAN.
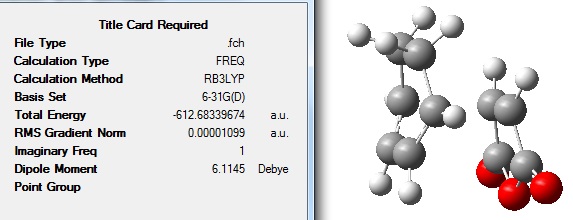
When the calculation was complete, the file was opened: http://hdl.handle.net/10042/to-8191
It can be seen that the energy of this endo TS is lower in energy than the exo TS. The two different structures can be compared in terms of energy because the same method has been used in their calculations.
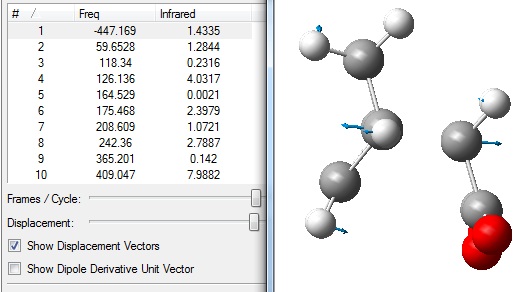
The fact that 1 imaginary frequency was calculated was indicative that a true transition state had been reached.
The vibrational frequencies were visualised:
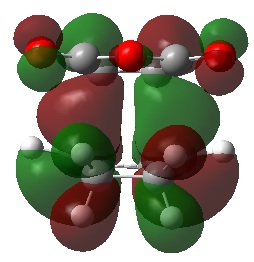
The HOMO of the optimised endo structure was visualised:
Comparison of Exo and Endo TS Structures
The energy of the exo TS was found in this exercise to be -612.49098 a.u. whereas the endo was -612.68339 a.u. which agreed with the expected result that the endo would be lower in energy. This is because it is known that the reaction of maleic anhydride and cyclohexadiene is a kinetically controlled reaction resulting in the endo product, therefore the endo TS should be lower in energy.
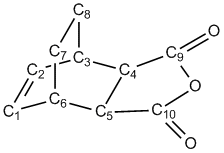
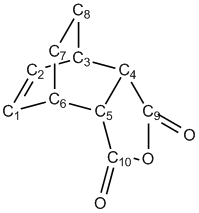
In order to compare the structural differences between the two transition states, the two structures were labelled as follows, and the bond distances and selected bond angles are given:
| C1-C2 | C2-C3 | C1-C6 | C3-C4 | C6-C5 | C4-C5 | C6-C7 | C3-C8 | C7-C8 | C4-C9 | C5-C10 | C9=O | C10=O | C9-O | C10-O |
|---|---|---|---|---|---|---|---|---|---|---|---|---|---|---|
| 1.40 | 1.40 | 1.40 | 2.29 | 2.29 | 1.41 | 1.52 | 1.52 | 1.56 | 1.48 | 1.48 | 1.22 | 1.22 | 1.43 | 1.43 |
| C1-C6-C5 | C2-C3-C4 | C7-C6-C5 | C8-C3-C4 |
|---|---|---|---|
| 94.9 | 94.9 | 99.2 | 99.2 |
| C1-C2 | C2-C3 | C1-C6 | C3-C4 | C6-C5 | C4-C5 | C6-C7 | C3-C8 | C7-C8 | C4-C9 | C5-C10 | C9=O | C10=O | C9-O | C10-O |
|---|---|---|---|---|---|---|---|---|---|---|---|---|---|---|
| 1.40 | 1.39 | 1.39 | 2.27 | 2.27 | 1.39 | 1.52 | 1.52 | 1.56 | 1.48 | 1.48 | 1.20 | 1.20 | 1.40 | 1.40 |
| C1-C6-C5 | C2-C3-C4 | C7-C6-C5 | C8-C3-C4 |
|---|---|---|---|
| 99.0 | 99.0 | 94.3 | 94.3 |
Considering the bond distances of the two TS structures, it can be seen that the main difference lies in the distance between the two fragments, the C3-C4/C6-C5 distance, and the bond distances involving the O atoms. The other bond distances are reasonably similar.
The inter-fragment distances are shorter in the endo TS than the exo. This can be explained by considering the possible secondary orbital interactions which are possible in the endo TS. This will be discussed in the next section.
Similarly, all of the bonds which involve O atoms are shorter in the endo TS than the exo. This can be seen by studying the MOs which are present on the C=O groups in both the exo and endo structures. It is clear that these MOs are larger in size on the endo than on the exo. Also, it can be seen from looking at the HOMOs depicted above that the central O within the ring shows some electron density in the case of the endo TS, whereas there is very little electron density around this O atom in the exo TS. The fact that the endo structure shows more electron density in this area can explain the observation that the bonds lengths are shorter in this area for the endo TS. The increased amount of electron density is able to undergo interaction and in effect this increases the bond orders in question, making the bonds shorter.
It can be seen that the C1-C6-C5/C2-C3-C4 bond angle is larger in the endo TS, whereas the C7-C6-C5/C8-C3-C4 bond angle is larger in the exo TS. This can be rationalised by considering the position of the maleic anhydride fragment with respect to the two sides of the cyclohexadiene group (C1-C2 VS. C7-C8). It is obvious that when the maleic group is facing towards the C7-C8 side (exo), the C7-C6-C5/C8-C3-C4 angle will be larger (compared to the endo) due to repulsion; whereas when the maleic group is facing C1-C2, the C1-C6-C5/C2-C3-C4 angle will be larger.
Secondary Orbital Overlap in the Exo and Endo TS
It was seen in the previous section that there was a difference in the the inter-fragment distances between the exo and endo TS structures.
This can be explained using the idea of secondary orbital interactions[3].
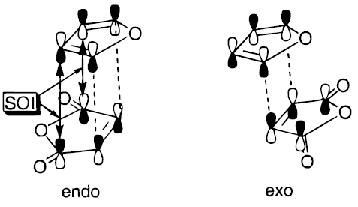
It is known that a process is allowed when the atomic orbital lobes are in-phase, and these are known as first-order orbital interactions.
Secondary orbital interactions occur when molecular orbitals, from groups of atoms which are not directly bonded, are able to interact. This usually affects the rate of a reaction, and the selectivity of the product during a reaction. As is the case here, it is the secondary orbital interations which helps explain why the endo product is lower energy and thus favoured over the exo product.
The picture[3] illustrates a Diels Alder reaction between maleic anhydride and furan, which is very similar to the reaction under study in this exercise, if the furan is replaced with cyclohexadiene. The picture shows the two different ways in which the reactants can orientate themselves for reaction, giving the possibility of an endo or exo product.
It is suggested that the endo orientation allows for 4 attractive secondary orbital interactions (SOIs), whereas the exo allows for only 2 SOIs.
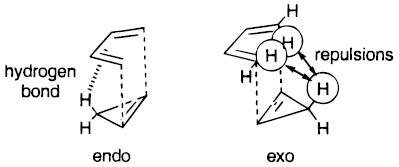
It should be noted that repulsive SOIs are also possible, as shown[3], and these interactions also show that the endo TS is expected to be more stable than the exo TS.
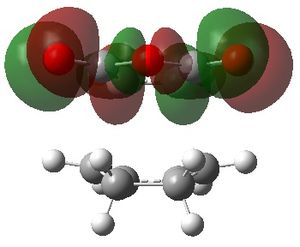
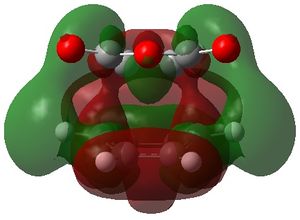
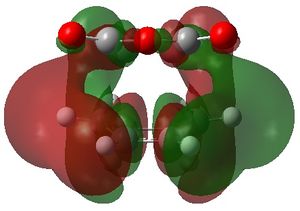
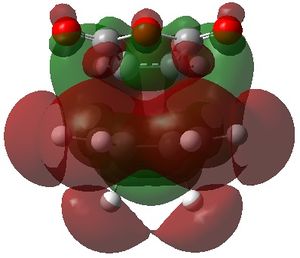
In order to illustrate this, more MOs of the exo and endo TS were further studied, in addition to the HOMOs shown above. It was expected that the endo MOs would show a lot of interaction between the two fragments to indicate that secondary orbital overlap effects were taking place and therefore were leading to the previously mentioned effects on the bond distances and the bond angles, most notably the shorter inter-fragment distance in the endo TS.
The MOs 36-60 of both the optimised exo and endo TS were visualised to look for signs of secondary orbital interactions. The table below shows selected MOs from those visualised:
| exo | endo |
 |
 |
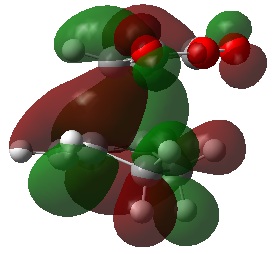
Out of all of the occupied MOs which were visualised from MO number 37 to 47, it was MO 45 that showed a clear difference between the endo and exo MOs. There is very clear presence of SOIs between the two fragments in the endo TS, whereas there is a complete absence of this inter-fragment electron density in the exo TS.
The SOI seen in the endo TS is a bonding, in-phase interaction and therefore when it is occupied by electrons as it is in this case, it will lead to a lowering of the energy of the molecule. This can therefore explain why the endo TS is slightly lower in energy than the exo MO.
It can also be noted that this SOI in the endo TS increases the amount of electron density between the two fragments in the TS, and therefore it may be responsible for causing the inter-fragment distance in the endo TS to be shorter than in the exo TS.
| exo | 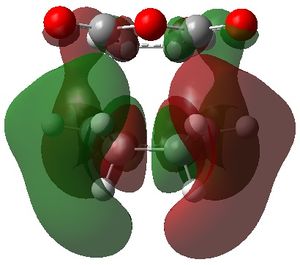 |
 |
 |
 |
 |
| endo | 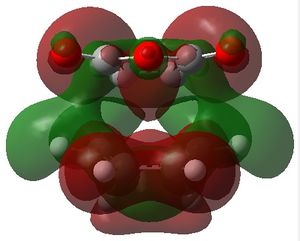 |
 |
 |
 |
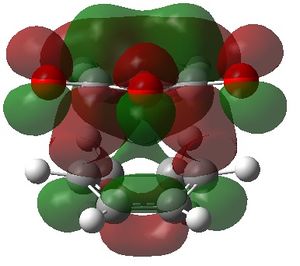 |
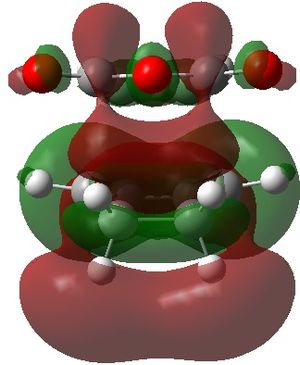
The visualised unoccupied MOs showed a higher prevalence of SOIs than the occupied MOs, both in the exo and the endo TS structures. However, it can be seen that although the corresponding occupied MOs of the exo and endo TS have similar forms, the extent of interaction is always greater in the endo TS than the exo TS.
For example, MO 57 of the exo TS shows a single SOI between the two fragments which is anti-symmetric with respect to the place of symmetry. The corresponding MO 57 of the endo TS also shows this interaction, but the endo TS has an additional interaction. The additional interaction is "behind" the first interaction, also with anti-symmetric symmetry but with opposite phase of the first.
The other unoccupied MOs shown in the table also exhibit a larger extent of SOI in the endo than the exo form. Although these MOs are currently unoccupied, if electrons are added to the system, these bonding MOs would lead to a lowering in energy of the system and it is possible that the calculated energy difference between the endo and exo TS would be even greater than it already is.
Conclusion
This exercise has demonstrated the powerful nature of computational methods to find the lowest energy structures of molecules and transition states, and using the information from these calculations, to be able to predict the preferred product of a certain reaction and also to collect data to compare to experimental data.
A number of different methods were explored and it was found that different methods would work better with different structures.
These methods were then used to study the Diels Alder reaction, which allowed the calculation of the activation energies. The calculated values were seen to agree well with experimental data, which showed that these methods could quite accurately be used to predict such characteristics of reactions.
The calculations also allowed simulated IR spectra to be predicted, allowing comparison to experimental spectra; and visualised MOs enabled an explanation of observations such as the endo-selectivity of the Diels Alder reaction.
It might be interesting to further explore the relative energies of the maleic anhydride and cyclohexadiene transition state, after having found that many secondary orbital interactions are present in the unoccupied orbitals.
References
- ↑ B. G. Rocque, J. M. Gonzales, H. F. Schaefer, Mol. Phys., 2002, 100, pp. 441-446
- ↑ S. J. Stuart, M. T. Knippenberg, O. Kum and P. S. Krstic, Phys. Scr., 2006, T124, 58 - 64 DOI:10.1088/0031-8949
- ↑ 3.0 3.1 3.2 J. I. Garcia, J. A. Mayoral, L. Salvatella, Acc. Chem. Res., 2000, 33, 658 - 664 DOI:10.1021/ar0000152


