Rep:Jp3915MgO
Investigation on Thermal Expansion of MgO
Abstract
The aim of this experiment was to compute the coefficient of thermal expansion of MgO using quasi-harmonic approximation as well as molecular dynamics simulation (MD) and investigate its thermal expansion behavior. Linear thermal expansion coefficient is calculated to be 9.63070*10-6 K-1 and 12.28886*10-6 K-1 using quasi-harmonic approximation and MD respectively.
Introduction
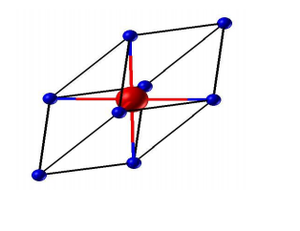
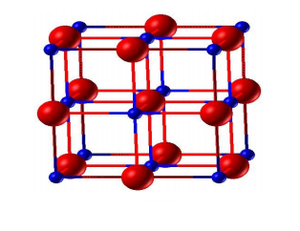
MgO is a face-centered cubic crystal with lattice parameter a=b=c. A primitive cell (figure 1) is the smallest repeatable unit and a conventional cell (figure 2) is 4 times in volume compared to that of a primitive cell.
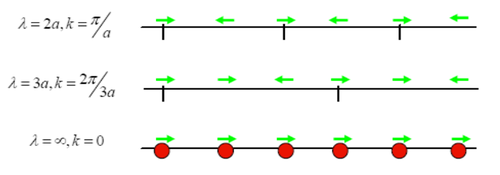
When looking at atoms vibrating in a line, wavelength λ can be determined by whether atoms are vibrating in phase or out of phase (figure 3). Wavevector k can then be determined by the equation k=2π/λ, and frequency can be determined by ωk=(4J/M)^0.5|sin(ka/2)|, where J is the force constant of the joint atom spring, M is the reduced mass and a is the lattice parameter. In a reciprocal lattice, reciprocal lattice parameter a* can be expresses as a*=2π/a. A grid of k-points can be used to sample the free energy of the reciprocal space. Shrinking factor is the number of sampling points used in one dimension. The more k-points used, the more accurate the simulation. When treating vibrations with wave-particle duality, the particle form of a vibration is called phonon. Plotting ωk against k will give the phonon dispersion curves.
In quasi-harmonic approximation the Helmholtz free energy F can be expressed as the following equation:

where E0 is the internal energy including the volume factor. The second term is the zero-point energy of different frequencies ωj,k where j is the number of branches. The third term is the entropic contribution. Thermal expansion coefficient α can be calculated using the following equation: α=1/V0 (∂V/∂T)P (equation 2), where V0 is the initial volume.
The software used is DLVisualize and the program used for molecular modelling is GULP (General Utility Lattice Program). When computing with quasi-harmonic approximation, firstly different k values are given to the program and free energy is calculated by summing over all vibrational modes. Larger k value means higher resolution of sampling which leads to more accurate results but it also means longer simulation time. So a compromise have to be made between using more accurate simulation and shorter simulation time. The optimal shrinking factor and a range of different temperature can then be given to the program and the program will generate the volume of the optimised structure, whose value can minimise the free energy of the system.
When using MD, forces are performed on atoms and motions of the atoms based on Newton’s second law are monitored by the program. Structural information will be given out when simulation settles.
Experimental Procedure
13 different k values ranging from 1 to 40 were tested and their free energy was plotted. It was found that free energy converges as k grows larger and it finally reaches a constant value of 6 decimal places, which is the highest decimal places that the program could give, when shrinking factor reaches 20. Shrinking factor of this experiment was then determined to be 25. After k was determined, 17 different temperature values ranging from 0K to 3000K were given to the program. Lattice constant obtained was plotted against temperature and coefficient of thermal expansion was calculated using equation 2.
A supercell containing 32 MgO units were used for MD simulation because the motion of every single atom was monitored therefore larger amount of samples would give simulations closer to reality. Shrinking factor used in MD was 1 since the system was 32 times bigger, the reciprocal space would be 32 times smaller than the one used in quasi-harmonic approximation and shrinking factor of 1 would be enough. 19 different temperature ranging from 100K to 5000K were given to the program. Volume obtained was plotted against temperature and coefficient of thermal expansion was calculated using equation 2.
Result and Discussion
Calculating the phonon modes of MgO
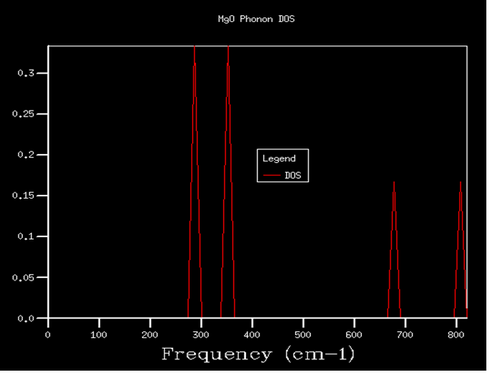
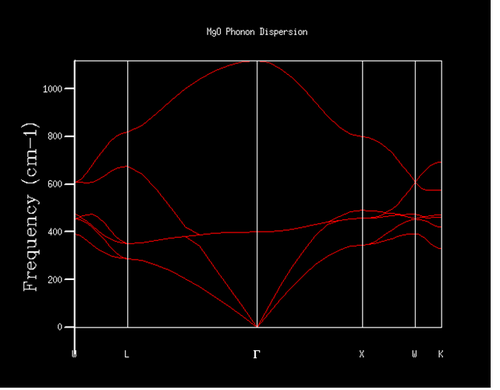
The density of states (DOS) of 1x1x1 grid was computed for a single k-point (figure 4). It can be seen from the graph that the density of the two peaks with lower frequency is twice compared to that of the two peaks with higher frequency on the right hand side. Considering this is a system with 2 atoms in 3 dimensions, which in total gives 6 branches, the corresponding k-point should have two double degenerations at around 300 and 350 cm-1 as well as two other states at around 700 and 800 cm-1. Looking back to the phonon dispersion curve (figure 5), point L fits all of the requirements above. Also when looking into the log file (figure 6), at k-point 10 and 11, where a=0.5 corresponding to point L, the data fits the requirements above as well. So the DOS of 1x1x1 grid was computed for point L.
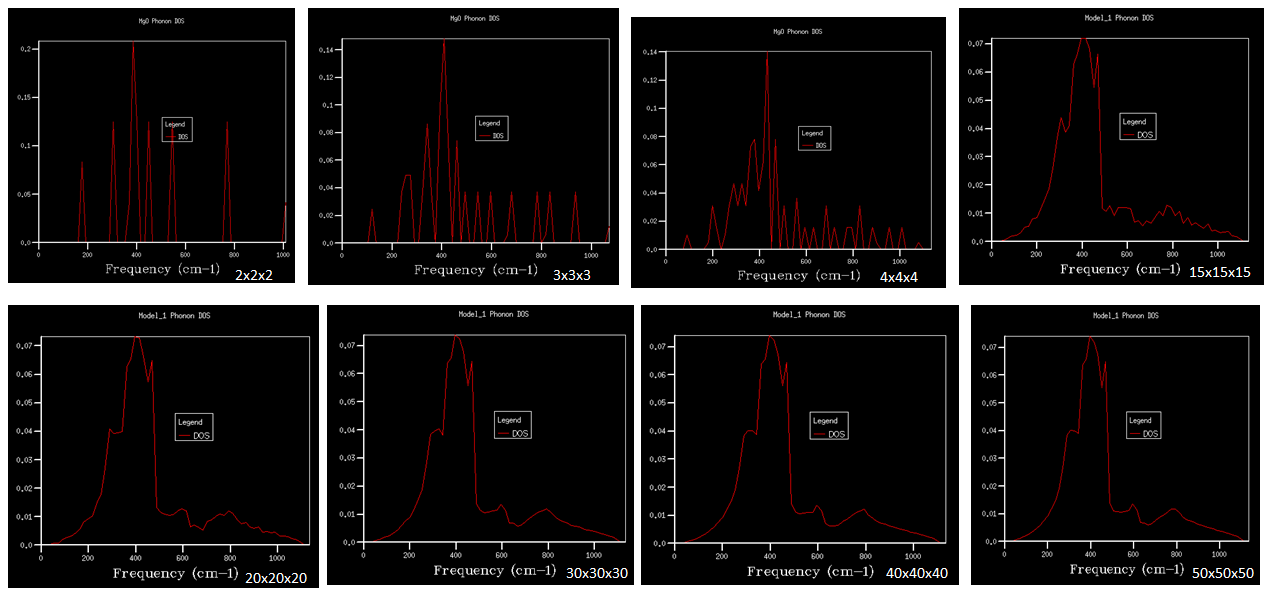
As it can be seen from figure 7 that as grid size increases, there are more peaks in DOS since there are more sampling points which will give a better resolution for simulation. As grid size reaches 30x30x30, the main feature of the curve does not change significantly any more. It can be concluded that 30x30x30 is a minimum for a reasonable approximation. There is a main peak at 400 cm-1 and there are more states in lower frequency region. Comparing to DOS obtained by lower resolution, the graph for 30x30x30 grid has a similar shape with more states populated in lower frequency region but the curve is more continuous. DOS shows how many vibrational modes there will be for a particular k-point on the dispersion curve as well as their degeneracy. What’s more, DOS is a measure of the gradient of the dispersion curves. When the dispersion curve is converging i.e. when gradient is small, more states will accumulate at this frequency so there will be a corresponding peak in DOS. On the other hand, when the dispersion curve is changing rapidly i.e. when gradient is large, there are not many states accumulating so there will be a decrease in DOS.

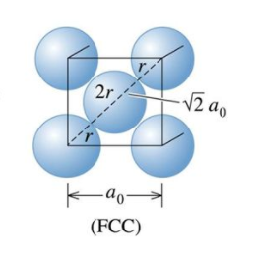
This optical grid size of 30x30x30 will be appropriate for CaO. As it is shown in figure 8, the lacttice parameter of a FCC lattice equals to M-O bond length times root two. The bond lengths of MgO and CaO are 1.743Å and 1.818Å[1] respectively so there is no significant differences in their lattice parameters. Therefore the same grid size can be used for CaO. But this grid size will not be appropriate for zeolite and metal. According to equation 2, bigger molecular size will lead to smaller reciprocal lattice space and therefore smaller shrinking factor is needed. Zeolites like Faujasite is a much bigger molecule than MgO so it needs a smaller grid size. On the other hand, the repeating unit of metal is the metal cation which is smaller than a MgO molecule so a bigger gird size is needed.
Computing the Free Energy - The harmonic approximation
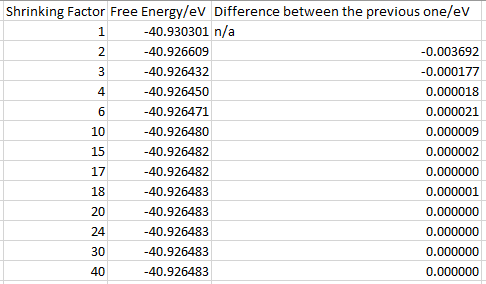
As it can be seen from figure 9 that free energy increases as shrinking factor increases from 1 to 3 then it decays and converges as shrinking factor grows larger. Table 1 shows the difference in free energy between each grid size. It can be seen that when shrinking factor goes up to 4, the decimal places of the difference increase to 5, which is appropriate for calculation accurate to 1 meV. When shrinking factor goes up to 10, the decimal places increase to 6, which is appropriate for calculation accurate to 0.5 meV. When shrinking factor goes up to 20, the difference decreases to 0, which means that only 6 decimal places are now not enough to tell the difference and it is appropriate for calculation accurate to 0.1 meV. Judging from this result and also the time needed for a certain simulation, the shrinking factor is determined to be 25 for the following simulations.

This optical grid size of 25x25x25 will be appropriate for CaO as they have similar lattice parameter. But this grid size will not be appropriate for zeolite and metal. According to equation 2, bigger molecular size will lead to smaller reciprocal lattice space and therefore smaller shrinking factor is needed. Zeolites like Faujasite is a much bigger molecule than MgO so it needs a smaller grid size. On the other hand, the repeating unit of metal is the metal cation which is smaller than a MgO molecule so a bigger gird size is needed.
The Thermal Expansion of MgO
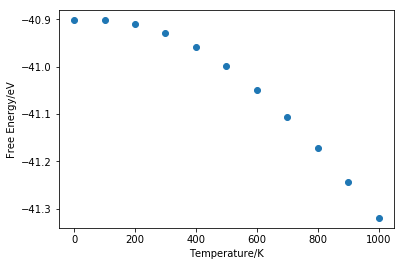
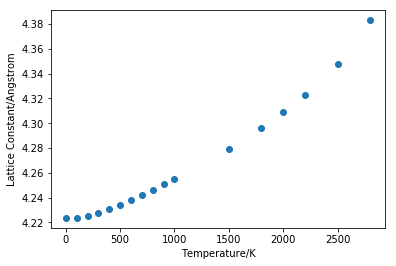

It can be seen from figure 10 that free energy increases in magnitude at an increasing rate as temperature goes up. Lattice constant stays almost constant as temperature increases from 0K to 100K then increases linearly. According to equation 1, at low temperature there is very little contribution from internal energy and entropic term. Zero energy however is independent of temperature so free energy remains almost constant. Therefore there is no significant changes in volume at low temperature. At high temperature the linearity breaks down.
From the linear part of the graph (figure 12), gradient is found to be 0.00219. Initial volume is taken as the value at 400K, the starting point of the linear region, which is 75.73003 Å3. Volumetric thermal expansion coefficient is calculated using equation 2 and it is found to be 28.89211*10-6 K-1. Linear thermal expansion coefficient is a third of volumetric coefficient and is calculated to be 9.63070*10-6 K-1. The experimental value from literature measured at 400K is found to be 12.02*10-6 K-1[2], which shows that the value obtained using program simulation is quite close to real value. When using quasi-harmonic approximation, we are assuming that the bond will never break no matter how the temperature changes because the two atoms are always vibrating inside a parabolic potential well.
When temperature of the system increases, particles inside the system will gain more kinetic energy and move faster. This will lead to larger separation between the particles and the whole system will occupy bigger volume. The melting point of MgO is 3250K[3]. As it can be seen from figure 11 that linearity breaks down as temperature goes above 2000K. With an exactly harmonic potential the equilibrium position is not changing so no matter how many energy is added to the system the average bond length stays constant and the bond will not break. By using quasi-harmonic approximation, phonon frequency ωk is now volume-dependent so thermal expansion can be modelled.
Molecular Dynamics
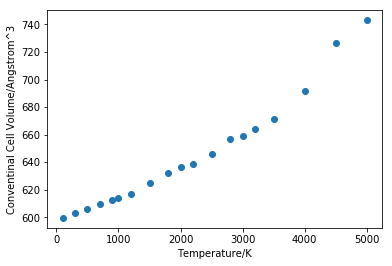
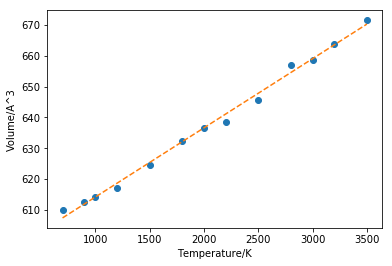
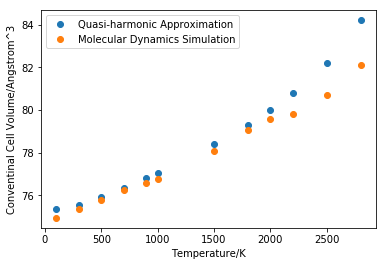
As it can be seen from figure 13 that MD also produced linearity between cell volume and temperature but the linearity fails at high temperature starting from around 4000K. The gradient of the linear region (figure 14) is found to be 0.02248. Using the volume at 700K as the initial value, the thermal expansion coefficient is calculated to be 36.86658*10^-6 K-1, which is 12.28886*10-6 K-1 for linear coefficient. The experimental value from literature measured at 700K is found to be 13.90*10-6 K-1[2] which shows that the simulation is successful.
As it is shown in figure 15, values predicted by MD are lower than those predicted by quasi-harmonic approximation. MD is based on Newton’s Law, which is classical mechanics, so there is no zero point energy and linearity starts from low temperature region. At 0K however, unit cell volume is too close to zero that the program was unable to produce the result. While quasi-harmonic approximation is based on quantum mechanics so zero point energy will lead to constant volume at low temperature. At high temperature region molecules gain kinetic energy from heating and MgO start to melt. There should be an increase in gradient after reaching the melting point. Quasi-harmonic approximation starts to lose linearity before reaching the actual melting point while MD linearity starts to deform after reaching the melting point. The reason why quasi-harmonic approximation breaks down is that harmonic approximations can not model a phase change.
The result obtained using MD is very close to that obtained by quasi-harmonic approximation in the linear region so a super cell of 32 MgO unit is enough for a reliable MD simulation.
Conclusion
Thermal expansion is modelled very successfully by quasi-harmonic approximation and molecular dynamics simulation. Linear thermal expansion coefficient is found to be 9.63070*10-6 K-1 and 12.28886*10-6 K-1 using quasi-harmonic approximation and MD respectively. The thermal expansion coefficients obtained by programing are very close to experimental values from literature. If time is allowed, lager shrinking factor or larger cell can be used for more accurate simulation. Moreover, the input data of MgO unit can be modified to CaO as they have similar structure and thermal expansion of CaO can be modelled.
Reference
[1] P. Batra, R. Gaba, U. Issar and R. Kakkar, Journal of Theoretical Chemistry, 2013, DOI: 10.1155/2013/720794
[2] A. S. Madhusudhan Rao and K. Narender, Journal of Thermodynamics, 2014, DOI: 10.1155/2014/123478
[3] C. Ronchia and M. Sheindlin, J. Appl. Phys., 2001, 90, 3325-3331
