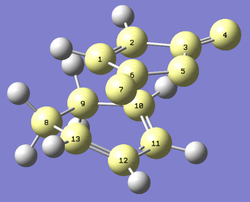
Rep:Jmt12ts
Transition States and Reactivity
This page will study the transition states in a number of different reactions. The transition state is the highest point along a reaction pathway. First, the reactants and products must be drawn and optimised in order to find the preferred transition state. GaussView and Gaussian are the software that will be used throughout this experiment. Two different levels of theory will be used in Gaussian. The first, and most simple is the Hartree Fock method. This method calculates the wavefunction of an atom in a one electron system. [1]. The second method is the more accurate, B3LYP method. These two methods will be compared by using them to optimise the same molecules in turn and comparing the resultant activation energies for each method with literature values. As well as looking at the transition states and the corresponding vibrational frequencies, the HOMOs and LUMOs of reactants and their transition states will also be analysed.
Nf710 (talk) 12:47, 18 November 2015 (UTC)Good introduction some further knowledge of The HF and DFT methods would have been nice. Such as how HF is a variational method that uses slater determinants and DFT uses functionals of the electron density.
The Cope Rearrangement
On this page, the Cope Rearrangement of 1,5-hexadiene is studied. It is an example of a [3,3]-sigmatropic rearrangement. Using GaussView and Gaussian, different conformers will be analysed in order to deduct the conformation of the transition state with the lowest energy.
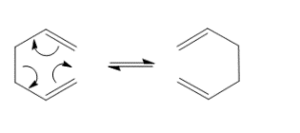
Optimising the Reactants and Products of the Cope Rearrangement
There are 10 different conformers of different energies of 1,5-hexadiene in total [2], a few of these conformers are shown in the table below.
The structures below were drawn using GaussView and then alalysed using the Gaussian calculation option. Two anti- conformers and one gauche conformer are analysed below using the HF/3-21G level of theory. The point groups of the different conformations were deducted by using the point group window in the Edit option of GaussView.
| NAME | STRUCTURE | POINT GROUP | ENERGY Hartrees HF/3-21G | SUMMARY |
|---|---|---|---|---|
| Anti2 | 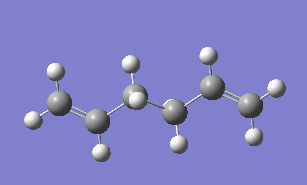
|
Ci | -231.69253528 | 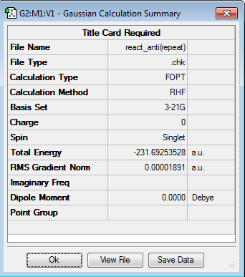
|
| Anti4 | 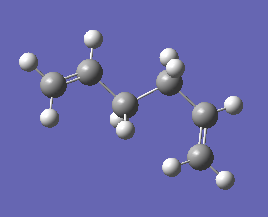
|
C1 | -231.69097055 | 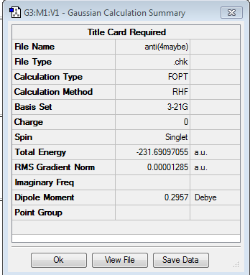
|
| Gauche3 | 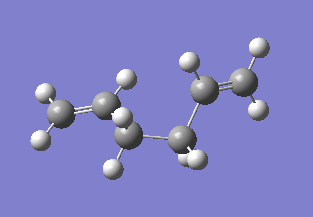
|
C1 | -231.69266120 | 
|
Referring to Appendix 1, the conformers were labelled with their appropriate names by comparing the energies and the point groups of the molecules above to the molecules in the Appendix.
As can be seen from the above table, the conformers increase in energy the order; Gauche3, Anti2 and then Anti4. It was expected that the gauche conformers would, in general, be higher in energy compared to the anti structures due to the decreased steric hinderance of the anti conformers. However, as can be seen from the above table, Gauche3 is the lowest energy structure and from the appendix, Gauche1 is the highest energy conformer. This means that Gauche3 would be the most abundant. The stabilisation in Gauche3 could be due to an interaction with the carbon double bond and the H attached to the double bond opposite.
The energy which was calculated for the anti2 conformation would equal the energy of this same conformation that is given in Appendix 1 if the value in the table above was rounded to the same number of significant figures as the value in the Appendix.
Nf710 (talk) 12:52, 18 November 2015 (UTC) Good comparison and reasoned explanation of why the gauche is lower. You could have looked at this your self by looking at the orbitals form the .chk file and seen the secondary orbital interactions between the two pi systems.
Optimising the anti2 conformer to the B3LYP/6-31G* level
After recalculating the energy of the anti2 structure at the higher level of theory, the energy was determined to be -234.55970565 a.u.
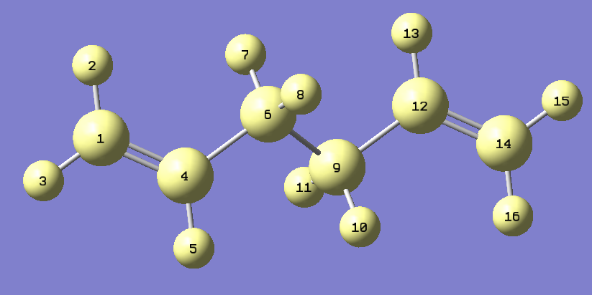
Referring to the above diagram, the below table shows how the geometry of the structure changed after the level of theory was increased:
| OPTIMISATION | ANGLE BETWEEN 1-4-6 (°) | ANGLE BETWEEN 4-6-9 (°) | BOND LENGTH 1-4 (Å) | BOND LENGTH 4-6 (Å) | BOND LENGTH 6-9 (Å) |
|---|---|---|---|---|---|
| HF/3-21G | 124.8 | 111.3 | 1.31613 | 1.50891 | 1.55275 |
| B3LYP/6-31G* | 125.2 | 112.6 | 1.33819 | 1.50739 | 1.55495 |
As can be seen from the above table, a higher level of theory increased the length between Carbon atoms 1 and 4, and also between Carbon atoms 6 and 9 but the length of the bond between atoms 4 and 6 was decreased. There was also a change in the dihedral angles; when the theory was changed from HF/3-21G to B3LYP/6-31G*, both of the angles shown in the table were increased.
Nf710 (talk) 13:14, 18 November 2015 (UTC)Good comparison of geoms, However your energy is wrong. you haven't provided the log file so i cant check if you are using the correct basis set.
Frequency calculation
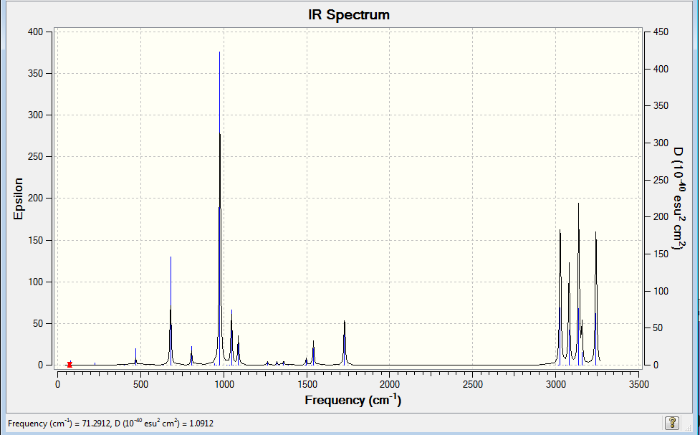
If the values for the energy are to be compared with literature values, then additional parameters also need to be assessed. One of these parameters can be a frequency calculation. This was completed on the optimized anti2 B3LYP/6-31G* molecule. The graph below shows the vibrational frequencies of this structure and the log file shows that it has been optimised to a minimum. Therefore, this is the critical point of this conformation and this is evident because all of the frequencies are real and positive.
The below table shows the energies and enthalpies of the molecule under consideration:
| Energy/Enthalpy type | Energy/Enthalpy total (hartree) |
|---|---|
| ∑ Electronic and zero-point Energies | -234.416255 |
| ∑ Electronic and thermal Energies | -234.408962 |
| ∑ Electronic and thermal Enthalpies | -234.408018 |
| ∑ Electronic and thermal Free Energies | -234.447873 |
Optimising the Chair and Boat transition structures
Optimizing the chair transition structure
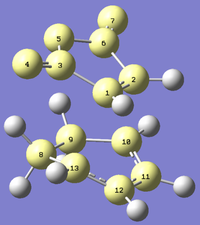
The allyl fragment below was drawn using GaussView and then optimized using theHF/3-21G level of theory. The chair structure, also below, was constructed from this. The two allyl fragments of the chair structure were set at 2.2Å apart.
The log file produced after optimization shows that the frequency is -818.0003 cm-1. This is an imaginary frequency and therefore shows that it is a maximum and a transition state. The image below shows the effect of this vibrational frequency on the molecule.
Nf710 (talk) 13:21, 18 November 2015 (UTC) This is TS(Berny) I assume.
Next, the same structure as above will be optimized using the frozen coordinate method.
First, the distance between the terminal carbon atoms of the different molecules were set to 2.20000Å and the structure below shows this molecule
The above structure with the frozen distances was then optimized again. However, this time, the bond distances were not fixed. The structure below was produced and the bond lengths between the terminal carbon atoms decreased slightly to 2.02066Å and 2.02071Å. By looking at these bond lengths, it is evident that the previous method (where the distances were frozen) gives bond distances closer to the desired distances. Apart from the slightly reduced bond lengths, the two molecules have very similar geometry - both had a point group of C2 symmetry.
Optimizing the boat transition structure
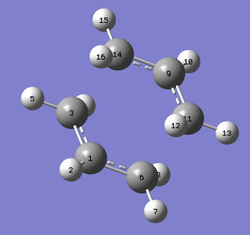
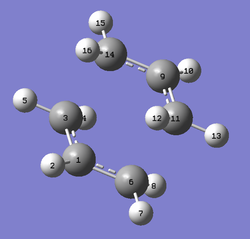
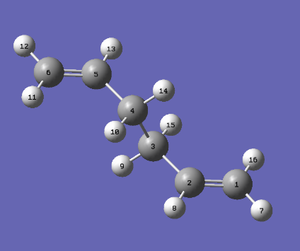
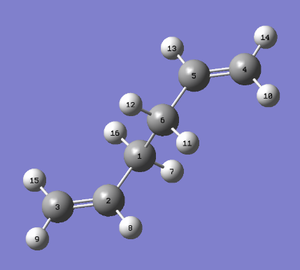
Next, the boat transition structure will be optimized. This was done using the QST2 Transition Structure calculation under the Hartree Fock, 3-21G basis set. The reactant and product were set up as shown in the diagrams below using corresponding numbering of the atoms and the calculation was run.
 |
 |
This calculation produced the molecule in the diagram below. It can be seen that the boat transition structure has not been optimized and therefore another calculation must be run instead of using these particular reactant and product configurations with the TS-QST2 method.
The geometries of the reactant and product were therefore modified in order to get an accurate calculation. The dihedral angle of the central four carbon atoms was reduced from 180° to 0°. The angle between Carbons 2-3-4 and between Carbons 3-4-5 was reduced from ~111° to 110°. The below structures were produced from these modifications.
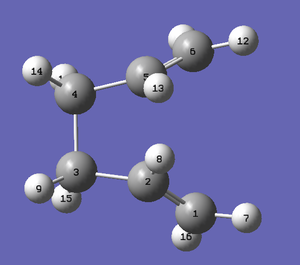 |
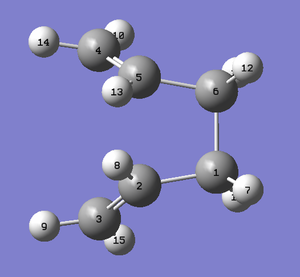 |
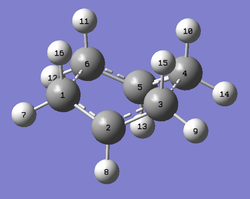
The below structure was produced from optimizing the two modified reactant and product structures above. It can be seen that this time, the structure that was created looked much more like the expected boat transition structure. The calculation was successful this time because the configurations of the reactant and product were drawn to be of a similar configuration to the expected transition structure; the TS-QST2 method will only be successful if this is the case. An imaginary frequency of -839.9356cm-1 proves that this is a transition state.
The below image shows this imaginary vibrational frequency.
Nf710 (talk) 13:27, 18 November 2015 (UTC) Very good use of Jmols, all your frequencies and geoms are correct. It would have been nice if you could have shown some greater understanding of the way the TS optimisations work and where the imaginary frequencies come from. these are the force constants (second derivative) and the quantum harmonic oscillator.
IRC method
One of the optimized chair transition structures (optimized by the TS-Berny method) was mapped using the IRC (Intrinsic Reaction Coordinate) method. This was done to find which of the conformers was the reactant for this particular transition state. The IRC was calculated by following the reaction in the forward direction only, the force constants were set to always be calculated and 50 points along the IRC were calculated. This, again, was all done using the HF/3-21G level of theory.
The below graph shows that a minimum geometry was not reached.

In order to find a minimum geometry, a minimization was then run for the structure corresponding to the last point on the IRC curve (circled in red). The below molecule was produced. It has an energy of -231.69166702 a.u. and a point group of C2. These values correspond to the Gauche2 conformer and it is shown below.
Nf710 (talk) 13:34, 18 November 2015 (UTC)good use of energy to figure out conformer
Calculating the Activation Energies
Both the chair and the boat transition structures will now be optimized to the B3LYP/6-31G* level of theory. This was done by starting from the HF/3-21G structures. The chair and boat conformations were optimized and the structures are shown below.
The table above shows that the point groups for the same transition structure at the different levels of theory remained the same. The energies for both structures were lower for the B3LYP/6-31G* optimization and the bond angles were slightly lower for the Hartree Fock method.
Nf710 (talk) 13:42, 18 November 2015 (UTC) It is meaningless to compare different methods here HF and DFT have completely different hamaoltonians.
For both the boat and the chair transition states, the reactant that was used was the anti2 conformer. In the table below, the energies for all of the structures are shown and the activation energies will then be calculated from this information.
Energies Summary (hartree)
| HF/3-21G | B3LYP/6-31G* | |||||
|---|---|---|---|---|---|---|
| Electronic energy | Sum of electronic and zero-point energies at 0K | Sum of electronic and thermal energies at 298.15K | Electronic energy | Sum of electronic and zero-point energies at 0K | Sum of electronic and thermal energies at 298.15K | |
| Anti2 | -231.69253528 | -231.539539 | -231.532565 | -234.61170281 | -234.469212 | -234.461856 |
| Chair | -231.61932236 | -231.466699 | -231.461340 | -234.55698303 | -234.414929 | -234.409009 |
| Boat | -231.602802 | -231.450928 | -231.445299 | -234.54309292 | -234.402335 | -234.396003 |
The activation energies will then be calculated by subtracting the anti2 energies from the energies for each of the transition structures. These values will then be converted from units of hartree to units of kcal/mol (1 hartree = 627.509 kcal mol-1). This is shown in the table below.
Activation energies
| HF/3-21G | B3LYP/6-31G* | |||
|---|---|---|---|---|
| Activation energy at 0K | Activation energy at 298.15K | Activation energy at 0K | Activation energy at 298.15K | |
| Chair (hartree) | 0.07284 | 0.071225 | 0.054283 | 0.052847 |
| Boat (hartree) | 0.088611 | 0.087266 | 0.066877 | 0.065853 |
| Chair (kcal/mol) | 45.71 | 44.70 | 34.06 | 33.16 |
| Boat (kcal/mol) | 55.60 | 54.76 | 41.97 | 41.32 |
As the experimental activation energy for the chair TS at 0K is 33.5 ± 0.5 kcal/mol we can see that the value in the table above for the B3LYP/6-31G* level of theory is much closer to the experimental value than for the Hartree Fock activation energy value. The B3LYP/6-31G* value is just 0.6 kcal/mol higher than the high point of the range for the experimental activation energy whereas the HF/3-21G set is 11.71 kcal/mol higher.
The experimental value for the boat transition structure at 0K is 44.7 ± 2.0 kcal/mol. For this structure, the B3LYP/6-31G* level of theory is 0.73 kcal/mol outside of the range of the experimental energy and the lower level of theory is 8.9 kcal/mol higher than the experimental range.
The boat transition structure has a higher activation energy than the chair structure meaning that the chair is most likely to be the preferred conformation.
As shown in the tables above, changing the level of theory for the optimisations had a much greater effect on the energies of the molecules than it had on the overall structure and geometries. The bond lengths and angles were only slightly affected but the energies were much more of a match to experiment when the more precise 6-31G basis set was used. Therefore, using the larger basis set will give a more accurate results when calculating energies of molecules or transition states.
Nf710 (talk) 16:55, 18 November 2015 (UTC) It is good how you have come to the correct conclusion that higher basis sets are important for energy but not so much geom.
Nf710 (talk) 16:55, 18 November 2015 (UTC) In general this is a fair good report. You have done everything that has been asked of you but you have not show a huge amount of understanding of the methods for things such as optimisations and just a general understandings of the basis sets etc and the various computational methods.
The Diels Alder Cycloaddition
(Calculations in this section should be using AM1 and B3LYP/6-31G(d) Tam10 (talk) 12:43, 9 November 2015 (UTC))
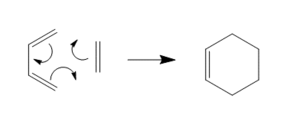
The Diels Alder reaction is a pericyclic reaction. It occurs via a concerted, stereospecific reaction between a diene and a dieneophile. The general mechanism for this reaction is shown in the diagram below.
Cis Butadiene
First, cis butadiene was drawn using GaussView and optimized under the HF/3-21G level of theory using Gaussian. The resulting molecule is shown in the diagram below.
This molecule had a dihedral angle of 0° and the energy after optimization gave a value of -154.05394316 a.u.
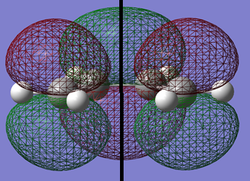
The HOMO and the LUMO were then visualised for this molecule and they are both shown below. The plane of symmetry under observation is shown by the black line in the center of each image.
| HOMO | LUMO | |
|---|---|---|
| Structure | 
|
|
| Symmetry |
Ethylene
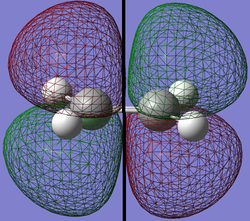
The same optimization was completed for a molecule of ethylene. The energy after optimization was -77.60098814 a.u.
| HOMO | LUMO | |
|---|---|---|
| Structure | 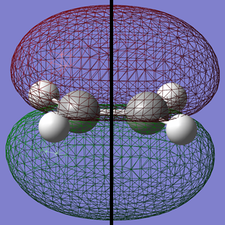
|
|
| Symmetry |
Transition structure for reaction of cis butadiene and ethylene
The transition structure was then guessed using the cis butadiene molecule and the ethylene molecule that were optimized above. The bond length between the terminal carbons in cis butadiene and ethylene in the transition structure is 2.27Å [3] so the bond distances in the guess structure were set to approximately this value and the whole structure was optimized to a transition state using the Hartree Fock method.
The resulting optimized structure is shown in the image below. The structure had an energy of -231.60320850 a.u. An imaginary frequency of -818.12cm-1 proves that this structure is the transition state.
The bond distances for this transition structure are summarised in the table below.
| Structure | 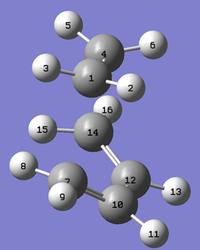
|
|---|---|
| Bond length C1-C7 (Å) | 2.210 |
| Bond length C12-C14 (Å) | 1.370 |
| Bond length C10-C12 (Å) | 1.394 |
| Bond length C1-C4 (Å) | 1.376 |
The typical sp2 C-C bond length is 1.46Å and the sp3 bond length is 1.54Å [4]. The van der Waals radius of the C atom is 1.7Å. From this information, it can be concluded that, because the C1-C7 distance is smaller than the distance of the van der Waals radius times two, then a bond must have formed between these two C atoms. As all of the internal C-C bond distances are smaller than both the typical sp2 and sp3 C-C bond lengths then there must be delocalisation occuring across this molecule.
The below image shows the imaginary vibration at -818.12cm-1 for this transition structure. It is evident from this vibration that the bond forming must be synchronous because the terminal carbon atoms on the different molecules are always equidistant from each other.
The lowest positive frequency for this transition structure is shown in the image below. This vibration is at 166.47 cm-1 and, contrary to the negative vibration, the bond forming mechanism at this frequency must be asynchronous as the terminal carbon atoms are not vibrating in sync with each other.
(Bond formation would not occur through a positive frequency. The TS is stable with respect to this motion Tam10 (talk) 12:43, 9 November 2015 (UTC))
Next, the HOMO and LUMO of this transition structure will be modeled and they are depicted below.
| HOMO | LUMO | |
|---|---|---|
| Structure | 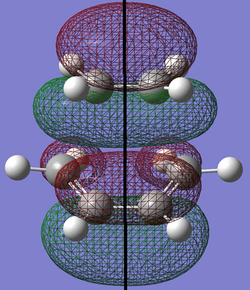
|

|
| Symmetry |
The HOMO of the transition state is composed of the LUMO from the cis butadiene and the HOMO from the ethylene as can be seen below.
| Butadiene LUMO | TS HOMO | Ethylene HOMO |
|---|---|---|

|

|

|
This reaction is allowed because the orbitals of the reactant molecules are of the same symmetry, and of similar energies. According to the Woodward Hoffman rules; the total number of suprafacial (4q+2)s and antarafacial (4r)a componenets must add up to an odd number for a reaction to be allowed [5].In this case, there is just one suprafacial (4q+2)s component meaning that this reaction is allowed.
Cyclohexa-1,3-diene and Maleic Anhydride
In this section the reaction between Cyclohexa-1,3-diene and Maleic Anhydride were studied in order to look at the regioselectivity of the Diels Alder reaction. The product of this should mainly consist of the endo adduct because the exo transition state is higher in energy.
First, both of the starting materials were drawn in GaussView and optimised using the Hartree Fock 3-21G level of theory. These structures are modeled below.
| Cyclohexa-1,3-diene | Maleic Anhydride | Total | |||||
|---|---|---|---|---|---|---|---|
| Structure | |||||||
| Electronic energy (hartree) | -230.54323110 | -375.10351323 | -605.6467443 | ||||
| Sum of electronic and zero-point energies(hartree) | -230.411187 | -375.042897 | -605.454084 | ||||
| Sum of electronic and thermal energies(hartree) | -230.406354 | -375.038063 | -605.444417 |
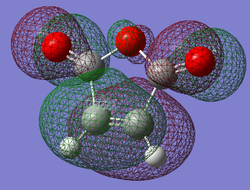
Once these transition structures had been located, the HOMO and LUMO for each state were visualised. These are shown in the table below.
Next, the HOMO and LUMO's of these two molecules were visualised and they can be seen in the tables below.
| Cyclohexa-1,3-diene | Maleic Anhydride | |
|---|---|---|
| HOMO | 
|
|
| LUMO | 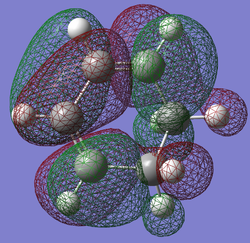
|

|
The two optimised reactants were then used to guess both the exo and the endo transition states. These were then optimised using the HF/3-21G level of theory and the frozen bond method. These structures can be viewed below.
| Exo | Endo | |||||
|---|---|---|---|---|---|---|
| Structure | ||||||
| Imaginary Frequency (cm-1) | -647.54 | -643.97 | ||||
| Electronic Energy (hartree) | -605.603591 | -605.610368 | ||||
| Sum of electronic and zero-point energies(hartree) | -605.408139 | -605.414903 | ||||
| Sum of electronic and thermal energies(hartree) | -605.398678 | -605.405478 |
Both of these transition structures had one negative vibrational frequency, showing that they are both transition states of this reaction.
The activation energies of each of the transition structures will now be calculated using the total energies for the reactants (as shown in the table including the reactants, above) and subtracting these values from the energies of the exo and endo transition structures.
Activation energies
| HF/3-21G | ||
|---|---|---|
| Activation energy at 0K | Activation energy at 298.15K | |
| Exo (hartree) | 0.045945 | 0.045739 |
| Endo (hartree) | 0.039181 | 0.038939 |
| Exo (kcal/mol) | 28.83 | 28.70 |
| Endo (kcal/mol) | 24.59 | 24.43 |
The endo transition state has a lower energy than the exo transition state and the activation energies of the endo state is also lower than the same of the exo state. This shows that the preferred state would be the endo form.
(Worth mentioning that the lower energy of a TS indicates it is kinetically favoured. This is different to a thermodynamically favoured product Tam10 (talk) 12:43, 9 November 2015 (UTC))
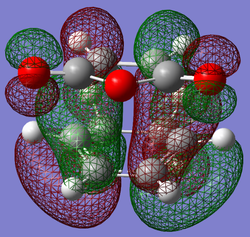
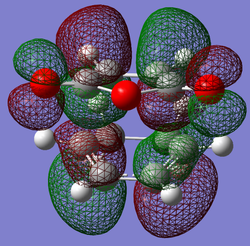
Next, both the HOMO and the LUMO of each transition structure will be visualised.
| Exo | Endo | |
|---|---|---|
| HOMO | 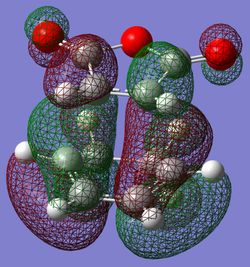
|
|
| LUMO | 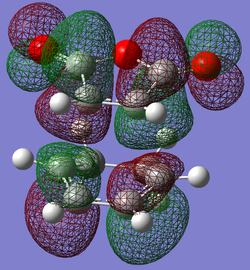
|
|
In the table below, different bond lengths in the endo and exo structures will be compared.
It can be seen from the table above that the geometry of the transition states are very similar; with most of the bond distances being within 0.001Å of each other. However, the distance between the bond forming carbons is noticeably longer in the exo transition state. This larger bond length shows that there is an increased level of steric hindrance in the exo form compared to the endo structure. The steric hindrance may be the reason that the endo form is of a lower energy than the exo.
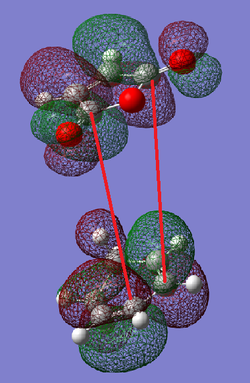
The red arrows in the below diagram show where secondary orbital overlap could occur between the HOMO of the cyclohexa-1,3-diene and the LUMO of the maleic anhydride . This type of overlap is a positive overlap between orbitals which are not directly involved in the bond forming mechanism of the pericyclic reaction [6]. However, as can be seen from the below image, there is a node between where the overlap should occur. This means that there will be no stabilisation available via this method for these particular orbitals.
(It is better to demonstrate the secondary orbital overlap effect with a TS. Reorienting the structure will make it more clear Tam10 (talk) 12:43, 9 November 2015 (UTC))
Conclusion
This experiment involved analysing different conformations of molecules in order to determine either the preferred transition state of a reaction or the lowest energy, preferred conformation of a reactant or product.
It was found that the preferred conformation of the reactant, 1,5-hexadiene, in the Cope rearrangement was the Gauche3 conformer. The transition state for this reaction was found to be the chair TS instead of the boat TS because the chair was of a lower energy. The activation energies for this reaction were calculated after using both the B3LYP and the HF level of theory. It was found that the activation energies were much closer to experimental values when the higher level of theory was used. However, the differing level of theory didn't seem to change the geometries of the molecules much.
The Diels Alder cycloaddition reaction was studied using the Hartree Fock level of theory and the HOMOs and LUMOs and their symmetries for both the reactants and the transition states were visualised. It was found that the endo product would be the most favoured structure because it had a lower activation energy than the exo form.
References
- ↑ R Silbey, R Alberty, M Bawendi, Physical Chemistry, John Wiley & Sons Inc, 4th edition, 2005
- ↑ B.W.Gung, Z.Zhu, R.A. Fouch, J. Am. Chem. Soc., 1995, 117,1784
- ↑ M. V. Basilevsky, V. A. Tikhomirov, and I. E. Chlenov, Theoret. chim. Acta (Berl.), 1971, 23, 82
- ↑ P. Atkins, J. de Paula, Physical Chemistry, Oxford University Press, Oxford, 9th edition, 2010.
- ↑ J Clayden, N Greeves, S Warren, Organic Chemistry, Oxford University Press, Oxford, 2nd edition, 2012
- ↑ M. A. Fox, R. Cardona, and N. J. Kiwiet, J. Org. Chem., 1987, 52,1469

