Rep:Jh6415 MgO
Abstract
In this computational lab, it was aimed to investigate the thermal expansion of MgO by determing the coefficient of volumetric thermal expansion by both the quasi-harmonic approximation and molecular dynamics. The quasi-harmonic approximation predicted an expansion coefficient of 3.57 ± 0.08 x 10⁻⁵ K-1 and molecular dynamics predicted a value of 3.22 ± 0.03 10-5 K-1 in the temperature range of 500-2000 K. The calculated values under each method were found to slightly under-predict the expansion coefficient upon comparison to literature, with molecular dynamics exhibiting larger deviations. This was reasoned to be due to the inadequacy of the size of the supercell, along with the limitations of the method at low temperatures.
Introduction
Aims and Objectives
The main aim of this computational lab was to explore the thermal expansion of a crystal of magnesium oxide through use of both the quasi-harmonic approximation (lattice dynamics) and molecular dynamics, in order to investigate how the volume of the lattice changes with temperature with each technique.
The MgO lattice was initially modelled, and the structure of both the primitive and conventional unit cells was explored, with the lattice energy per unit cell calculated. Phonon dispersion curves were then plotted, along with the density of states for increasingly larger wave vector grids. The Helmholtz free energy was additionally calculated for the grids to determine a suitable size of k-space grid, specifically the size at which convergence to the infinite grid energy was observed. This grid size was then used to investigate the variance in free energy with temperature using the quasi-harmonic approximation. The changes in lattice parameter were also calculated in order to determine the volumetric coefficient of thermal expansion under the quasi-harmonic approximation. Following the use of lattice dynamics, molecular dynamics was used to determine the cell's volumetric changes with temperature, and hence calculate the volumetric coefficient of thermal expansion under molecular dynamics. Finally, it was aimed to compare and explain the thermal expansion predicted under each of the two techniques.
Methods of Calculation
In this lab, DLVisualize was employed as the graphical user interface to visualise the structure and properties of the MgO crystal, in the RedHat Linux operating system environment. The molecular modelling code GULP was used as the computer program to execute simulations and calculations on the MgO crystal.
Magnesium Oxide Structure
Magnesium oxide is an ionic solid with a lattice structure of Mg2+ and O2- ions, which are in an octahedral environment. The crystal structure of MgO is illustrated by its unit cell, of which there are two types: primitive and conventional. The primitive unit cell can be described by the following Cartesian lattice vectors, which have units Ångström:
| 0.000000 | 2.105970 | 2.105970 |
| 2.105970 | 0.000000 | 2.105970 |
| 2.105970 | 2.105970 | 0.000000 |
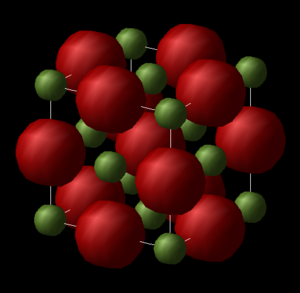
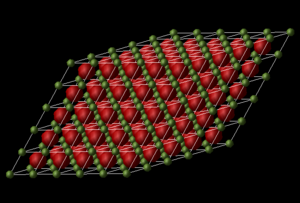
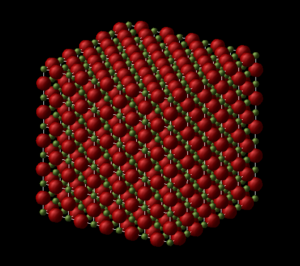
These vectors describe the primitive unit cell as a rhombohedron with all sides equal in length at 2.9783 Å and internal angles all equal at 60°, giving a cell volume of 18.6804 Å3. This primitive unit cell is displayed below in figure 1. A GULP calculation was run to calculate the internal energy of the MgO crystal, giving the lattice energy per primitive unit cell to be -41.0753 eV, corresponding to the energy that's required to infinitely separate the ions. The conventional unit cell is also shown below in figure 2, and is a face-centered cubic (fcc) system with equal sides and angles. The volume of the conventional cell is four times that of the primitive cell, hence the conventional unit cell has a volume of 74.7216 Å3. The cube root of the volume gives the side length of the conventional unit cell, which is the lattice constant, and has a value of 4.2119 Å (at 300 K), which is comparable to a literature value of 4.2110 Å.1 The primitive unit cell contains 2 atoms, whilst the conventional unit cell contains 8 atoms. Both the primitive and conventional unit cells may be repeated in order to generate the periodic lattice, as shown below in figures 3 and 4, where each respective unit cell has been repeated five times in each direction.
Lattice Dynamics
Lattice dynamics is concerned with the atomic vibrations in a crystal and allows the calculation of a number of properties, including the thermal expansion of the material. The vibrations of these atoms can be treated as harmonic travelling waves in lattice dynamics. Every vibration has an associated wavelength, but also a wave vector k, normalised as |k|=2π/λ. This wave vector occurs in the parallel direction to the propagation of the wave and occurs in reciprocal space as opposed to real space. k is periodic with a in real space, but periodic with a* in reciprocal space, with a* equal to 2π/a.2 k is unique in the range of -π/a≤k<π/a, which is termed the first Brillouin zone, and any value of k outside of this range simply repeats the vibration.3 Note that a refers to the lattice parameter. The angular frequency, ω is dependent on the wave vector, in addition to the forces between the atoms.2 The frequency of vibration is related to the lattice parameter by the equation:
where J is the force constant and M is the mass of the atoms.
The harmonic approximation is a major approximation in lattice dynamics and affects the potential energy between atoms, which can be written as a Taylor expansion:
In the harmonic approximation, we only use the first two terms of this expansion for the potential energy.2
Harmonic oscillations have their energy quantised in units of ħω, and a wave of oscillations in a lattice can be quantised to generate a phonon.2 Phonons have both wave-like and particle-like properties. As previously described, the frequency of the phonon is related to the wave vector, with this link termed the phonon dispersion. The phonon dispersion curve is given by plotting k as a function of the frequency of vibration.
If we have a lattice of single dimension and lattice constant a, assuming atoms can only interact with those directly adjacent (a distance of 0.5a away) and m1 is greater than m2, we get the following normal modes:
where K is the force constant of the two atoms of masses m1 and m2. If the sign is positive, then we obtain the optical mode, where the adjacent atoms move in opposite directions (out of phase). This vibration generates a change in dipole moment and hence is optically active. If the sign is negative then we have the acoustic mode, where all our atoms move in the same direction (in phase), and this mode becomes zero at k=0. These phonons are longitudinal since we are only working in one dimension and give the two branches of phonon dispersion.4 However, if we now consider the three-dimensional MgO lattice, vibrations can also be perpendicular to the direction of propagation (traverse). If our primitive unit cell contains two or more different atoms (such as is the case with MgO), then there are an additional two traverse acoustic modes in addition to the longitudinal one, whilst we have 3N-3 optical modes (i.e. three optical modes for MgO). Therefore we can infer that the MgO crystal will possess six branches in the phonon dispersion curve.
If we take an average over all k-points, over the Brillouin zone, we obtain the density of states.3 The density of states is essentially a histogram of the values of frequency, indicating the number of vibrational modes at each frequency. This summation over all k and modes can be completed by producing a list of frequencies for a wave vector grid.2 We can then calculate the free energy by summing over all the vibrational energy levels of the lattice by summing over all k-points and vibrational bands, so a valid approximation of the free energy is obtained by summing over a sufficiently sized wave vector grid.
Quasi-Harmonic Approximation
One limitation of the harmonic approximation in lattice dynamics is its inability in modelling thermal expansion, since the equilibrium separation between the atoms is assumed to be independent of temperature, hence volume is also not dependent on the temperature. The quasi-harmonic approximation serves as an extension to the harmonic approximation and includes the major assumption that the harmonic approximation is applicable for all values of the lattice parameter. The frequencies of the phonons become dependent on the volume of the cell, in order to allow the continued use of the harmonic approximation; thus thermal expansion may be calculated.5 The quasi-harmonic approximation can be used to predict the Helmholtz Free Energy with the following equation:
which includes the internal contribution as the first term, the lattice zero point energy as the second term, and the vibrational contribution in the third and final term, which includes a direct dependence of the phonon frequencies on the volume.6
The change in volume of the MgO lattice with temperature can be quantified through calculation of the volumetric thermal expansion coeffecient, given by the equation:
The thermal expansion occurs at constant pressure, however for solids, the pressure effects on the solid are ignored.5 If our solid is isotropic, meaning that the expansion occurs equally in all directions, then the volumetric thermal expansion coefficient is three times the linear thermal expansion coefficient.
Molecular Dynamics
Molecular dynamics is a type of computer simulation which models microscopic atomic and molecular physical motion and interaction, in order to mimic the real macroscopic behaviour and properties of assembles of molecules. This is completed for our interacting system via the numerical solution of Newton's classical equations of motion. The equations are solved in steps over time and require calculation of the forces between our atoms.7 Determination of the forces is completed through utilisation of interatomic potentials or molecular mechanics force fields. For MgO, a Buckingham potential is employed as the interatomic potential to give the forces between the ions, and is given by the equation:
where A, B and C are constants and r is the distance between the atoms.8 The Buckingham potential includes both the Pauli repulsion between the ions and the Van der Waals attraction.9 A constant number of atoms in the MgO lattice at fixed pressure and temperature are permitted to interact for a fixed duration, and measurement of the cell volume at various temperatures allows for the calculation of the volumetric coefficient of thermal expansion, as previously described for lattice dynamics, using equation 5.
In order to apply molecular dynamics, we begin with an initial configuration and velocities for MgO - the initial atomic positions are that of ideal MgO, and the atoms will have random velocities dependent on the temperature. The forces on the atoms are then calculated, followed by the accelerations of the atoms, as given by Newton's Second Law, F = ma. We then determine the new velocities and positions of the atoms by adding the acceleration or new velocity multiplied by the time step to the original velocity or position, respectively. This algorithm is repeated at successive time steps until the system equilibrates and the system's properties, such as the energy, average out. The average volume of the cell may then be measured.
The following approximations are made in the process: the bonding interactions are treated as harmonic oscillators, with elastic collisions, where we conserve kinetic energy and momentum. The atoms are treated as non-compressible spheres, whose charges and bonding do not change for the duration of our simulation. In this simulation, the harmonic approximation is not used, however the process is more expensive than use of the quasi-harmonic approximation. Limitations of molecular dynamics include the extensive computational times associated with larger systems and time scales, and resulting high cost of the process in comparison to lattice dyanmics. The technique is applicable in a plethora of areas of chemistry, including the modelling of biomolecules.
Calculation of Phonon Modes and Free Energy
For this exercise, the phonon modes of magnesium oxide were to be calculated, then illustrated as phonon dispersion curves, followed by density of states, for varying grid sizes. The Helmholtz free energy for the differing grid sizes was also to be calculated with the quasi-harmonic approximation, in order to select the optimal grid size for further calculations.
Phonon Dispersion Curves
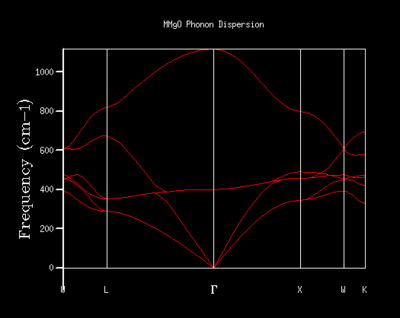
The phonon dispersion curves of MgO were computed and are displayed in figure 5. The frequencies of the phonons were calculated at 50 points along the path in k-space. As previously described, six branches are expected in the phonon dispersion of MgO: one longitudinal acoustic mode and two traverse acoustic modes, along with three optical modes. Six branches are indeed observed in the phonon dispersion, as shown in figure 5. Three of the branches become zero at Γ and are hence the acoustic modes, where all the atoms translate in the same direction, while the optical modes are at higher frequencies.
Density of States
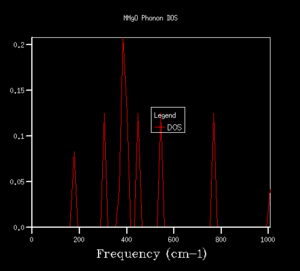
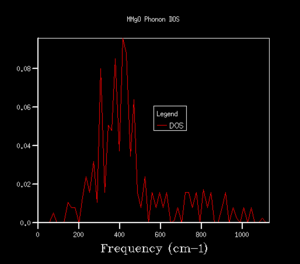
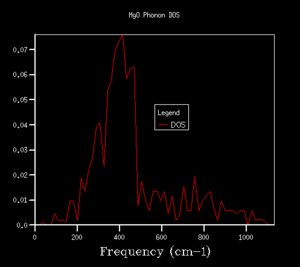
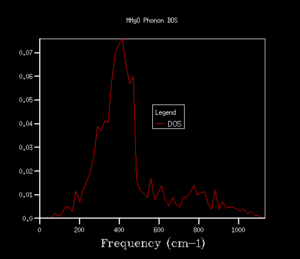
The density of states (DOS) shows the relative number of vibrational modes at each frequency and is produced by taking an average over all of the k-points. We can notice that the x-axis of the DOS is the same as the y-axis of the phonon dispersion. Although we use k in the reciprocal space, the DOS is used in real space by averaging across the entire Brillouin zone, for all k.3 Looking at the DOS in table 1, the DOS for the 1x1x1 grid has been calculated for only a single k-point. This k-point can be identified as the L k-point. From analysis of the log file for the 1x1x1 DOS, the frequencies occur at 288.49, 351.76, 676.23 and 818.82 cm-1, with the bands at 288.49 and 351.76 cm-1 being doubly degenerate, hence why these bands are twice as intense as the remaining two peaks at higher frequency. On comparison to the phonon dispersion curves, we see that these four frequencies correspond to the L k-point, which indeed has doubly degenerate modes at 288.49 and 351.76 cm-1. L has a k value of kx=ky=kz=0.5. However, this DOS is evidently not an average over a sufficient number of k-points (since it is the L k-point only) and would not give a reasonable value for the free energy, so we require a larger grid of k-points.
| 1x1x1 | 2x2x2 |
|---|---|

|
|
| 3x3x3 | 4x4x4 |

|
|
| 5x5x5 | 6x6x6 |
|

|
| 8x8x8 | 10x10x10 |
|
|
| 25x25x25 | 50x50x50 |

|

|
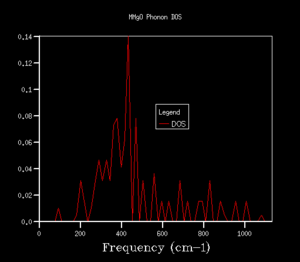
The shrinking factors were increased from 1x1x1 up to 50x50x50, as can be seen in table 1. Upon increasing the grid size to 2x2x2, a larger number of peaks appear in the DOS, including ones at higher frequencies, since we are taking an average of more k-points. As we further increase the grid size, more and more peaks are present, and then the DOS becomes more of a smoother curve, giving a better average of the k-points. From table 1, we can see that increasing the grid size from 10x10x10 to 25x25x25 results in a much smoother curve being obtained, with convergence of the DOS. For smaller grid sizes than 25x25x25, more distinct peaks can be observed, as opposed to an average. Increasing the grid size up to 50x50x50 had no significant effect on the DOS, and we can see that the DOS for the two largest grid sizes is very similar, almost identical. This suggests that a 25x25x25 grid is a sufficient average of k-points, hence there would be little benefit of using a larger grid at the expense of computational time, since this grid already resembles the DOS of the infinity grid. Therefore, a grid size of 25x25x25 was selected as the optimal grid size. An appropriate grid size is important, as when we come to calculate properties such as the free energy, we want to sum over all of the vibrations and k-points to ensure an accurate solution, but we also don't want such a large grid size that it is taxing in terms of its computational time.
Helmholtz Free Energy
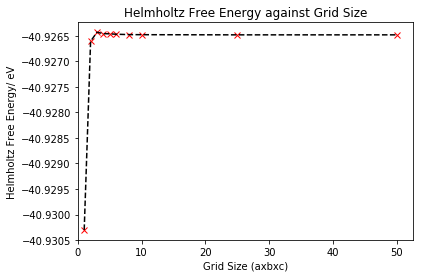
In order to confirm that 25x25x25 was the optimal grid size, the Helmholtz free energy was also calculated for the ten different grid sizes used for the DOS, under the quasi-harmonic approximation. All energies were calculated at a temperature of 300 K. The largest grid size tested was 50x50x50, so this grid can be treated as the closest to the infinite grid and would be expected to give the free energy value closest to the infinite grid value (most accurate approximation).
| Grid | Helmholtz Free Energy/ eV | Energy Difference from 50x50x50 Grid/ meV |
|---|---|---|
| 1x1x1 | -40.930301 | 3.818 |
| 2x2x2 | -40.926609 | 0.126 |
| 3x3x3 | -40.926432 | 0.051 |
| 4x4x4 | -40.926450 | 0.033 |
| 5x5x5 | -40.926463 | 0.020 |
| 6x6x6 | -40.926471 | 0.012 |
| 8x8x8 | -40.926478 | 0.005 |
| 10x10x10 | -40.926480 | 0.003 |
| 25x25x25 | -40.926483 | 0 |
| 50x50x50 | -40.926483 | 0 |
From table 2, we see that as the grid size increases to 3x3x3, the free energy becomes less negative, before approaching a slightly more negative constant value at larger grid sizes, as further illustrated in figure 6. From figure 6, we also notice that convergence of free energy is more rapid as grid size increases. There is an energy difference of 3.818 meV between 1x1x1 and 50x50x50, hence a 1x1x1 grid will not give approximations accurate to 1 meV. However, there's an energy difference of 0.126 meV between 2x2x2 and 50x50x50, so a 2x2x2 grid size will give calculations accurate to both 1 meV and 0.5 meV. A grid size above 2x2x2 will give a free energy within 0.1 meV of the 'infinite' value, with infinite here referring to the 50x50x50 grid. However, ideally we want to find the grid size at which the free energy converges (i.e. stops changing) and matches that of the infinite grid. This is because under the quasi-harmonic approximation, in order to get the free energy, we sum the vibrational modes for the infinite lattice, as opposed to a finite grid, so we need to ensure our grid size gives a value as close as possible to the infinite grid for an accurate approximation. As grid size further increases, the free energy is found to converge at a grid size of 25x25x25, hence we confirm using both the DOS and free energy that this is the optimal grid size.
Alternate Lattice Systems
Although a grid size of 25x25x25 was found to be optimal for MgO (lattice constant of 4.2119 Å), it may not be so appropriate for other materials which have different lattice parameters. Calcium oxide is a similar metal oxide, with a slightly larger lattice constant of 4.8110 Å.1 Faujasite is a zeolite and has a significantly larger lattice parameter of approximately 24.7031 Å.10 Lithium metal, on the other hand, has a smaller lattice constant of 3.5092 Å.11 The lattice constant affects the size of the first Brillouin zone, which is equal to a*=2π/a in reciprocal space. Therefore, if the lattice constant (a) is smaller, as is the case for lithium, a* and hence the first Brillouin zone will be larger. As a result, our optimal grid size is likely to need to be larger for lithium, in order to sample more k-points in this larger Brillouin zone. Since the lattice parameter is slightly larger for CaO compared to MgO, we may need a slightly smaller grid, although the optimal 25x25x25 grid may be appropriate since the lattice constants are not significantly different. Faujasite has a significantly larger lattice constant and hence smaller first Brillouin zone, so will require a much smaller optimal grid size.
Thermal Expansion with the Quasi-Harmonic Approximation
In this exercise, our MgO crystal was optimised at various temperatures to investigate the changes in free energy and lattice parameter (and hence cell volume) with temperature. The optimal grid size of 25x25x25 was used here for all calculations. This allowed the volumetric coefficient of thermal expansion to then be calculated under the quasi-harmonic approximation.
Helmholtz Free Energy as a Function of Temperature
The Helmholtz free energy was computed with the quasi-harmonic approximation for 100 K temperature steps in the range 0 to 3000 K, then the free energy was plotted as a function of the temperature, as shown in figure 7. The energy was calculated using equation 4.
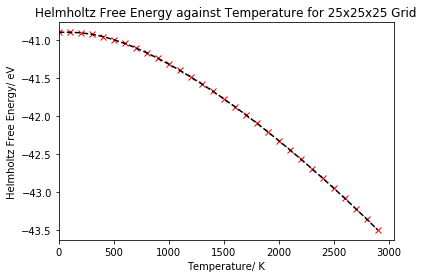
As can be seen in the plot, the free energy begins to decrease slowly at low temperatures, but then starts to become increasingly negative more rapidly as we further increase the temperature. Looking back at equation 4, if our temperature is equal to zero, then the Helmholtz free energy is equal to the internal energy plus the zero point energy of the lattice, with no contribution from the third term. At low temperatures, these first two terms will dominate the free energy equation, hence why the free energy only decreases slowly. At higher temperatures, we begin to occupy higher vibrational levels and the Helmholtz free energy becomes dominated by the entropy. The free energy becomes more negative at a faster rate as the third term will begin to dominate the equation.
Lattice Parameter as a Function of Temperature
Similarly, the lattice parameter was computed for the same temperatures, then plotted as a function of temperature in figure 8.
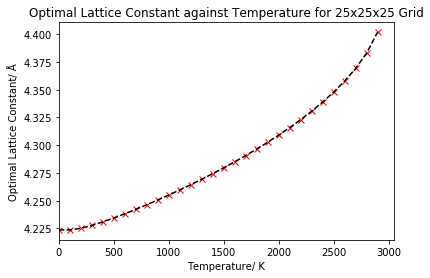
For very low temperatures, we see that the lattice constant begins to increase slowly. The increase is slow since the atoms are vibrating near to their equilibrium positions as it is the ground vibrational levels that will be predominantly populated. After approximately 500 K, the lattice constant appears to start to increase linearly with temperature. However, at higher temperatures (approximately above 2000 K), this linearity is lost and there appears to be an exponential increase to the curve as the lattice constant increases at a faster rate. An equilibrium volume and equilibrium lattice parameter is obtained for each temperature, where the free energy has been minimised, with this volume/lattice constant increasing as the free energy decreases, resulting in thermal expansion of the lattice. This is because as we heat our MgO crystal, our atoms will gain more kinetic energy and occupy higher energy vibrational levels, so will vibrate more around their equilibrium position. As the ions vibrate more, the equilibrium separation between them will increase, which results in the volume and lattice parameter increasing, and hence the expansion of the lattice.
We can recall that in the quasi-harmonic approximation, the phonon frequency is dependent on the volume, but the temperature dependence of the frequencies is not included. One limitation of the quasi-harmonic approximation is the absence of anharmonicity, which is due to intrinsic phonon interaction. This gives rise to deviations in calculated properties at high temperature, so limits the use of the approximation at high temperatures. At high temperatures, a loss of linearity was indeed observed in figure 8 as a result of this limitation. At higher temperatures, anharmonicity and the intrinsic phonon interaction (which changes with temperature) begins to have a large effect, giving the exponential component to the curve. The anharmonic effect must be included for the quasi-harmonic effect to extend to high temperatures, so we must include the phonon frequency dependence on temperature to equation 4 (the quasi-harmonic approximation Helmholtz free energy equation).6 Additionally, the melting point of magnesium oxide is 3250 ± 20 K,12 so as we approach this value at higher temperatures, we will begin to lose our lattice structure, but this is not accounted for by the quasi-harmonic approximation - under the approximation the lattice structure is modelled to just keep expanding.
Volumetric Thermal Expansion of MgO
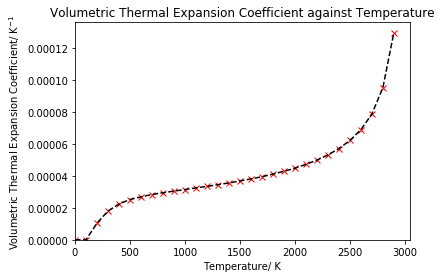
The volumetric thermal expansion coefficient was calculated for MgO to model how the material expands with temperature. The thermal expansion coefficient was calculated using equation 5, then was plotted against temperature to obtain figure 9.
 |
 |
As can be seen in figure 9, the thermal expansion coefficient is not constant, but rather increases with the temperature. From approximately 500 K to 2000 K, there appears to be a linear increase in the thermal expansion coefficient, with the coefficient increasing more rapidly before 500 K. After 2000 K, the coefficient no longer increases linearly, but rather exponentially, which is due to anharmonicity being neglected in the quasi-harmonic approximation, as discussed in the previous section, causing results to diverge. On comparison to literature, as shown in figure 10, which uses experimental data from Ganesan,13 Anderson et al.14 and White and Anderson,15 we see that the same trend was observed: a sharper initial increase in the coefficient, followed by a linear increase and then more of an exponential increase at high temperatures. The literature data also showed that a supercell containing just eight atoms was sufficient to obtain accurate results, providing evidence that the 25x25x25 grid size was indeed appropriate.5 It should be noted however that the literature plot only extends to a temperature of 2000 K, whereas the computed results from this lab included temperatures up to 3000 K. From comparison with literature, we can see that the thermal expansion coefficient has been somewhat under-predicted by our computational methods when compared to experimental data. This is likely due to the limitations of the technique in terms of the approximations that have been made, such as neglecting anharmonic terms.
Thermal Expansion with Molecular Dynamics
In this exercise, molecular dynamics was used to compute the cell volume per formula unit as a function of temperature, then to calculate the volumetric thermal expansion coefficient under molecular dynamics. A time step of one femtosecond was used for molecular dynamics calculations in this lab, to allow for efficient calculation and for sampling of all viable atomic vibrations. Calculations were performed on a 32 unit MgO supercell, which contains 64 atoms (figure 11).

A primitive cell cannot be used here, as was in lattice dynamics calculations, since all cells of the MgO crystal would have in phase motion. This is not the case for the supercell, which is a larger volume version of the unit cell with greater system flexibility in vibrations. As previously performed for the quasi-harmonic approximation, the optimal size of the supercell could be determined by calculating the free energy of progressively larger cells, to find at which size the energy converges. However, due to the higher cost of molecular dynamics, a 32 unit supercell was used to give sufficient compromise between the time and accuracy of the calculation. Pressure and temperature of the system were held constant, whilst the changes in cell volume were observed for a range of temperatures between 0 and 3000 K at 100 K intervals. 500 production steps were employed, meaning a further 500 time steps are performed following system equilibration. An NPT ensemble was used, so the ensemble is both isothermal and isobaric, since pressure, temperature and the number of atoms were held constant.
Cell Volume as a Function of Temperature
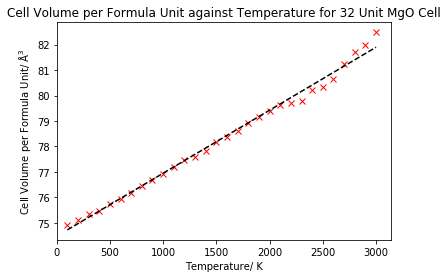
The average cell volume per formula unit was plotted against temperature to give figure 12.
 |
 |
As can be seen in figure 12, the average cell volume per formula unit appears to increase linearly with temperature, up until approximately 2000 K, when the linearity begins to be lost. This means up until 2000 K, the volume is increasing by a relatively constant value with each 100 K increment, so we would expect the thermal expansion coefficient to be fairly constant for these temperatures. We can see that no volume could be calculated at 0 K under molecular dynamics. This is because molecular dynamics is a classical technique, using Newton's classical equations of motions and doesn't include quantum effects.16 Therefore, molecular dynamics does not predict that the lattice will have zero point vibrational energy, so the crystal will have no free energy at 0 K, and hence molecular dynamics cannot be used at such low temperatures. This gives an advantage to the quasi-harmonic approximation, which can be used at low temperatures. Although it was noted that there was a loss of linearity above 2000 K, the data is however closer to linearity than the quasi-harmonic data, which had an exponential trend above 2000 K. This is because molecular dynamics includes anharmonicity, something which the quasi-harmonic approximation lacks, and hence better models the thermal expansion at higher temperatures (specifically above 2000 K here). As previously mentioned, the molecular dynamics data did lose an aspect of linearity above 2000 K, which is likely due to a shorter time step being required. This is because at high temperatures the atoms will have higher velocities, vibrate faster and hence change position more rapidly, so a shorter time step would be needed to sample the vibrations more accurately. The volume change with temperature of MgO under molecular dynamics as calculated by Matsui is displayed in figure 13 for a literture comparison.17 We see that our calculated data does indeed follow the same linear increase up to 2000 K.
Volumetric Thermal Expansion of MgO
As for the quasi-harmonic approximation, the coefficient of volumetric thermal expansion was calculated with equation 5 and plotted against temperature.
 |
 |
From figure 14, it appears that there is not a significant dependence of the thermal expansion coefficient on temperature. This is indeed the case above 2000 K, as previously discussed, where the linearity in volume increase began to be lost. At temperatures below 2000 K, the volumetric thermal expansion coefficient remains almost constant, with a very slight increase with temperature, indicating that the volume is increasing by an almost constant amount. This was shown by performing a linear fit on the data between 100 - 2000 K, as shown in figure 14 by the black dotted line, which indicates the thermal expansion coefficient is relatively constant around 3 x 10⁵ K-1. Fluctuations can be observed in the data in figure 14, as a relatively small cell was used for the calculations in order to save computational time and it was the average cell volume that was recorded, hence there was some fluctuation in the volume and thermal expansion. Therefore, ideally the calculations should have been repeated with a larger supercell to limit these fluctuations. On comparison to literature, using Matsui's data again in figure 15, we see that a small linear increase and generally higher expansion coefficients were calculated with molecular dynamics. However, Matsui used a supercell containing 64 unit cells, consisting of a total of 512 atoms, as opposed to the supercell used in our performed calculations, which contained 8 unit cells and 64 atoms.17 Hence, the significant difference in supercell size accounts for the deviations from literature, as more accurate data with fewer fluctuations can be obtained with a larger supercell.
Comparison of Methods and Results
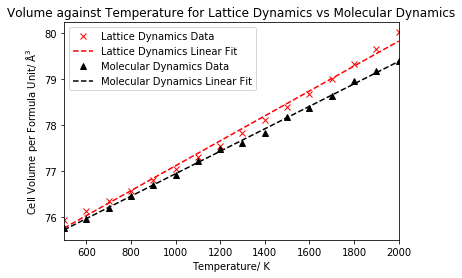
In this section, the results of the thermal expansion of MgO with both the quasi-harmonic approximation and molecular dynamics will be compared. Initially, the cell volume per formula unit against temperature for both lattice dynamics and molecular dynamics was illustrated on a single plot for comparison. Then, a linear fit was performed on a suitable temperature range in order to calculate the coefficient of volumetric thermal expansion for the temperature range for both methods and finally compared to a literature value.
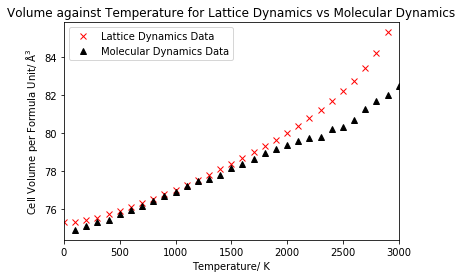
Figure 16 compares the change in cell volume with temperature under both methods, and we can observe two significant differences between the two data sets: a low temperature effect and a high temperature effect. At low temperatures, below 500 K, molecular dynamics encounters problems due to negligence of the zero point energy and fails at 0 K, whereas lattice dynamics has no such problems as the quantum effects are included. On the other hand, lattice dynamics encounters problems at higher temperatures due to negligence of anharmonicity and gains an exponential increase which is not the case in molecular dynamics. Both methods were found to exhibit a linear increase between 500 and 2000 K, hence it was decided to calculate the expansion coefficient for this temperature range, since the volume will be increasing in constant increments for this linear region, giving rise to a constant value for thermal expansion. A linear fit was performed for both data sets for the selected range, as shown in figure 17, allowing the gradients to be extracted. The gradient could then be used in equation 5 to calculate the coefficient of volumetric thermal expansion, which is displayed in the table below, along with a comparison to literature. A standard error is also displayed in the table, calculated from a linear least squares fit of the data.
| Method | Volumetric Coefficient of Thermal Expansion/ 10-5 K-1 |
|---|---|
| Lattice Dynamics | 3.57 ± 0.08 |
| Molecular Dynamics | 3.22 ± 0.03 |
| Literature18 | 4.00 |
From table 3, we see that both methods predict different expansion coefficients, with no overlap of their respective standard errors, with the coefficient obtained under the quasi-harmonic approximation being larger. A literature value of 4.00 x 10⁻⁵ K-1 for the temperature range of 300-1250 K was used to evaluate the accuracy of the results.18 We see that both methods calculated a thermal expansion coefficient smaller than that given in the literature, with the lattice dynamics value exhibiting an 11% difference, and the molecular dynamics value exhibiting a 20% difference. Therefore, we see that lattice dynamics gave closer agreement to literature. Whilst both methods exhibit deviations from literature as a result of limitations in the approximations at low/high temperature, molecular dynamics gave greater deviation from the literature value, suggesting that the low temperature limitation of molecular dynamics had a greater effect on the accuracy of the results than the high temperature limitation of lattice dynamics. Molecular dynamics additionally exhibits slight deviations from linearity at high temperatures, and it is well documented that difficulties can be encountered when modelling thermal expansion at higher temperatures. It should also be noted that the literature value refers to a slightly different temperature range than the calculated values - 300-1250 K rather than 500-2000 K. Hence, for the literature value, more low temperatures and less high temperatures have been used in the calculation, which suggests why the value better matches lattice dynamics than molecular dynamics. A further reason for the difference in results is due to the size of the supercell used. For the quasi-harmonic calculations, the 25x25x25 grid size was confirmed to be suitable by the convergence of free energy and density of states, and also from literature comparison, however no such confirmation could be completed for the molecular dynamics supercell, as a result of the increased cost of the method. Therefore a supercell of 8 unit cells (2x2x2) was used for the molecular dynamics calculations, which was believed to be insufficient to obtain accurate results, since 64 unit cell supercells (4x4x4) had been used in the literature. A slightly larger standard error was obtained in the linear least squares fit for lattice dynamics, likely to be due to the data in the 500-2000 K range appearing slightly more curved away from linear than for molecular dynamics.
Conclusion
DLVisualise and GULP were used in this lab to investigate the thermal expansion of the magnesium oxide crystal with computational methods. Both lattice dynamics and molecular dynamics were used as the two methods to model this thermal expansion. The methods differed in the following ways: lattice dynamics used the quasi-harmonic approximation in order to predict system properties with lattice oscillations quantised as phonons, whereas molecular dynamics utilised numerical solutions of Newton's classical equations of motion to model the vibrations and properties of the system. The density of states and Helmholtz free energy were computed under the quasi-harmonic approximation to determine a suitable grid size for lattice dynamics calculations, before the changes in lattice parameter and cell volume were used to quantify the thermal expansion.
The volumetric coefficient of thermal expansion was successfully calculated for both techniques, using a linear fit in the temperature range of 500-2000 K. Values of 3.57 ± 0.08 and 3.22 ± 0.03 x 10⁻⁵ K-1 were obtained for lattice dynamics and molecular dynamics, respectively, and compared to a literature value of 4.00 x 10⁻⁵ K-1 for the 300-1250 K range. Both methods evidently predict a coefficient lower than expected, as a result of the approximations made in each method: the absence of zero point energy in molecular dynamics and the absence of anharmonicty in lattice dynamics. However, the greater deviation of the molecular dynamics coefficient was reasoned to be due to the size-related limitations in the 2x2x2 supercell that was used, along with the negligence of quantum effects having a greater effect on calculation accuracy.
Given that both calculations exhibited slight deviations from the literature, we can suggest a series of improvements to the methods. In molecular dynamics, a larger supercell is needed, such as one with dimensions of 4x4x4, as was found to be used in literature, and a shorter timestep could also be employed. Quantum effects must also be included, such as through quantum corrections. For lattice dynamics, we must account for the anharmonicity, which can be done through use of an adjusted Helmholtz free energy equation.
References
- O. Madelung, U. Rössler and M. Schulz, II-VI and I-VII Compounds; Semimagnetic Compounds, Springer, Berlin, 1999.
- M. T. Dove, École thématique de la Société Française de la Neutronique, 2011, 12, 123-159.
- R. Hoffmann, Angew. Chem., Int. Ed., 1987, 26, 846-878.
- P. Misra, Physics of Condensed Matter, Academic Press, London, 2010.
- A. Erba, M. Shahrokhi, R. Moradian and R. Dovesi, J. Chem. Phys., 2015, 142, 044114.
- Z. Wu and R. M. Wentzcovitch, An efficient method to calculate the anharmonicity free energy, 2006.
- M. P. Allen, Computational soft matter: from synthetic polymers to proteins, 2004, 23, 1-28.
- T. S. Bush, J. D. Gale, C. R. A. Catlow and P. D. Battle, J. Mater. Chem., 1994, 4, 831-837.
- F. J. Cruz, J. N. Canongia Lopes, J. C. Calado and M. E. Minas da Piedade, J. Chem. Phys., 2005, 109, 24473-24479.
- J. A. Hriljac, M. M. Eddy, A. K. Cheetham, J. A. Donohue and G. J. Ray, J. Solid State Chem., 1993, 106, 66-72.
- E. J. Covington and D. J. Montgomery, J. Chem. Phys., 1957, 27, 1030-1032.
- C. Ronchi and M. Sheindlin, J. Appl. Phys., 2001, 90, 3325-3331.
- S. Ganesan, Philos. Mag., 1962, 7, 197-205.
- O. L. Anderson, D. Isaak and H. Oda, Rev. Geophys., 1992, 30, 57-90.
- G. K. White and O. L. Anderson, J. Appl. Phys., 1966, 37, 430-432.
- N. L. Allan, G. D. Barrera, J. A. Purton, C. E. Sims and M. B. Taylor, Phys. Chem. Chem. Phys., 2000, 2, 1099-1111.
- M. Matsui, J. Chem. Phys., 1989, 91, 489-494.
- A. S. Madhusudhan Rao and K. Narender, J. Thermodyn., 2014, 2014, 1-8.


