Rep:Jfa14
Abstract
In this experiment two different theories - Quasi-Harmonic Approximation and Molecular Dynamics - were compared for the calculation of thermal expansion of crystalline MgO, as to investigate their accuracy in comparison with experimental data. The calculations were carried out in DLVisualizer using General Utility Lattice Program. When compared to experimental values the thermal expansion in the range 300-1000 K calculated with Quasi-Harmonic Approximation had an average deviation of 30 % within the range 28-31 %, and Molecular Dynamics an average deviation of 20 % within the range -52-118 %. Hence, Molecular Dynamics proved more accurate and the Quasi-Harmonic Approximation more precise. It is thought that the Quasi-Harmonic Approximation is suitable for lower temperatures whilst Molecular Dynamics are better applicable to higher temperatures.
Introduction
Background
Among the many oxide compounds the binary composition M2+O2- is commonly occurring. Their physical and chemical properties - e.g. conductivity, stability, reactivity - are widely varying, and thus they are of great interest to a broad range of fields.[1] MgO is an oxide with major applications in the refractory industry, hence its properties under temperature changes are of high relevance. [2] In this experiment the thermal expansion of MgO is investigated using the Quasi-Harmonic Approximation and Molecular Dynamics. The experiment is also relevant to other oxides and binary Face Centered Cubic crystalline compounds as the method - comparing the results of two different theories - is potentially applicable to similar systems.
Crystalline MgO
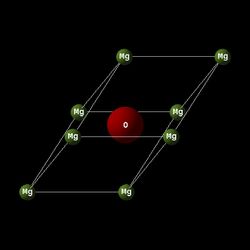
Crystalline magnesium oxide consists of Mg2+ and O2- ions and has a simple Face Centered Cubic lattice (Figure 1 and 2); the distances and angles between atoms are equal in all three dimensions, i.e. distances a=b=c and angles α=β=γ=90° in real space or α=β=γ=60° in reciprocal space.
 |
 |
Phonons
Phonons are quantised vibration modes of a solid. Thus, the energy of a phonon has discrete values according to Equation 1:
Equation 1
k is the wave vector, ω is the angular frequency (dependent on k), j is the branch, n(k,j) is the phonon number, also expressed as in Equation 2:
Equation 2
Ultimately, this results in a zero-point energy which means that even at zero temperature there is some vibrational energy.
The relation between phonon symmetry and Density Of States can be described as a dispersion curve, which is the plot of ω(k,j) against energy.[3]
Quasi-Harmonic Approximation
The Quasi-Harmonic Approximation treats a system of particles as a chain of oscillating particles. Assuming that vibrational translation is much smaller than the distance between interconnected atoms, the overall vibrational energy can be calculated as the sum of all oscillating particles. For simplicity, anharmonic terms are avoided as they lack exact solutions. Despite this, the Quasi-Harmonic Approximation is capable of useful results.[3]
Using the Quasi-Harmonic Approximation, Helmholtz Free Energy can be achieved using Equation 3, as seen below (cf. Equation 1 of phonons):
Equation 3
The first term is the lattice energy, the second term is the zero-point vibrational energy, and the third term is harmonic. Helmholtz Free Energy can also be expressed ass in Equation 4, below:
Equation 4
Thermal expansion
Although thermal expansion is an anharmonic effect, it can be predicted to some extent using the relationship between Helmholtz free energy and entropy and pressure:
and
The expression for thermal expansion α is given in Equation 5:
Equation 5[3]
Molecular Dynamics
In contrast to the Quasi-Harmonic Approximation, Molecular Dynamics Simulation takes into consideration anharmonic interactions. The methodology is slightly different as the simulation uses a time-step algorithm based on Newton's equation of motion on a small ensemble over a defined period of time. The particles of the initial system has, to some extent, random velocities, and for each simulated step new positions and velocities are calculated until averaged thermodynamic properties are settled.[3]
Method
All calculations presented were conducted in DLVisualize using the molecular modelling code General Utility Lattice Program. Any set parameters are stated in the Results and discussion section.
Results and discussion
Phonon modes
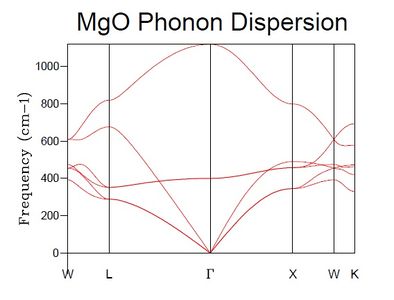
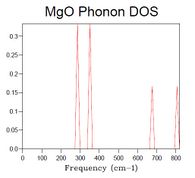
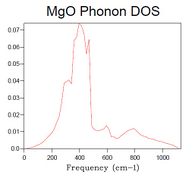
The DOS was computed for a 1x1x1 grid, resulting in the plot seen in Figure 3. When compared to the dispersion curve (calculated at T = 300 K, Figure 4) it is clear that the calculated DOS corresponds to the k-point L (k = [1/2, 1/2, 1/2]) as the highest DOS occurs at the frequencies where the six branches intersect with L (freq (cm-1) = 288.49, 351.76, 676.23, 818.82) of which there are two cases of double degeneracy.
In the dispersion curve diagram it is seen how certain symmetry points occur where the slope of the energy is very low, hence there must be a high DOS at these points as a small change in energy covers a wide range of states. In the case of degenerate branches they will add up to give a DOS relative to the degeneracy (double, triple etc). This is the case in the observation described above.
 |
 |
The number of peaks in the DOS plot is equal to a*b*c*6. Multipliers a, b, and c correspond to the grid size in three dimensions, and the number 6 derives from the fact that there are two atomic species moving in three dimensions (hence 2*3=6).
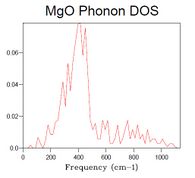
40x40x40 is a grid size presumed to be large enough to strongly resemble the spectrum of an actual crystal. When increasing the grid size step-wise, starting from 1x1x1, the main features of the final spectrum can be found already in that of the grid size 14x14x14, which is therefore deemed the minimum grid size required for a reasonable approximation to the DOS. Such features are: major peak with a shoulder and a thin attached peak, lower intensity bumps at higher frequency (although of poor resolution).
As seen in Table 1, DOS spectra of smaller grid size than 14x14x14 have very low resolution or only a few peaks, whilst spectra of larger size crystals are of higher resolution.
 |
 |
 |
 |
 |
| Table 1. DOS spectra of MgO crystals with different grid size. | ||||
The grid size 14x14x14 would be expected to give a good approximation also for other systems of similar complexity to MgO, e.g. other oxides such as CaO. A simpler system, such as a metal with a cubic lattice (e.g. lithium), is also likely to generate a good approximate plot at a 14x14x14 grid size, although even smaller grid sizes are likely to give a good approximation. This is because of the lower complexity of the spectrum as there should be fewer branches in the dispersion curve (only one atomic species in three dimensions, 1*3=3 hence the number of peaks is half: a*b*c*3). With the same argument but for the opposite case, a more complex structure (e.g. Faujasite) is likely to require a bigger grid size before a good approximation is reached.
Computing free energy using harmonic approximation
A larger grid size should generate a free energy closer to the actual value of large MgO crystals. As seen in Table 2 there is initially a big change in free energy between grids of small sizes, but as the grid is increased to larger sizes the free energy converges to a value close to -40.926483 eV.
| Grid dimensions (Å) | Helmholtz free energy (eV) |
|---|---|
| 1x1x1 | -40.930301 |
| 2x2x2 | -40.926609 |
| 3x3x3 | -40.926432 |
| 4x4x4 | -40.926450 |
| 5x5x5 | -40.926463 |
| 6x6x6 | -40.926471 |
| 7x7x7 | -40.926475 |
| 8x8x8 | -40.926478 |
| 9x9x9 | -40.926479 |
| 10x10x10 | -40.926480 |
| 12x12x12 | -40.926481 |
| 20x20x20 | -40.926483 |
| 30x30x30 | -40.926483 |
| 40x40x40 | -40.926483 |
| Table 2. Dependence of grid size for free energy calculations. | |
The relation between grid size and accuracy of calculated free energy can be extracted from Table 2, as seen in Table 3:
| Grid dimensions (Å) | Range (eV) | Accuracy |
|---|---|---|
| 2x2x2 | -40.926483 ± 0.0005 | 1 meV |
| 2x2x2 | -40.926483 ± 0.00025 | 0.5 meV |
| 4x4x4 | -40.926483 ± 0.00005 | 0.1 meV |
| 12x12x12 | -40.926483 ± 0.000002 | 0.004 meV |
| Table 3. Relation between grid size and accuracy of calculated free energy. | ||
Thermal expansion of MgO
For calculations on thermal expansion of MgO the grid size 12x12x12 was used because it was the largest grid size possible that did not delay calculations. All values are therefore expected to be accurate down to 0.004 meV (Table 3).
 |
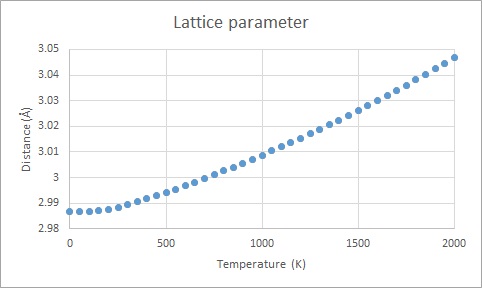 |
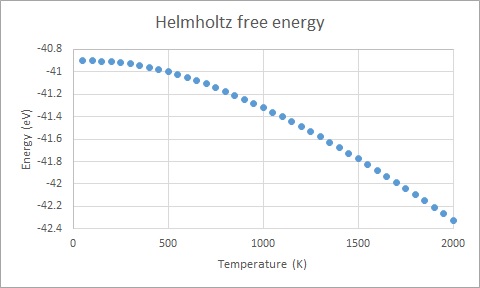
The main observed trend of the free energy against temperature (Figure 5) is that free energy decreases with increasing temperature. Referring to Equation 4 (A=U-TS) this behaviour is expected. The increased value of the lattice parameter with increased temperature (Figure 6) can be rationalised by the fact that the vibrational amplitude is magnified (cf. Equation 2 and 3) which causes increased repulsion and thus longer distance between the oscillators, i.e. the atoms.
Thermal expansion was calculated using Equation 5. The values can be found in Table 4 below, where they are compared to experimental values. The deviation from experimental data over the investigated temperatures is within the range of 28 - 31 % with respect to the experimental values.These deviations are likely to occur because of the approximations of the Quasi-Harmonic Approximation model. For example, harmonic oscillation may no longer be small in relation to neighbuoring interatomic distance at elevated temperatures, and phonon-phonon interactions are excluded from the model.
| Temperature (K) | Computed thermal expansion (10-5 K-1) | Experimental thermal expansion (10-5 K-1)[4] | Deviation (%) |
|---|---|---|---|
| 300 | 2.16 | 3.12 | 30 |
| 350 | 2.33 | 3.39 | 31 |
| 400 | 2.46 | 3.57 | 31 |
| 450 | 2.57 | 3.72 | 31 |
| 500 | 2.65 | 3.84 | 31 |
| 550 | 2.73 | 3.93 | 31 |
| 600 | 2.80 | 4.02 | 30 |
| 650 | 2.86 | 4.08 | 30 |
| 700 | 2.93 | 4.14 | 29 |
| 750 | 2.97 | 4.20 | 29 |
| 800 | 3.02 | 4.26 | 29 |
| 850 | 3.07 | 4.32 | 29 |
| 900 | 3.12 | 4.38 | 29 |
| 950 | 3.17 | 4.41 | 28 |
| 1000 | 3.22 | 4.47 | 28 |
| Table 4. Comparison of thermal expansion between calculated and experimental data (using Quasi-Harmonic Approximation). | |||
Molecular dynamics
The settings for this calculations were: Temperature 300 K; Time Step 1 fs; Equilibration Steps 500; Production Steps 500, Sampling Steps 5, Trajectory Write Steps 5. To obtain meaningful results (by providing more vibrational flexibility than in the primitive cell) a model of 32 MgO units was used.
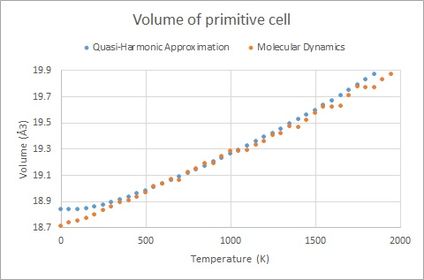
Obtained values from the Molecular Dynamics model are found in Table 6, below. As seen, the thermal expansion coefficient vary a lot, which is explained by the methodology of which the model operates, where the final value is an average of random motion controlled by classical mechanics. It is likely that calculation using a longer time span or a larger cell would have generated more accurate results. The range of deviation to experimental results is huge: -52-118 %. When considered a linear trend, however, the result of Molecular Dynamics is close to that of Quasi-Harmonic Approximation (see Figure 6 below) and the average deviation is smaller for Molecular Dynamics (20 % against 30 %). This implies a better overall accuracy for Molecular Dynamics, although the precision is much higher using the Quasi-Harmonic Approximation.
| Temperature (K) | Computed thermal expansion (10-5 K-1) | Experimental thermal expansion (10-5 K-1)[5] | Deviation (%) |
|---|---|---|---|
| 300 | 2.88 | 3.12 | 8 |
| 350 | 3.64 | 3.39 | -7 |
| 400 | 1.22 | 3.57 | 66 |
| 450 | 2.69 | 3.72 | 28 |
| 500 | 4.19 | 3.84 | -9 |
| 550 | 4.72 | 3.93 | -20 |
| 600 | 1.78 | 4.02 | 56 |
| 650 | 3.95 | 4.08 | 3 |
| 700 | -0.77 | 4.14 | 118 |
| 750 | 6.40 | 4.20 | -52 |
| 800 | 2.51 | 4.26 | 41 |
| 850 | 4.47 | 4.32 | -4 |
| 900 | 0.10 | 4.38 | 98 |
| 950 | 5.27 | 4.41 | -20 |
| 1000 | 4.69 | 4.47 | -5 |
| Table 5. Comparison of thermal expansion between calculated and experimental data (using Molecular Dynamics). | |||
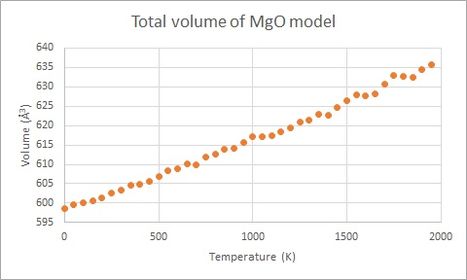
In Figure 6 below, the volume of the primitive cell is found against temperature, calculated using Quasi-Harmonic Approximation and Molecular Dynamics respectively. For most of the temperature range the two models seem to agree well with each other. At low and high temperature there are some differences, however. At low temperatur the Molecular Dynamics Model does not seem to take into account lattice energy and zero-point energy. At high temperature it is seen how the Quasi-Harmonic Approximation model increases the thermal expansion coefficient more than the Molecular Dynamics, and it is possible that it overestimates thermal expansion at high temperature, which becomes problematic as the system approaches melting temperature (3125 K[4]).
 |
 |
Conclusion
A clear relation has been found between phonon dispersion curves and Density Of States using Quasi-Harmonic Approximation, where a bigger system will generate a spectrum closer to reality. For MgO the smallest grid size to generate a reasonable approximation of the real spectrum was deemed to be 14x14x14 (however, this is a slightly subjective opinion).
When calculating thermal expansion of MgO using Quasi-Harmonic Approximation and Molecular Dynamics in the temperature range 300-1000 K, Quasi-Harmonic Approximation produced more precise values (30 % deviation from experimental values, within the range 28-31 %), and Molecular Dynamics produced more accurate values overall (20 % deviation, range -52-118 %). For optimal accuracy Quasi-Harmonic Approximation should therefore be used when investigating the thermal expansion on specific temperatures, whilst Molecular Dynamics is suitable for investigation of larger trends.
Whilst the Quasi-Harmonic Approximation breaks down at higher temperatures, the calculations of Molecular Dynamics require more time, and so it is a matter of priorities. Quasi-Harmonic Approximation is recommended at lower temperatures, and Molecular Dynamics at higher temperatures.
References
- ↑ N.N. Greenwood, A. Earnshaw, Chemistry of the Elements (2nd Edition), Elsevier, Oxford, 1997.
- ↑ M.A. Shand, The Chemistry and Technology of Magnesia, John Wiley & Sons Inc., Hoboken, New Jersey, 2006.
- ↑ 3.0 3.1 3.2 3.3 M.T. Dove, Introduction to Lattice Dynamics, Cambridge University Press, Cambridge, 1993.
- ↑ 4.0 4.1 O.L. Anderson, K. Zou, J. Phys. Chem. Data, 1990, 19, 69-81
- ↑ O.L. Anderson, K. Zou, J. Phys. Chem. Data, 1990, 19, 69-81
