Rep:Ja1915MgO
Abstract
The thermal expansion coefficient describes how the volume of a material changes with temperature. It is an important characteristic to know and has many applications in industry. In this investigation, the 16x16x16 grid size was found to be optimal for both calculating the Helmholtz free energy and the density of states plot as both were done to a sufficient degree of accuracy with minimal computational effort. Finally, two computational methods, Quasi-Harmonic Approximation (QHA) and Molecular Dyanamics, were used and compared to calculate the thermal expansion coefficient for MgO at different temperatures where they both produced values close to literature for specific temperatures (500K - 1100k). It was found that the Quasi- Harmonic approximation calculated values close to literature at low temperatures as it took into account the zero point energy however the approximation broke down at larger temperatures due to not considering enough anharmonic effects. Molecular dynamics was found to not calculate accurate values at low temperatures as it doesn't take the zero point energy into account. Overall in the linear region, the molecular dynamics method produced the more accurate thermal expansion coefficients e.g. at 500K the value calculated was 27.21 x 10 -6 K-1 as oppose to 21.20 x 10⁻⁶ K-1 calculated from QHA (literature 38.73 x 10⁻⁶ K-1). [1]
Introduction
Computational chemistry allows complex mathematics to be solved in order to gather useful data that can be difficult to obtain, within a much shorter time frame. The methods of investigating properties of materials using computational chemistry are based on approximations that make the calculations easier and faster. This can compromise the accuracy of the results yielded however it can be seen that the results are still fairly accurate and can be utilised in the real world for example, Evans et al. has recently tested cubic solids, discovering that the solids give a high amount of control for thermal expansion at different temperatures. [2]
The thermal expansion coefficient for solids is an important property of solids. It has many applications in industry such as in the pharmaceutical industry where recently, computational chemistry has been utilised in order to calculate the thermal expansion coefficient for drug molecules in order to see how the drug would respond to different temperatures that it would be found in when transporting the drug. [3] In this investigation, the thermal expansion coefficient of MgO will be calculated using two different models; the Quasi-Harmonic Approximation (QHA) and Molecular Dynamics which are discussed below.
The Harmonic Approximation and the Quasi-Harmonic Approximation
The Harmonic approximation is a model consisting of a linear chain of atoms where each atom only feels the force of its immediate neighbour (force termed the nearest neighbour interaction). This assumes that the interactions between other atoms are negligible due to a greater distance between them and large screening between the atoms. If we take a linear chain of N atoms, the forces between the neighboring atoms can be represented by a potential function which is dependent on the distance between the atoms (r). Thus the energy of this linear chain can be shown in equation 1. [4]

The atoms vibrate which causes displacements of each atom. If the distance between each atom (a) is much larger than the displacements produced from the vibrations (u), then the energy of the system can be calculated using a Taylor series that is summed over all the atoms in the system (Equation 2). A quadratic term (s=2) is used in this expansion as the linear term can be neglected as you are Taylor expanding around the minimum (equilibrium position) where the first differential is defined as 0 and exact solutions are obtainable for this term. The higher order terms (anharmonic terms) are neglected as the displacements are small in comparison to the unit cell length. As a result, as S increases, the summation term becomes smaller and thus can be ignored. This assumption allows the calculation to become easier as anharmonic terms don't have exact solutions and therefore require more approximations and so calculations. [4]

The model produces accurate data at low temperatures because the kinetic energy is low at these temperatures causing the displacement of the atoms to lower like in the description above. At low temperatures, the summation term will therefore be small (last term in Equation 3) however as the approximation considers the zero point energy, this term dominates the free energy (second term in Equation 3). This accurately represents what occurs at low temperatures. [4] Where E0 is the lattice energy.

Born-Von Karman's periodic boundary condition is applied to the chain of atoms which joins the ends of the chains in order to allow the atoms at the end to have another neighbour like every other atom in the chain. The motion of the chain can be represented by a set of travelling waves and the angular frequency of these waves (wk) is shown in equation 4. [4] Where m is the atomic mass, J is the harmonic force constant and k is the wave vector.
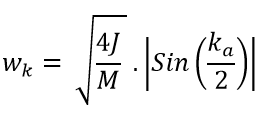
It can also be used to generate a useful plot called the dispersion curve which shows how the angular frequency varies as the wave vector (k) changes. a* is known as the reciprocal space and it is the unit cell length in k space which represents how large the first Brillouin zone is in k space on the dispersion curve. The lattice parameter (a) is the unit cell length in real space and the relationship between them is shown in equation 5ː

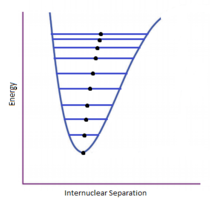
In the system being investigated, the harmonic approximation can’t be used for this investigation as we are observing how the volume changes with temperature in order to calculate the thermal expansion coefficient. As you increase the temperature in the Harmonic approximation, higher energy states are populated but there is no change in equilibrium bond distance as seen in figure 1 where the bond vibrates over a larger distance at higher vibrational levels but over the same equilibrium bond distance. The approximation thus breaks down at higher temperature because anharmonic effects are not being considered and thus the approximation must be modified to suit the system investigated. In the Quasi- Harmonic approximation (QHA), the frequency of the phonon is now dependent on volume as seen in figure 2 where the equilibrium bond length increases with higher vibrational levels. This allows the temperature variation on the volume to be calculated and observed, allowing the thermal coefficient of MgO to be calculated. The Helmholtz free energy of MgO is used to quantify this volume change as it is dependent on both the volume and temperature. [4]
 |
 |
Molecular Dynamics
The MDS method uses a fixed number of atoms in a unit cell which has a constant size, shape and periodic boundary condition. The positions and velocities of the atoms in this unit cell are stored in a computer at the beginning. Newtons second law of motion is then utilised to calculate the motion of the atoms for the positions and velocities that were inputted at the beginning. An algorithm generates the positions and velocities of the atoms based on the motion at this temperature. The algorithm then uses the previous information to form the new positions and velocities in the next time step which then repeats. The information produced is then used to create the trajectory for the atoms during the time period. [4]
There are some limitations to this method as well. It is computationally more expensive to use and so limits the number of calculations that can be done in a specific time. The accuracy of the interatomic potential calculated is compromised in order to make the calculation easier. This affects the solutions collected e.g. it is generally accepted that the ionic polarizability is an integral part of the energy of the crystal, however as it is different to incorporate this into the calculation, the rigid-ion model is used instead limiting the accuracy of the simulations. Finally, the results are biased towards the starting coordinates due to the time length of the experiment. The simulation time length is much smaller than the length of an actual experiment and so the sample does not have enough time to go through all the space possible properly. [4]
Thermal Expansion Coefficient
When materials are heated, sometimes the volume of that material increases. This observation can be described as when the temperature is increased, the volume of the crystal lattice increases as higher energy vibrational levels are available to populate. At these higher vibrational levels, the equilibrium bond distance between the atoms are larger. Quantitatively this means the wavelength of each vibration increases and so the frequency of vibration (wk) decreases. As a result, this means that the last term in equation 3 becomes a larger negative value. As this part of the equation refers to –TS as seen in equation 7, this signifies that the entropy becomes more negative (increasing) with temperature. This is explained qualitatively where the increase in temperature causes the kinetic energy of the molecules to increase and thus the atoms vibrate faster. This increases the volume where the atoms now have more translational, rotational and vibrational freedom than before. The thermal expansion coefficient is an intrinsic property of the material in that it is independent of the volume used. This can be seen in Equation 6 where the initial volume (V0) is taken into account.
 |
|
MgO
MgO exists as a crystal lattice which has a face centred cubic (fcc) structure as its conventional unit cell. The conventional unit cell contains 4 atoms of both Mg and O. The primitive unit cell is a rhombohedron which only contains one Mg and one O, where one atom is in the middle of the face and one is in the corner. The cells have the same density overall and so when later working out the volume of the conventional cell, the primitive cell volume in the log file can just be multiplied by 4. For the QHA, the primitive unit cell is used because it contains all the useful information in reciprocal space. However for the molecular dynamics method, a supercell which has 8 MgO molecules in it is used. This is because if a primitive cell was used, then all the cells will be the same and so all the cells in the crystal would be travelling in phase and it would be the same as calculating the energy at the gamma point on the dispersion plot (k=0,0,0). This is where all the vibrations are in phase (i.e same direction) so the frequency will be zero and there will be no increase in energy. This is the lowest point in the potential well in figure 1. In order to observe more in molecular dynamics, more vibrations must be sampled which is implemented by increasing the number of MgO units.
Investigation Aims
Both computational methods will be utilised in this investigation to calculate the thermal expansion coefficient of MgO. The aims of the investigations are to use both methods discussed previously to calculate the thermal expansion coefficient of MgO and then to compare the results collected from both methods to at different regions of temperature.
Experimental
The models were visualised using DLVisualise as the graphical user interface (GUI). The simulations were performed using the general utility lattice program (GULP) as the code for modelling the molecules. The ionic.lib setting was selected for each experiment in the GULP Potential Parameters panel and the Include Shells option was turned off for all simulations.
Calculation of the phonon modes of MgO
The phonon dispersion curve of MgO was visualised by plotting w,k against k space using the Phonon Dispersion setting. The phonon modes were then visualised using the Create Property Animation panel in the display setting. The density of states (DOS) plot for the phonons were then found using the Phonon DOS setting on the Execute GULP panel. The shrinking factors used were 1 for A, B and C corresponding to a 1x1x1 grid. Both plots were them compared in order to find the single point value used for the density of states plot. The comparison and log file confirmed that the single k-point was 0.5,0.5,0.5. The shrinking factors were them varied for the following values in order to find the minimum grid size which produced a good DOS approximation: 2x2x2, 3x3x3, 4x4x4, 8x8x8, 16x16x16, 32x32x32 and 64x64x64. The 16x16x16 grid size was found to be a good approximation for this.
Calculation of the Free Energy using the Quasi-Harmonic approximation
The density of states plot for the phonons were found using the Phonon DOS setting on the Execute GULP panel. The shrinking factors used were 1 for A, B and C corresponding to a 1x1x1 grid. This experiment was then repeated for the same grid sizes as before: 2x2x2, 3x3x3, 4x4x4, 8x8x8, 16x16x16, 32x32x32 and 64x64x64. The free energies were recorded from the log file taken from each simulation and then compared. It was observed that the 2x2x2 grid size produced an accurate free energy to 1 meV and to 0.5meV where the 3x3x3 was needed for an accurate value to 0.1 meV.
The Thermal Expansion of MgO
The free energies and primitive cell volumes of an optimised MgO structure were calculated within the QHA, for a range of temperatures between 0K and 2900K using a 16x16x16 grid size. The values were then used to calculate the thermal expansion coefficient of MgO at each specific temperature. The simulations were run by first selecting the Optimisation option in the Execute GULP settings. Optimise Gibbs free energy was then selected within the Optimisation opt panel. The Phonon DOS was then selected with a specific temperature in the range stated above with shrinking factors of 16. The free energies were recorded from the log file taken from each simulation. The conventional cell volume was calculated by multiplying the primitive cell volume in the log file by 4. The primitive cell volume was then cube rooted to produce a value for the lattice constant. A plot of temperature vs conventional unit cell volume produced an equation using a polynomial fit. This allowed the gradient at each temperature point to be calculated, where it was then used in equation () to calculate the thermal expansion coefficient at that specific temperature.
Molecular Dynamics
The free energies and cell volumes of a supercell MgO structure containing 32 MgO molecules were calculated within the approximations set by molecule dynamics, for a range of temperatures between 50K and 3500K using a 16x16x16 grid size. The simulations were run by selecting Molecular Dynamics in the Execute GULP panel. The options for the Molecular dynamics were edited by; setting the ensemble to NPT, changing the temperature from 50 – 3500K with each simulation, setting the time step to 1.0 femtoseconds, setting the number of equilibration steps to 500, setting the Sampling steps and Trajectory write steps to 5. The cell volume for each simulation was taken as the last time step volume. This was then divide by 8 to produce the conventional cell volume and then cube rooted to find a. The thermal expansion coefficient was then calculated using the same procedure described previously, again utilising equation ().
Results and Discussion
Calculating the phonon modes of MgO

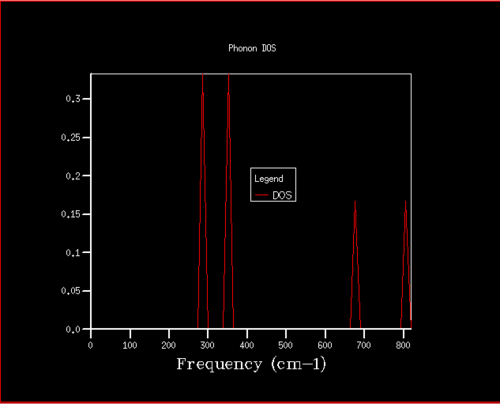
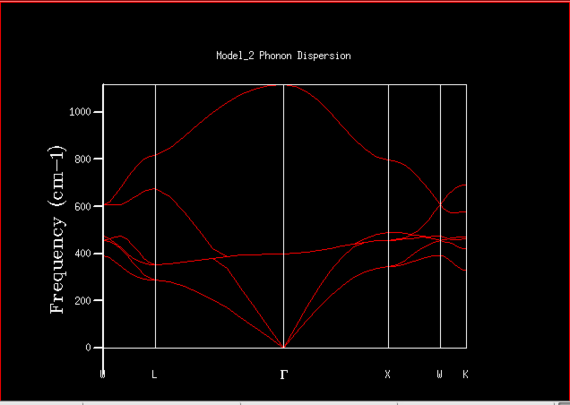
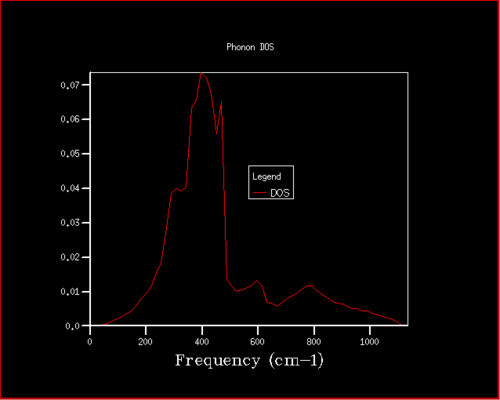
The density of states plot and the phonon dispersion plot obtained for MgO using a 1x1x1 grid can be seen in figures 4 and 5. The single K point represented in the density of states plot was thought to be the point L at 0.5, 0.5, 0.5 in k space (see figure 5) which was then confirmed using the output log file (see figure 3). At this particular K value, it can be seen that the intensity of the peaks at 288.49 cm-1 (0.33 intensity) and 351.76 cm-1 (0.33 intensity) are double that of the peaks at 351.76 cm-1 (0.167 intensity) and 676 cm-1 (0.167 intensity). This is because at this k value, there are 6 branches, 3 acoustic branches (branches that go through the k point 0,0,0) and 3 optical branches, where there is a set of two degenerate branches for the peaks at lower frequency. This allows the k value to be located as L on the dispersion plot as the branches overlap at these particular frequencies.
 |
 |
This was the expected result as the number of bands are 3N where N is the number of atoms in the molecule (2 for MgO). As a result, 6 bands were predicted and so as only 4 peaks where seen and the area of the curves must add to 1 due to the normalisation factor, two of the peaks must have come from degenerate bands.
The density of states varies drastically with the grid size for small values but after a certain grid size, the difference is small. This can be seen in figures 4, 6, and 7. As the grid size is increased, the number of k-points sampled increases which increases the number of different vibrations sampled. Therefore the density of the vibrations shown in the DOS plot increases resulting in more peaks until it eventually forms a continuous curve. The intensity of the curve is much lower than for smaller grid sizes as the area under the curve must still be equal to 1 due to the normalisation factor. The accuracy improvement can be seen across figures 4 and 6 as the density of states is highest around 400 cm-1. This correlates to the branch pathways seen in figure 5. After using the 16x16x16, the differences between the DOS plot produced from this grid size and at higher grid sizes show minute changes, as can be seen in figures 6 and 7. The extra computational time required to perform these calculations at higher grid sizes were deemed to be not worth it therefore the 16x16x16 grid was concluded as the compromise between accuracy and computational time.
 |
 |
Calculation the Free Energy using the Quasi-Harmonic approximation to find the optimal grid size for MgO
The free energy of the structure of MgO was computed at 300K for different grid sizes in order to find the optimal grid size for accurately calculating the free energy. The data collected is presented in table 1 where the difference between the converged value -40.926483 eV and the value generated for that grid size can also be seen. As the grid size increases, the free energy converges rapidly. This is because as the grid size increases, the number of k-points sampled increases and so the number of vibrations sampled increases. As a result, the accuracy of the angular frequency calculated increases. This increases the accuracy of the entropy and zero point energy terms used in the calculation of the free energy calculation, thus improving the accuracy of the results collected.
| Grid Size | Helmholtz Free Energy / eV | Difference from converged value |
|---|---|---|
| 1x1x1 | -40.930301 | 0.003818 |
| 2x2x2 | -40.926609 | 0.000126 |
| 3x3x3 | -40.926432 | 0.000051 |
| 4x4x4 | -40.926450 | 0.000033 |
| 8x8x8 | -40.926478 | 0.000004 |
| 16x16x16 | -40.926482 | 0.000001 |
| 32x32x32 | -40.926483 | Converged |
| 64x64x64 | -40.926483 | Converged |
As seen in table 1, the 2x2x2 grid can be used for a generating free energies accurate to 1 and 0.5 meV. The 3x3x3 grid size can be used for generating a free energy accurate to 0.1 meV. In order to find the optimal grid size, two factors must again be taken into consideration, the accuracy of the free energy generated and the computational time required to run this calculation. It can be seen that the 16x16x16 grid produced a free energy of -40.926482 eV, which has a 0.000001 eV difference from the converged value. Although the 32x32x32 grid provided the converged value for the free energy, the computational time to produce this result was much larger than the insignificant gain in accuracy for the free energy. Thus the 16x16x16 grid size was concluded as the optimal grid size for calculating the free energy.
The results collected for the grid sizes for the DOS plots and free energies can be used to predict the grid sizes which would be optimal for each calculation, for different molecules. In order to predict this, the lattice parameter of each material must be compared. A material with a larger reciprocal space will need more k values in order to gain the same accuracy as a material with a smaller reciprocal space because more vibrations will need to be sampled in order to produce a continuous curve with an accurate free energy value. Therefore a material with a larger reciprocal space would need a larger grid size to account for this. There is an inverse relationship between reciprocal space (a*) and the lattice parameter as seen from equation 5. Therefore a system with a larger lattice parameter will have a smaller reciprocal space and thus need less k points in order to calculate an accurate DOS and free energy.
The table below displays the lattice parameters for MgO and different molecules with corresponding reciprocal lattice values.
| Material | Lattice parameter a (Å) |
|---|---|
| MgO | 4.21 |
| CaO | 4.86 |
| Faujasite | 25.13 |
| Lithium | 3.51 |
Calcium and Magnesium are both in the same group (Group 2) in the periodic table and so both form 2+ ions. As they are both bonded to oxide ions in their respective molecules, the lattice of both molecules are very similar (face centered cubic). As Calcium is lower in the group than Magnesium, the Ca ions are slightly larger due to an additional shell of electrons. Therefore the lattice parameter of CaO is marginally larger than MgO and so the reciprocal space is smaller. It can thus be predicted that a smaller grid size would be sufficient to generate an accurate DOS plot and free energy for CaO however as the difference is small, the grid size difference would also not need to be large.
The molecule Faujasite belongs to the zeolite family which consists of a crystalline structure made up of Aluminium and Silicon oxides with cations such as sodium, potassium, calcium and magnesium to balance out the charges. [11] As a result, the lattice parameter for this molecule is very large, thus producing a much smaller reciprocal space in comparison to MgO. As a result, it is expected that the number of K points needed to obtain an accurate DOS plot and free energy is small. Therefore the grid size predicted for this molecule would be much smaller than 16x16x16.
Lithium is a group 1 metal which is in a higher period in the periodic table than Mg. As a result, it contains less electron shells and thus the ions it produces in metallic bonding are small. Furthermore, the electrostatic interactions between the delocalised electrons and the lithium ions are strong. These two factors cause the lattice parameter for Lithium to be small. As a result, the reciprocal space will be larger for Lithium than for MgO meaning that a higher grid size will be needed to generate an accurate DOS plot and free energy.
The calculation of the Free Energy using the Quasi-Harmonic approximation


The Helmholtz free energy for MgO was calculated for a temperature range of 0K – 2900K using the QHA and a 16x16x16 grid size. The data collected was plotted which can be seen in figure 10. The general trend shows that as the temperature increases, the Helmholtz decreases. There are two regions in the curve, the non linear region and the linear region. At low temperatures, increasing the temperature has a smaller effect on the Helmholtz free energy. This is because at these temperatures, the zero point energy dominates and so Helmholtz free energy doesn’t change by much. After 500K, the entropic-temperature term starts to dominate causing the free energy to decrease because as explained before, an increase in temperature increases the volume causing the last term in equation 3 to become more negative. Also the zero-point energy decreases due to the frequency decreasing and the E0 becomes more less negative. This can be seen in figures 8 and 9 where the zero point energies of MgO at 100K and 2900K can be seen. Therefore as the temperature increases, the free energy decreases in a linear fashion.

The calculation of the Thermal expansion coefficient for MgO using the QHA and Molecular Dynamics
 |
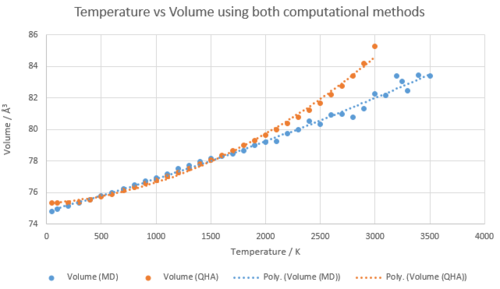 |
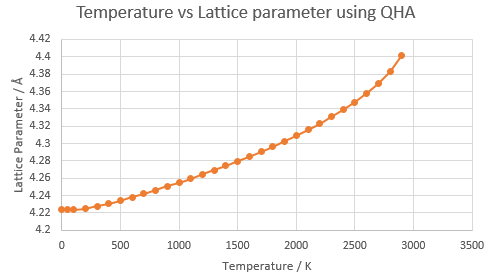
The conventional unit cell volumes for MgO at different temperatures were recorded using a 16x16x16 grid and both approximations (QHA and MD). These values were then converted to the lattice parameters via the calculations discussed in the experimental. The lattice parameters were then plotted against temperature for both. The general trend shows that the lattice parameter increases as temperature increases as explained above. The results collected emphasise why the Harmonic approximation would not be a suitable approximation for calculating the volumes as the equilibrium bond length doesn’t change at higher vibrational levels as seen in figure 1. This is because in the harmonic approximation, the phonons are not volume dependent as in the Quasi-Harmonic approximation.
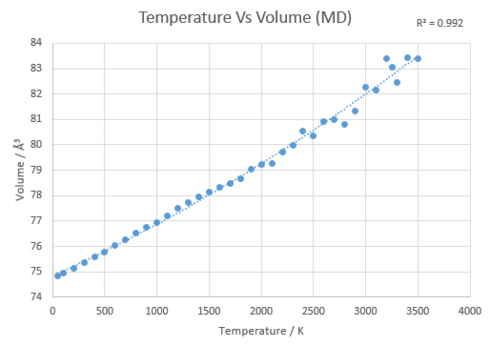
In order to calculate the thermal expansion coefficient for MgO for both methods at each temperature, the temperature was plotted against conventional unit cell volume. Here three distict regions were seen, the first was between 50 and 400K where for the QHA approximation, the region is non-linear but for the MD approximation, the region is linear. The next region was between 500 and 1200K where the region is linear for both. Finally the last region is between 1200K and above where both plots are not linear anymore. Therefore each region will be discussed below. The temperature was plotted against the conventional unit cell volumes (see figure 12) where the gradient of the line at each temperature point was calculated using a polynomial fit. It was then used in equation 6 to calculate the thermal expansion coefficient at that specific temperature. The alpha values calculated can be seen in table 3.
 |
 |
| Temperature/ K | QHA α/ 10-6 K-1 | MD α/ 10-6 K-1 | Literature α/ 10-6 K-1 |
|---|---|---|---|
| 50 | 13.25 | 25.10 | N/A |
| 100 | 14.13 | 25.34 | 6.30 |
| 200 | 15.90 | 25.80 | 22.17 |
| 300 | 17.67 | 26.27 | 31.50 |
| 400 | 19.43 | 26.74 | N/A |
| 500 | 21.20 | 27.21 | 38.73 |
| 600 | 22.96 | 27.67 | 40.26 |
| 700 | 24.73 | 28.14 | 41.70 |
| 800 | 26.49 | 28.61 | 42.90 |
| 900 | 28.26 | 29.08 | 43.65 |
| 1000 | 30.02 | 29.54 | 44.43 |
| 1100 | 31.79 | 30.01 | 45.33 |
| 1200 | 33.55 | 30.48 | 46.50 |
| 1300 | 35.32 | 30.95 | 47.10 |
| 1400 | 37.08 | 31.41 | 48.90 |
| 1500 | 38.85 | 31.88 | 49.98 |
| 1600 | 40.61 | 32.35 | 50.40 |
| 1700 | 42.38 | 32.82 | 51.00 |
| 1800 | 44.14 | 33.28 | 51.30 |
| 1900 | 45.91 | 33.75 | 52.80 |
| 2000 | 47.67 | 34.22 | 53.3 |
At low temperatures, the QHA is much more accurate than the MD approximation as the values produced were much closer to the literature value found e.g at 100K, the difference between the QHA coefficient and literature value was 7.30 (124%) whereas the difference between the the MD coefficient and literature value was 19.04 (302%). This is because the QHA approximation considers the zero point energy when calculating the Helmholtz free energy. Therefore, at low temperatures when the kinetic energy is low, the zero point energy maintains the bond distance at a constant (the minimum energy) which prevents the two atoms getting closer together and thus collapsing. MDS does not have such a term as it is derived from Newton's second law of motion, a classical equation which doesn't take into account the quantum effects of zero point energy. This effects the volumes calculated of the system and as a result, an accurate volume can’t be generated at low temperatures. [4]
The 500K - 1200K region displayed a linear relationship for both approximations. The thermal expansion coefficients calculated are closer to literature than in the previous region showing that the models both give accurate results within this region. The molecular dynamics can be seen to produce closer values to the literature between the region of 500K - 1000K whereas the QHA approximation produces closer values from 1100K above. Thus is can be concluded that the MD method is more accurate for the thermal coefficient than the QHA in the linear region however both are good models.
The next region displays both curves changing from a linear plot to a steep curve for the QHA and random fluctuations for MD. Above 2200K, the curve becomes steep for the QHA where the volume increases rapidly. This is displaying a breakdown of the QHA as in reality, the volume increases are not as large. This occurs as its following the harmonic approximation which does not cause bond dissociation, whereas it should be taking into account the anharmonic effects at high temperature. An error was obtained when the simulation to calculate the conventional unit cell volume was run for temperatures over 3000K. This is because when the bond has become too long, GULP will terminate the simulation as it recognises that the potential model used is not working for the specific system given. As a result, it can be concluded that the QHA is not a valid approximation at high temperatures and so the data collected above 2000K was not used to generate the gradient. [4]
Molecular reaction dynamics does take into account anharmonic effects and thus is predicted to calculate the thermal expansion coefficient for MgO more accurately. However the accuracy of the values calculated can't be concluded as no literature values for the thermal coefficient were found above 2000K. All of the data was used to generate the gradient as it was predicted that the model would not break down at high temperatures. The low temperatures were also used as it is hard to accurately show where the model breaks down. After 2000K, the values start to fluctuate around the line of best fit. Using a numerical time step to create particle trajectories causes these errors to occur where the size of these effects are dependent on the timetep. [4]
Conclusion
The DOS plot for a 1x1x1 grid was shown to correlate to the k point L on the dispersion plot through observation of the intensities and confirmation using the log file. The investigation was successful in that an optimal grid size (16x16x16) was found for the DOS plot and for accurately calculating the free energy. The results from the experiment also showed how the thermal coefficient for both methods were dependent on temperature and allowed them to be compared, thus the investigation aim was achieved. It was found that the QHA was accurate at low temperatures as it considers the zero point energy and that it produced similar values to literature in the linear region. However the method broke down at high temperatures due to not factoring in the anharmonicity effects. The MD method was not accurate at low temperatures due to neglecting the zero point energy however at the linear region and at high temperatures, the thermal expansion coefficients it calculated were comparable to literature as seen in table 3. It can therefore be concluded that both methods were good at calculating the thermal expansion coefficient in the linear region (temperature range of 500K - 1200K) where the Molecular dynamics method produced slightly better results during this region, and that they are both better than the other at calculating the coefficient at different temperatures.
The results in this investigation could be improved if the models were improved to consider the regions where they were poor at measuring the coefficient e.g. anharmonic terms could be included in the QHA model to better model MgO at higher temperatures however this would also increase the complexity of the maths thus causing the calculations to take longer. The ion-rigid model in the molecular dynamics method could be changed to a better model which includes the ionic polarizability effects of the chain e.g. the core-shell model which factors in more interactions such as static dipole and 3 body interactions. [13] Further experiments could be conducted in order to find the optimal grid sizes for the various materials found earlier. Furthermore, in order to reduce the error from the numerical algorithm, a simulation could be run for longer ensuring that the total computational time is longer than the longest period oscillation of MgO. It would be interesting how much this would reduce the error of the thermal expansion coefficients calculated. [4]
References
- ↑ 1.0 1.1 A. S. M. Rao and K. Narender, J. Thermodyn., 2014, 2014.
- ↑ S. E. Tallentire, F. Child, I. Fall, L. Vella-Zarb, I. R. Evans, M. G. Tucker, D. A. Keen, C. Wilson and J. S. O. Evans, J. Am. Chem. Soc., 2013, 135, 12849–12856.
- ↑ J. G. Brandenburg, J. Potticary, H. A. Sparkes, S. L. Price and S. R. Hall, J. Phys. Chem. Lett., 2017, 8, 4319–4324.
- ↑ 4.00 4.01 4.02 4.03 4.04 4.05 4.06 4.07 4.08 4.09 4.10 4.11 4.12 4.13 Dove, M.T., Introduction to Lattice Dynamics, Cambridge University Press, 1993
- ↑ M. Takahashi, Crystals, 2014, 4, 74–103.
- ↑ S. Sinha Ray, A. Ghosh, A. Shit, R. K. Chaudhuri and S. Chattopadhyay, Phys. Chem. Chem. Phys., 2017, 19, 22282–22301.
- ↑ A. Cimino, P. Porta and M. Valigi, J. Am. Ceram. Soc, 1966, 49, 152–156
- ↑ Mackrodt, W. C., Harrison, N. M., Saunders, V. R., Allan, N. L. and Towler, M. D., Aprà, E., Dovesi, R., Philos. Mag. A, 1993 , 68, 653-666.
- ↑ E. Dempsey, G. H. Kuehl and D. H. Olson, J. Phys. Chem. …, 1969, 73, 387–390.
- ↑ M.R. Nadler and C.P. Kempfer, Anal. Chem., 1959, 31, 2109-2111
- ↑ B. Jha and D. N. Singh, Fly Ash Zeolites, 2016, 78.
- ↑ O. Anderson and K. Zou, J. Phys. Chem., 1990, 19.
- ↑ Katrusiak A., McMillan P., High-Pressure Crystallography, 2004

