Rep:JJR115 MGO
Y3C Thermal Expansion of MgO
Introduction
This lab investigates how materials, using the MgO lattice system as an example, expand when heated. Two calculation approaches were employed in order to rationalize vibronic activity of the system and calculate the thermal expansion coefficientː Quasi-harmonic approximation (LD) based on quantum models, and molecular dynamics (MD), the classical approach. The experiment also uses experimental and literature results in order to compare these two computational methods.
The MgO System
The MgO system occupies a face centred cubic lattice, a cubic structure of magnesium ions with oxygen ions occupying octahedral holes (or can be viewed in the opposite sense). MgO is typically used to model vibrational properties of crystals, due to its particular stability, due to the strong regular lattice formed with high lattice enthalpy (-4050kJ/mol)[1]. This FCC (typical rock salt lattice structure) is shown in figure 1, as the conventional unit cell, with 8 ions. In this system, the cubic lattice has the following lattice parameters: ac = bc = cc ; αc,βc,γc, for Nc number of atoms and Vc volume.
Alternatively, this experiment uses the primitive cell in the QHA calculations, also seen in figure 1. This cell is not cubic, and instead has a rhombohedra structure, with ap = bp = cp for Np number of atoms and Vp volume. The structure of the primitive cell therefore follows αp=βp=γp≠90o as it is not cubic.

Thermal Expansion
Under change in temperature, a material will respond with a change of size. In this investigation, the change in volume of the 3D MgO lattice was monitored in order to calculate the thermal expansion coefficient, α, under constant pressure. As the temperature of a system increases, the thermal motion of the atoms/ions of the material increases due to increased kinetic material. This increase in motion result in a greater average separation between the vibrating atoms, the degree of which will be intrinsic to the material being studied. This thermal expansion coefficient will vary with bond energy, transition temperature of the material, and phase of the material. This increase in average lattice volume with temperature can be modeled with equation 1: where V0 is the initial volume, V is the volume at temperature T.
The Vibrational Wave
Atoms in a material will naturally vibrate around their equilibrium positions due to thermal fluctuations. For an infinite lattice crystal, an infinite number of vibrations can be represented as a continuum of vibrational modes. These vibrational modes of a lattice are referred to as phonons; a quantum mechanical description of the vibrational motion of a lattice of atoms oscillating at a single frequency. Atoms chemically bonded together in a large crystal will induce uniform vibrations throughout the lattice, creating vibrational modes of characteristic oscillation. Similar to the light wave-particle duality phenomenon, phonons have characteristic energy levels, that govern the physical properties of the solid state (most importantly the thermal properties in semiconductors and insulators) [2]. This experiment uses GULP calculations to simulate the wave vector of these phonons. GULP calculations convert ‘real’ to ‘reciprocal’ space. The reciprocal lattice is a Fourier transformation mapping of the ‘real lattice’ also known as the direct lattice. In real space, the atoms are defined by position vectors. In the reciprocal lattice, the k-wave vector defines the body and can be found from the wavelength in equation 2 below.
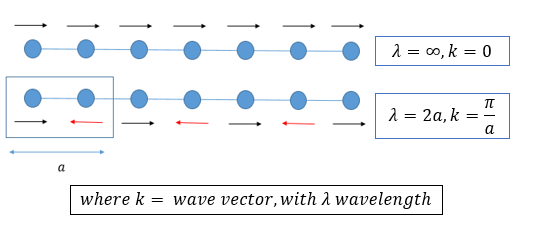
From equation 2 it can be seen that as the energy of vibration increases (and the frequency) so does the value of k. The reciprocal lattice of a FCC lattice is the body centered cubic lattice, and this space is used for analysis to allow simplified modelling of the wave-like vibrations of an infinite lattice. The real lattice parameter a, can be mapped onto the reciprocal lattice as a*, using equation 3. The direction of the wavelength associated with a vibration of the lattice (the phonon) can be modeled in a 1D chain of an infinite chain of identical atoms, as shown in the figure 2 below. This figure demonstrates how a chain of infinite atoms can have multiple vibrational modes.
Tools
As explained above, two methods are used to calculate the thermal expansion coefficient. QHA (the Quasi-Harmonic approximation) uses quantum mechanics to simulate the expansion response a material will have to heat while molecular dynamics (MD) is based on classical methods. A Linux operating system was used to run the computational calculations with a DLV interface for the visualisation of the lattice. GULP was used to simulate the calculations and from these the thermal expansions.
Quasi-Harmonic Approximation
This method follows the harmonic oscillator model to understand particle vibrations. This approach employs the approximation that the potential energy is harmonic (a parabola) with energies oscillating symmetrically around the equilibrium zero-point energy. This assumes constant volume, which we know to be untrue due to expansion under increase in temperature. For this reason, quasi harmonic approximations will be unable to model displacive phase transitions and other phenomenon that are largely dependent on anharmonic interactions [3] . This assumption is overcome (in order to model thermal expansion) by saying the vibrations are volume dependent, and therefore these volumes can be computed using GULP at various temperatures. This approximation therefore does not account for anharmonicity, which we can predict will be demonstrated at higher temperatures in this investigation, as phonon interaction is neglected. The Helmholtz free energy is computed in equation 4 in QHA with various terms, the first being an internal contribution. The second and third term accounting for zero-point energy and the vibration contribution respectively. As previously mentioned, the phonon frequency is volume dependent and stated as temperature dependent, with phonon interaction neglected in QHA. From equation 5 and 6, it can be noted that the Helmholtz free energy has a strong dependence on temperature and volume. Equation 5 can be seen to be analogous to equation 4, with the first term (internal energy) showing the interaction energy contribution, followed by a temperature dependent entropic term. [4]
Molecular Dynamics
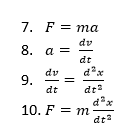
Molecular dynamics is used in this investigation to simulate the vibrations as random motions inside a cell, using a classical Newtonian approach, with constant periodic boundary conditions. In this case, a supercell (64 ions) (seen in figure 1) is used to gain a better representation of the lattice as a whole (compared to a primitive cell used in QHA). These calculations use Newton’s second law of motion; whereby the acceleration of an object resultant of a net force is dependent on the net force acting on the object and the object’s mass, as shown in equation 7. The acceleration of an object is calculated as the rate of change of velocity with time. Following Newton’s second law, equations 8 and 9 are used to construct equation 10 which is used in this experiment to model thermal expansion. At regular time intervals (dt) the configuration of the MgO lattice (supercell) is monitored in order to ultimately model the overall thermal expansion of the material. Each ion is assigned an initial velocity, and this experiment uses 1 femtosecond time intervals. At every time stamp, the forces of the atoms are computed, along with the accelerations. The calculations then update the velocities relative to the initial velocities set, generating a new position vector of the atoms. This is repeated until the energy and temperature of the system settle down. This effectively optimises the geometry of the lattice, minimising the free energy as a function of the atomic positions. From this point, the properties of the system are recorded. From this a trajectory is built, whereby the time interval set is long enough to generate efficient calculations but also short enough to sample the large set of vibrations of the system. In this way, molecular dynamics calculations will take into account the anharmonicity of the model system and therefore will better approximate the system’s behaviour at higher temperatures, which is demonstrated and explained further later in this report.
Experimental
Calculating the Internal energy of the MgO crystal:
This was done by loading the MgO primitive cell model in the DLV interface. A GULP calculation was set up on the model, to compute the energy per unit cell of MgO. The magnesium ion was given a 2+ charge, and the oxygen ions a 2- charge, with a simple Buckingham repulsive potential acting between them (standard potential describing the Pauli repulsion energy and Van der Waals energy over an interaction of non-directly bonding ions with interatomic distance r)[5]. Note: the temperature and pressure were set to 0K and 0GPa. A single point calculation was run, and the output log file was recovered and analysed.
Lattice Vibrations – Computing Phononsː
In order to compute and visualise the phonon dispersion curves, a phonon dispersion calculation was set up in GULP, with Npoints set to 50, and the calculation of phonon eigenvectors specified. Again, the primitive cell was used as the MgO model in this calculation, with the temperature equal to 0K and pressure set to 0GPa. This phonon dispersion calculation computes the phonon frequency along a path in k-space. In this calculation, every possible vibration of the crystal is labelled with a k-vector, relating to the wavelength (and direction) of the vibration. When the calculation was complete, the 2DView window of the program allowed the visualisation of the curves.
A simpler energy level diagram for the phonons was then created by summing over all the states at a particular frequency (i.e. summing over all the k-labelled steps at particular vibrational energies). This output was the phonon density of states. The calculation involved loading the same primitive MgO unit cell and executing a Phonon DOS calculation. The initial DOS calculation employed a 1x1x1 shrinking factor (along the A, B and C directions) which defines the grid of k points where the calculation will perform the summation. The resulting DOS graphs were visualised in the 2DView window and analysed in the report below. This calculation was repeated for a range of shrinking factors: 1x1x1, 2x2x2, 3x3x3, 4x4x4, 5x5x5, 10x10x10, 20x20x20, 21x21x21, 22x22x22, 23x23x23, 24x24x24, 25x25x25, 50x50x50 (choice of grid sizes explained in the results and discussion section.)
Calculating the Free Energy in the Harmonic Approximation:
The free energy was then computed for a range of grid sizes using the QHA. The calculation runs as a sum over all the bands and k-labels (the vibrational modes) of the infinite crystal and again uses a primitive MgO cell as a model. This is approximated as a sum over the finite grid of k points used to calculate the phonon density of states above. A suitable k space grid was therefore required to allow a healthy balance between accuracy (need a grid big enough to model an infinite grid and increase accuracy) and also CPU time (a grid too big would take up too much time to run and therefore would be time inefficient). This grid size was found by using a variety of grid sizes and finding the point of convergence of the free energy. A phonon DOS calculation was set up at 300K (and default 0GPa pressure) and repeated for increasing grid sizes. The log files were recovered and analysed below in the results and discussion section, to find the convergence value for the free energy of the MgO system.
Calculating the thermal expansion in the Harmonic Approximation:
Having found a suitable grid size from the previous calculations (found to be 24x24x24) a number of calculations were run to optimise the structure of MgO with respect to the Helmholtz free energy at increasing temperatures to model the thermal expansion of the MgO primitive cell in the quasi harmonic approximation. The calculations were set up as optimisations (optimising Gibbs free energy) of the phonon DOS, at varying temperatures. These temperatures ranged from 0K-1000K, in 100K step intervals. A few higher temperature calculations were also run, at 1500, 2000 and 2500K. At every temperature, the GULP computes the internal energy at a sequence of geometries, minimising the free energy with respect to the structure. The log files for each temperature were recovered and analysed, in order to later model the change in free energy and change in lattice constant with temperature (see results and discussion section)
Molecular Dynamics:
Finally, MD simulations were run on a supercell MgO lattice model. As outlined in the introduction above, the MD simulation works by following these stepsː
- Computing force F on the atoms
- Computing the accelerations of the atoms (from force = mass x acceleration)
- The velocity of the atoms is then updated relative to the initial velocity assigned to the atoms (Vf=Vi+ a dt)
- The positions of the atoms are then updated (Rf=Ri+ Vf dt)
- This is repeated until the energy and temperature starts to settle.
- once the system has settled, measurements are taken of numerous properties.
The time step selected for this experiment (dt) was 1 femtosecond, a good balance between efficient calculations and a good sampling of all possible vibrations. As mentioned in the introduction, a supercell is used in this calculation as using a primitive unit cell would be meaningless - as this would only represent the k=(0,0,0) point where all cells are in phase. Using a supercell (32 MgO units) means the system more closely represents the infinite lattice structure. The NPT ensemble was selected for this calculation - allowing only the volume of the cell to vary (number of particles, pressure and temperature staying constant). The equilibration steps and production steps were both set to 500.The sampling steps and trajectory write up steps were set to 5. The calculations were run on a range of temperatures from 100K (0K not possible in MD) to 3500K. The log files were again recovered and analysed, and discussed in the section below. The results from this calculation were compared to the QHA results.
Results & Discussion
Internal Energy of the MgO Crystalː
When looking through the output log file of the GULP calculation, the internal energy of the MgO system was found to be -41.07531759 eV per primitive unit cell. This was calculated on a primitive cell model, with a rhombohedral shape of sides 2.9783Å and an internal angle of 60o. This compares quite well to a literature value [1] of 41.976eV per primitive unit cell. This energy relates to the amount of energy needed to pull apart all ions of the crystal (to infinite separation) in other words, the binding energy of MgO. This energy was calculated as a sum of all inter-atomic forces (repulsions and electrostatics) over the infinite lattice.
Computing the Phonon Dispersion Curveː
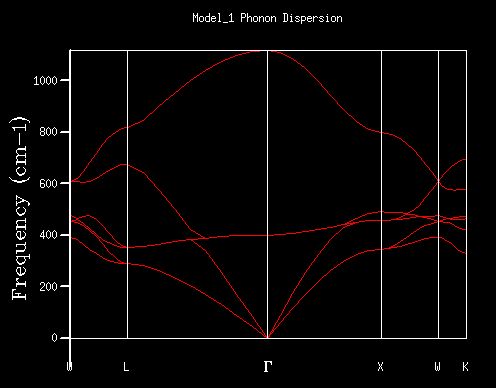
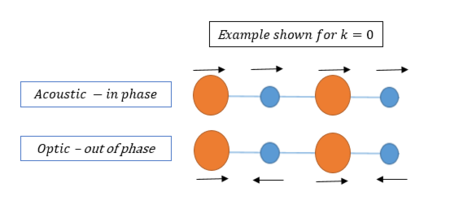
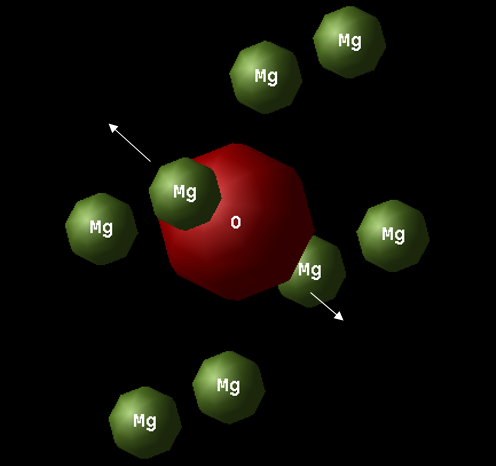
Figure 3 shows the phonon dispersion curve displayed in the 2DView results window in the DLV interface. This is plotted in reciprocal space, (the first Brillouin zone) where for each k-eigenvector a corresponding vibration is plotted with a characteristic frequency. The dispersion plot is, therefore, the k values (x-axis, plotted along the conventional path in space W-L-G-W-X-K following convention) Vs the corresponding vibration frequency. The boundaries of the x-axis relate to the first Brillouin zone, with the middle point (denoted by Γ) relates to the centre of the Brillouin zone, where both the wave vector and its associated vibrational frequency = 0. Noteː The first Brillouin zone refers to a defined primitive cell in reciprocal space, analogous to Wigner-Seitz cells in the direct lattice. [6] The 6 curves on the phonon dispersion graph correspond to three acoustic and three optical branches. These arise from in phase and out of phase movements of atoms (from their equilibrium positions) respectively. This is shown schematically in figure 4. Figure 5 is a screenshot from the 'Animate Model' panel of the 3DView DLV interface, showing phonon mode 117. The arrows show the motion associated with the 117 mode, at a frequency of 399.8cm-1 and k point (0, 0, 0). (The O2- ion oscillates in the direction shown by the arrows).
Computing the Phonon Density of Statesː
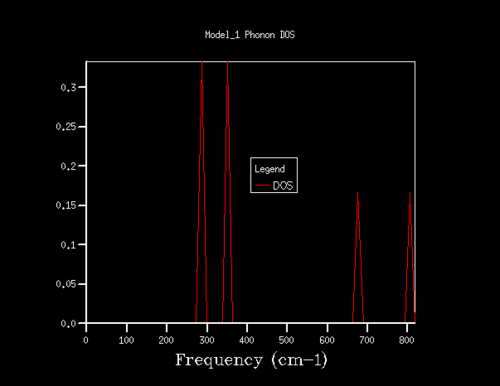
The results of the Phonon DOS calculations (outlined in the experimental) can be seen in the table below, for a range of shrinking values. The x-axis relates to the frequency of vibration, and the y-axis relates to the summation over all k values at the corresponding vibrational frequency (creating the density of state). When the density of states is computed for a single k point (1x1x1 shrinking factor) four distinct peaks can be observed. In order to obtain a smoother average curve, a range of grid sizes was sampled. Although a large range of shrinking factors was investigated, the most interesting are shown below in the table (the ones missing either showed very little difference or were not of any significance to the investigation).
| 1x1x1 | 2x2x2 | 3x3x3 | 4x4x4 | 5x5x5 |
|

|

|

|

|
In table 1, the 1x1x1 grid DOS was computed for a single K point, which can be determined by looking at the log file for that calculation. The tabulated data for these peaks can be seen in table 2. It can be seen that the first two peaks (of equal intensity) have a 2ː1 ratio with the following two peaks of larger frequency. One can assume that this relationship arises from a pair of doubly degenerate vibrations, and this can be compared to the phonon dispersion (Fig. 3) in order to rationalise which k-point this grid is computed for. When a vertical (imaginary) line is drawn on point L on the phonon dispersion curve, one can see that the four curves intercept the imaginary line at the same frequencies of the peaks in the 1x1x1 DOS. It is observed that there are two curves intercepted at degenerate frequencies (at 286 and 351cm-1). This double degeneracy results in the 2ː1 ratio of the peak intensities (first two peaks relative to second two peaks). Looking into the log output file of the phonon dispersion curve, we find a point of coordinates (0.5, 0.5, 0.5) with two doubly degenerate frequencies; 288.49 and 351.76cm-1. Two singly degenerate peaks (676.23 and 818.82-1) are also found. These values match up with the 1x1x1 grid size. This further confirms that the 1x1x1 grid size corresponds to the single L point on the phonon dispersion graph.
| Frequency cm-1 | Intensity (DOS) |
|---|---|
| 286 | 0.333 |
| 351 | 0.333 |
| 676 | 0.167 |
| 806 | 0.167 |
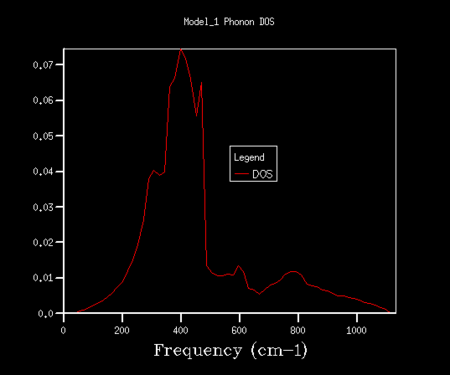
As the grid size increases from 1x1x1 to 5x5x5 in table 1, a change in shape of the DOS can be observed. As the grid size increases, the resolution of the plots also increase and we see a more averaged picture (compared to the four distinct peaks observed in the 1x1x1 single k-point grid). As the grid size increases, more k points are sampled and therefore a greater number of phonons are plotted on the curves. The grid size was therefore continuously increased in order to find a grid size that has a good balance between sampling of phonons (and resolution of curve) and time taken to run the calculations. Some of these are shown in table 3.
| 20x20x20 | 24x24x24 | 50x50x50 |

|
|

|
A good sampling can be observed in the 20x20x20 grid, however still with slightly poor resolution. The grid size was increased periodically from 20x20x20 to 25x25x25, and it was found that 24x24x24 was the optimal grid size. This was determined because the larger grid sizes showed very little difference in resolution (can be seen by comparing very similar 50x50x50 grid size to 24x24x24) and only took longer to run the calculation. For this reason, the 24x24x24 grid was found to be the optimal grid size.
The behavior of other metal lattices under increasing grid sizes can be predicted by using this data. For example, a similar crystal such as CaO would be well represented by the 24x24x24 grid size. This is because CaO and MgO are roughly the same size (literature lattice parameters found to be 4.211 and 4.800Å for MgO[7] and CaO[8] respectively) and therefore their structure in reciprocal space will be similar, allowing 24x24x24 to be a suitable grid space for the two structures. If we were to consider a larger crystal structure, for example a zeolite, this would no longer be a suitable grid size. Using the faujasite mineral to illustrate this, a much larger unit cell, with lattice parameter typically in the 24.64-24.65Å range [9]. The 24x24x24 grid size would be too large a grid size, as the lattice parameter (large in the direct lattice) would be rather small in reciprocal space (reciprocal relationship). A smaller grid size would be better suited to attain accurate free energy data. We can also illustrate this with a metal, for example Lithium. If we compare this metallic structure to MgO, we find a more compact and tightly held structure than in the metal oxide (observed as a lattice of cations in a sea of free flowing electrons). This is seen in the lattice parameter for lithium, 3.51Å [10], which means that in reciprocal space (following equation 3 in the introduction section) the value for a* will be large, and 24x24x24 will be too small a grid space to accurately depict the thermodynamics of the lithium lattice and achieve good resolution.
Calculating the Free Energy in the Harmonic Calculationː
The calculation of free energy over a range of grid sizes functions by summing over all the bands and k-points (vibrational modes) of the lattice, as explained in the experimental above. This was done to find the point of convergence of the Helmholtz free energy, in order to find a suitable grid size (large enough to represent the infinite lattice, but small enough to avoid inconvenient and inefficient CPU time). The graph below (Fig. 6)shows the convergence of the Helmholtz free energy with increasing grid size, with the red line intercept symbolizing the convergence around -40.926483 eV (-3948.779639 kJ/mol unit cells).

The 24x24x24 shrinking factor lies within the convergence region, and therefore is used for the thermal expansion calculations. The following table (table 5) describes the grid size that is appropriate for calculations accurate to 1meV, 0.5meV and 0.1meVː Noteː the kJ/mol units were converted to eV for convenience
| Accuracy | Grid Size | Helmholtz Free Energy eV |
|---|---|---|
| to 1meV | 3x3x3 | -40.9263068 |
| to 0.5meV | 4x4x4 | -40.9264245 |
| to 0.1meV | 5x5x5 | -40.9264828 |
Calculating Thermal Expansionː
As detailed in the experimental, the 24x24x24 grid space was used to run calculations at various temperatures, optimizing the primitive cell structure of MgO with respect to the free energy. The results allow us to compute the thermal expansion of the MgO crystal. Figure 7 below shows the variation of free energy with increasing temperature in the QHA. At low temperatures, the decrease of free energy with temperature is very steady and almost flat until 200K. This can be rationalized by looking at equation 4, the Helmholtz Free Energy equation for QHA. At low temperatures, the zero point energy term and internal contribution terms dominate the free energy and a weak dependence on temperature is observed. As temperature increases, the third term becomes an ever increasing contribution to the overall QHA free energy (the vibration contribution term). This trend can also be rationalized by using equation 5 in the introduction - where F=U-TS. As temperature increases (approximately upwards of 500K) we can observe a linear dependence of the free energy on temperature. This is because the entropic term dominates at higher temperatures, with -TS increasing massively and therefore the free energy decreases with it. This however assumes no variation in entropy with temperature, which can give rise to the non-ideality observed (not perfectly linear).
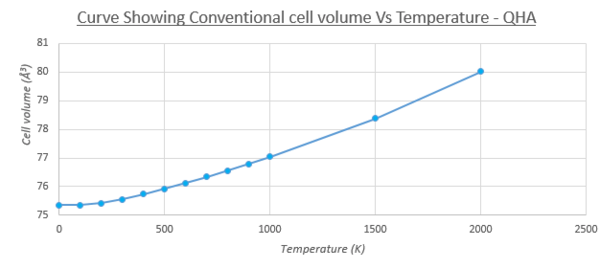
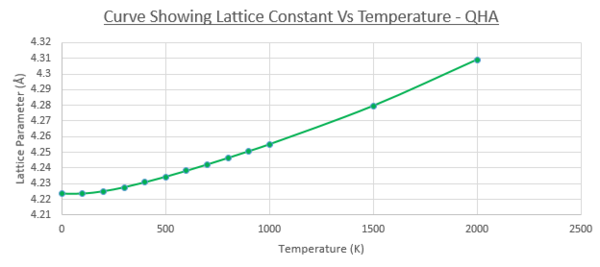
As explained in the introduction, materials have a strong tendency to expand under an increase in temperature, due to an increase in kinetic/thermal energy and subsequently stronger atomic motion, leading to a larger average inter-atomic distance between atoms of a lattice. This can be observed in figure 8 and 9, that show the increase between the conventional cell volume (primitive cell volume multiplied by 4) with temperature, and the same trend observed with the lattice constant (again of the conventional cell for convenience). In both curves, a non-linear and linear component of the curve can be observed. The melting point [11]of MgO crystals is expected around 3098.15K, and a drastic increase can be seen in volume/lattice constant as temperature approaches this value. The non-linear portion of the curve (0-500K) can be modeled as a parabola, with steady increase with temperature. This is due to the zero point energy being the major contribution (similar to the Helmholtz free energy Vs temperature at low temperatures). The inter-atomic distances between the atoms in the lattice are larger than the amplitudes of atomic vibrations exerted between 0-500K, and so the dependence of the ground state energy on the deviation from the equilibrium atomic distances can be assumed to be quadratic, hence the parabola shape at low temperatures (this forms the basis of the quasi-harmonic approximation) [12].
Above 500K, a linear relationship can be observed, which is due to the vibrational contribution (third term) of the Helmholtz free energy dominating the energy of the system, with phonon vibrations larger than the zero-point motion observed at lower temperatures. This linear increase is used to find the thermal expansion coefficient, by taking the gradient of the linear portion of the curve. The equation of the linear trend line was found to be y = 0.0008x + 18.509. This gradient is substituted into equation 1 in the introduction, in order to calculate the thermal expansion coefficient. The initial volume of the unit cell was taken to be the volume at 500K. Table 6 shows the results, as well as literature data found.
| Experimental (K-1) | Literature [13](K-1) |
|---|---|
| 4.21494x10⁻⁵ (500-2000K) | 4.0000x10⁻⁵ (300K) |
The similarity between this data and literature data for the coefficient of volume thermal expansion can confirm that the QHA is a good approximation technique in the temperature range investigated. As the temperature increases, the density of the MgO crystal decreases (from literature from 3580 to 2445kgm-3 when decreasing temperature from 300 to 1250K)[13] which can be attributed to the increase in equilibrium concentration of Schottky defects, which are thermally generated.
The QHA is however, still an approximation. At high temperatures, the model we are using does not account for this decrease in density or increase in defect concentration [13], as it assumes the same lattice structure as the original model loaded into the GULP calculation. Therefore the values for the volume above will have a larger degree of error at higher temperatures, where the true entropic term is much larger than the computed term. With temperature, the entropy of the system will increase drastically due to increased thermal motion and ordering of the lattice, and therefore the actual -TS term for the free energy will be much more negative than computed above. Since the thermal expansion coefficient calculated in this experiment compares well to the literature value, we can conclude that this error, and that of anharmonicity negligence, is not too significant.
Molecular Dynamicsː
Molecular Dynamic simulations were run (as detailed in the experimental) to find the variation of the lattice volume vs increasing temperature. The results are featured in figure 10.

A MP4 file of the vibrations at 300K can be downloaded from the following fileː File:MgO MD calc 300K.mp4
The same increase can be seen in both the MD and QHA simulated graphs, with notable differences. A more linear curve is observed when using molecular dynamics simulations, with the absence of the parabolic component observed in figure 8 (QHA). This is because the MD simulations neglect the zero point energy contribution to the free energy, and from this one can conclude that it is not suitable for use at low temperatures (where QHA would model the system better). It can be seen that after 1500K, the curve diverges from the linear component shown in blue (lower temperatures). This is because the Molecular Dynamics calculation will take into account anharmonicity of the system at higher temperatures, which is ignored in the quasi-harmonic approximation. Due to the nature of the simulation (repeated averaging of the kinetic motion/vibrations of the ions in femtosecond time intervals, in order to calculate the volume and energy of the system) the accuracy of the data produced at higher temperature could be improved. At high temperatures, the thermal energy is so large that the average of the kinetic energy/force of the atoms etc may not be representative of the system as a whole. As an extension, a larger cell (more ions) could be used with smaller time intervals in order to better represent the variation of the volume with increasing temperature. This follows standard statistical analysisː increased sample size, more accurate representation when averaged.
The linear portion of this graph was used to calculate the thermal expansion coefficient of MgO, following equation one of the introduction. The result is shown below in table 7, using 0.0182 as the rate of change of volume with temperature. This time the value is compared to another simulation study, and to the experimentally determined value in literature. Noteː the calculation was made from 400K-1500K for the linear component of the graph, ignoring the non-representative values at lower temperatures that diverge from linearity.
| Calculated (K-1) | Literature (MD simulation)[14](K-1) | Literature (exp. determined) [13](K-1) |
|---|---|---|
| 3.57482x10⁻⁵ (400-1500K) | 3.8400x10⁻⁵ (500K) | 4.0000x10⁻⁵ (300K) |
In order to get more representative data at lower temperature, further calculations can be added to the simulation. These are highlighted in paper[14], that demonstrated that including higher-order quantum correction terms to the system at low temperatures allow the molecular dynamics simulation to follow the experimentally found trends more closely.
Molecular Dynamics Vs the Quasi-Harmonic Approximationː
When comparing the thermal expansion coefficient calculated with the MD and QHA simulations, both are comparative to the literature values provided above, however QHA seems to have a higher level of similarity. This is because the MD simulations (classical approach) are better suited to high temperature systems, where anharmonicity is accounted for, with a better understanding of the melting of the material. The ignorance of the zero point energy contribution results in less accuracy in the data collected. The inclusion of the anharmonicity contribution accounted for in molecular dynamics calculations allow a better representation to the system at higher temperatures, contrary to the QHA simulations (quantum mechanical) that break down due to break down in the harmonic approximation.
In order to compare the two simulation methods to literature values, a different approach was used. Instead of looking at the variation of cell size and free energy with temperature, the thermal expansion coefficient was calculated with QHA and MD for every temperature, by finding a suitable quadratic fit (instead of just looking at the linear fit). The quadratic trendlines for QHA and MD are shown in table 8, were differentiated in order to find an equation for dV/dT. This equation was then divided by the initial volume of the systems, to give an equation for alpha (thermal expansion coefficient) as a function of temperature. These were plotted against literature data found in reference [13]. A temperature range of 100-2500K was sampled. For the literature, the polynomial used to model alpha with temperature is stated below (Figure 11).
| QHA | MD |
|---|---|
| V = 7x10⁻⁷T2+0.0011T+75.244 | V=2x10⁻⁷T2+0.0019T+74.732 |

The results are displayed in Figure 12, a curve showing the two computational models employed and a literature curve, to compute how well the computational models compare to the actual experimental values. It can be seen that at higher temperatures, the molecular dynamics simulation better represents the true values for the thermal expansion coefficient, as expected due to the acknowledgement of the anharmonicity of the system at higher temperatures. Similarly, at lower temperatures, the QHA simulation better represent the experimental model, confirming that having the zero point energy term in the simulation creates a more accurate picture of the system compared to the real world.

Conclusion
To conclude, both the QHA and MD approach yielded thermal expansion coefficients coherent with literature values found. The molecular dynamics approach demonstrated its advantage in simulating the lattice system at high temperatures, by following experimental trends to a larger degree than the QHA approach. QHA allowed accurate modeling of the thermal expansion coefficient at lower temperatures, by including the zero point energy term (neglected in MD, ). A k space of 24x24x24 was found to be optimal for the calculations ran, with a healthy balance between good representation of the lattice as a whole, and efficient use of CPU time. This was found by finding the convergence point of the Helmholtz free energy with increasing grid size.
Further investigations would be to use a larger cell, with smaller time intervals in the Molecular Dynamics calculation. This would allow a greater sampling of vibrations, and a better picture of the infinite lattice. Another extension could be to repeat the calculations performed on a CaO lattice. Due to a different lattice cell type, it would be interesting to observe how the different electrostatics of the system would compare. A good starting point for this extension would be source[15], that concludes that the quasi-harmonic approximation accurately describes the thermal fluctuations up to 1000K for MgO, but poor accuracy is found for low temperatures for the CaO case, where the polarizability of the calcium ions increases the anharmonicity of the lattice. It would be predicted that the molecular dynamic calculations would be better suited for this type of softer crystal structure.
References
- ↑ 1.0 1.1 J. Kotz P. Treichel, J. Townsend, Chemistry and Chemical Reactivity, Vol 2, Cengage Learning, Ch. 13.3, p599-600
- ↑ J. Balaguru, Lattice vibrations, Phonons, Specific Heat Capacity & Thermal Conductivity, NPTEL - Electrical & Electronics Engineering, p7. Linkː http://www.nptel.ac.in/courses/115106076/Module%209/Module%209.pdf
- ↑ M. Dove, Introduction to Lattice Dynamics (Cambridge Topics in Mineral Physics and Chemistry) Cambridge University Press, 1993, Ch. 5, p65-75.
- ↑ F. Mopsik, The Quasi-Harmonic Approximation and a Generalized Grlineisen Equation of State, JOURNAL O F RESEARCH of the Natianal Bureau of Stonda rds-A. Physics and Chemistry Vol. 77A, No.4, 1973.
- ↑ G. Strobl, Condensed Matter Physics: Crystals, Liquids, Liquid Crystals, and Polymers, Springer Science & Business Media, 2012, Ch. 1, p14.
- ↑ G. Spence, E. Katz, Theory of Certain Energy Surfaces and Brillouin Zones: Quarterly progress report, June 1954, Engineering research institute of University of Michigan, 1954.
- ↑ Collaboration: Authors and editors of the volumes III/17B-22A-41B, Magnesium oxide (MgO) crystal structure, lattice parameters, thermal expansion, II-VI and I-VII Compounds; Semimagnetic Compounds, p 1-6
- ↑ Collaboration: Authors and editors of the volumes III/17B-22A-41B, Calcium oxide (CaO) crystal structure, lattice parameters, thermal expansion, II-VI and I-VII Compounds; Semimagnetic Compounds, p 1-3
- ↑ B. Jha and D. Singh, Fly Ash Zeolites, Advanced Structured Materials 78, 2016, p7-27
- ↑ M. Nadler and C. Kempfer, Crystallographic Data 186. Lithium, Anal. Chem., 1959, 12, p2109.
- ↑ W. Haynes, CRC Handbook of Chemistry and Physics. 91st ed. Boca Raton, 2010, p4-74
- ↑ S. Baroni, P. Giannozzi, E. Isaev, Thermal Properties of Materials From Ab Initio Quasi-Harmonic Phonons', Reviews in Mineralogy and Geochemistry, Vol 71, 2009, p3-15.
- ↑ 13.0 13.1 13.2 13.3 13.4 13.5 A. Madhusudhan Rao, K. Narender, Studies on Thermophysical Properties of CaO and MgO by 𝛾-Ray Attenuation, Journal of Thermodynamics, Vol 2014, p1-8, 2014.
- ↑ 14.0 14.1 M. Matsui, Molecular dynamics study of the structural and thermodynamic properties of MgO crystal with quantum correction , J. Chern. Phys., Vol. 91, No.1, 1 July 1989
- ↑ A. Erba, M. Shahrokhi, R. Moradian, R. Dovesi, On how differently the quasi-harmonic approximation works for two isostructural crystals, The Journal of Chemical Physics, Vol 142.


