Rep:ITV1
Tim Barrett - Third Year Computational Lab - Module 3
The Cope Rearrangement
The Cope Rearrangement, developed namely by Arthur C Cope, is a example of a [3,3]-Sigmatropic rearrangement of 1,5-dienes. In this exercise the Cope rearrangement of the simplest example; 1,5-hexadiene will be modelled and transition states of such a rearrangement probed. Using this simple example has inherent advantages not only for the simplicity of the model but also the symmetric nature of the reaction profile makes the knowledge reaction direction and limit number of reactant and product molecules to be modelled.
Modelling Reactants and Products
As mentioned previously the reactant and product molecules in the reaction modelled are both; 1,5-hexadiene. The molecule has ten known stable configurations shown in Appendix 1 (actually 729 possible configuration from three freely rotatable single bonds and six possible dihedral angles - 63)
a+b) The 1,5-hexadiene in both the anti and gauche arrangement was firstly modelled using Gaussview and then used to create a Gaussian input file for geometry optimisation through energy minimisation using the Hartree-Fock method and the basis set of 3-21g (a small double-ζ basis set). This input file was submitted to the Gaussian software for calulation (relevant section of input file below)
# opt hf/3-21g geom=connectivity
d)The resultant geometries of the optimised anti and gauche structure showed the energy, structure and symmetry of the anti:1 and gauche:3 conformations respectfully.


c) The expected lowest energy conformation would be that has the lowest steric interaction. Thus in the anti conformation the arrangement that orientates all the hydrogens away from each other would minimise steric clash and be of lowest energy. The anti 1 arrangement already achieved has such orientation of the hydrogens and would expect to be the lowest anti conformer. To check this hypothesis the molecule was redrawn with a reduced dihedral angle (smallest) between the vinyl and methylene hydrogen (56° to 30°) and then reoptimised - this yielded the anti:2 arrangement (d) of higher energy with the smallest dihedral angle of 55°.

It is also therefore expected that the gauche would be of higher energy than the anti due to steric strain through bringing the alkene group closer in proximity to each other, however the Gauche conformation; gauche:3 found appears to be lower in energy by 0.04kcal/mol compared to the anti:1 arrangement. The gauche:3 arrangement however does orientated the alkenes in different orientation minimising the steric interactions and the smallest dihedral angle between the vinyl and methylene protons is 58° thus slightly less steric clash between said protons than in anti:1 arrangement, perphaps explaining such energy differences.
Output Files
e) Reoptimisation with Higher Level Basis Set
The optimised structure Anti:2 (HF, 3-21g) modelled earlier showed the same energy and symmetry to that given in Appendix 1. The structure was then re-optimised using the higher level method and basis set of DFT-B31YP and 6-31G(d) repectfully. The output structure can be seen below (output file:Anti 2 BBS ).

As can be seen visually there appears to be little difference between the structures optimised with the different basis sets - however through measurements in Gaussview its shows small difference in the bond angles of the two structures.
| Bond Angles/Dihedral Angles | HF/3-21G | DFT-B3LYP/6-31G(d) |
|---|---|---|
| C1-C2-C3 | 124.8° | 125.3° |
| C2-C3-C4 | 111.3° | 112.7° |
| C3-C4-C5 | 111.3° | 112.7° |
| C4-C5-C6 | 124.8° | 125.3° |
| C1-C2-C3-C4 | -114.7° | -118.6° |
| C2-C3-C4-C5 | -180.0° | -180.0° |
| C3-C4-C5-C6 | 114.7° | 118.6° |
The bond angles for the DFT method optimised geometry all appear to be equal or larger than those in the hartree fock optimised structure - the greater angles would suggest a destabilisation relative to the most stable 109° (sp3 carbon) and 120° (sp2 carbon) however the larger bond angles will minimise destabilising steric replusion. There are also small discrepancies between the two optimised structures in the bond lengths - as can be seen in the table below.
| Bond Length/Angstroms | HF/3-21G | DFT-B3LYP/6-31G(d) | Literature1 |
|---|---|---|---|
| C=C | 1.32 | 1.33 | 1.34 |
| C(H)-C(H2) | 1.51 | 1.50 | 1.51 |
| C(H2)-C(H2) | 1.55 | 1.55 | 1.54 |
As can be seen in comparison between each optimised model and the literature it can be seen to show only minor differences with only discrepancies of maximium one degree in bond angle and 0.01 angstroms. It is difficult to compare accuracies to experimental values as certain literature parameters better correlate to one model and some to the other. It is assumed that the higher level basis set gives the more accurate geometry, however in this molecule the two basis sets produce similar geometries thus the HF, 3-21g produces a structure similar in accuracies to the higher level DFT-B31YP, 6-31G(d) method. As the HF, 3-21g requires less computational time, further models of such molecules can be optimised using this basis set and produce relatively accurate geometries.
g) Frequency Analysis of DFT Optimised Anti:2
A frequency analysis of the optimised structure (DFT-B31YP, 6-31G(d)) of anti:2 was completed using the following gaussian input code.
# freq b3lyp/6-31g geom=connectivity
The calulation converged - yielding all positive vibrational frequencies. Optimisation changes the molecule until the first derivative of the energy surface equates to zero, therefore a maxima or minima. Vibration calculation takes the second derivative of the energy surface and therefore a positive frequency equates to a energy minimium. Negative frequencies would suggest a incorrect optimisation of the molecule. Therefore the all positive frequencies shows that the geometry has successful converged to a global minimium in energy.
The vibrational analysis also calculates the overall energy of the molecule and combine with the entropy contribution to give the overall gibbs free energy (below 'Sum of electronic and free energies'). These thermodyamic properties can be directly compared to experiment values to confirm further the correct model structure of the molecule. See below relevant section of gaussian output file, all units in Hartree energy.
Sum of electronic and zero-point Energies=           -234.469204
Sum of electronic and thermal Energies=              -234.461857
Sum of electronic and thermal Enthalpies=            -234.460913
Sum of electronic and thermal Free Energies=         -234.500777
Transition State Modelling
Unlike geometry optimisation through energy minimisation to achieve a tranisition state the optimation procedure has to converge to a energy maximium of the potential surface. This would mean that through vibrational analysis the optimisation of a tranisition state can be confirmed through negative vibration frequencues known as imaginery frequencies. This section will model the transition states of the cope rearrangement. The rearrangement can go through either one or two transition states: the boat or chair (seen below).

Chair Transition State
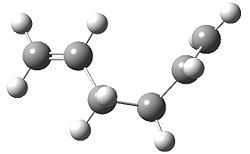
a) The first step in the procedure was to model the fragments of the transition state broke apart by the forming and breaking bonds - creating two identical allylic fragments. The allylic fragment was optimised using the Hartree Fock Method and 3-21g basis set (shown previously to give good accuracy for this molecule).
b) The chair tranisition state was modelled first using two of the allylic fragments arranged in a chair like orientation with reacting carbons seperated at 2.2 angstroms and then optimised to a transition state (Berney) as well as vibrational analysis using the following Gaussian input code.
# opt=(calcfc,ts,noeigen) freq hf/3-21g geom=connectivity
The transition state optimisation was completed using again the Hartree Fock method and 3-21g basis set, the calulation was setup to calculate the force constants once and set allows for more than one imaginary frequency. This calculation yielded the structure you see below.

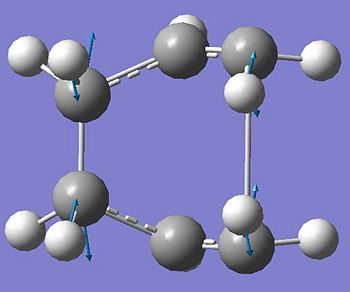
The optimised structures shows a reactive carbon carbon seperation of 2.02 angstroms and a imagnery frequency at -818cm-1 corresponding to the bond making or breaking in the cope rearrangement (see Gaussview vibration visualisation picture below).
The transition state optimisation method used, reaches the estimated transition state through ascending the potential energy surface starting from the initial structure modelled - if this initial estimate is poor then the tranisition state achieved in the calculation may be inaccurate. Another method of transition state optimisation is achieved through firstly optimising the estimated structure to a minimium energy while fixing the seperation between the reactive centres, followed by optimising to a transition state. This method creates a better inputed structural arrangement for the transition state optimisation.
c+d) The procedure described was carried out on the chair transition state input used prevously but with the reactive carbons seperation fixed at 2.2 anstroms for optimisation to a energy minimium followed by optimisation to a transition state (relevant input below).
# opt=(ts,modredundant,noeigen) freq hf/3-21g geom=connectivity
This optimisation yielded the transition state below again with reactive carbon carbon seperation of 2.02 angstroms.

The new optimised transition state visually shows no difference to the first optimised structure and shows only maxium 0.001 angstrom differences in bond length. The energy calulated for the second optimised structure is -231.61932239 au compared to -231.61932229 au for the first optimisation, so is therefore lower in energy than the first optimisation suggesting the first optimisation was a better representation of the tranisitition state, but the differences are very small and thus could be in line with error in the calculation. Therefore it can be assumed that the initial structure input in the first optimisation was a good estimate.
Output Files
Chair Opt 1 DOI:10042/to-4790 Chair Opt 2 DOI:10042/to-4791
Boat Transition State
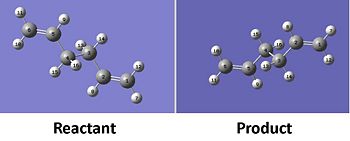
The optimisation of the Boat transition state was achieved using the QST2 Method which uses the reactant and product molecule to follow the reaction profile to the transition state. Using the optimised anti:2 structure modelled earlier the reactant and product of the cope rearrangement were modelled (see below).

The reactant and product models was then optimised to a transition state using the following Gaussian input code.
# opt=(qst2,noeigen) freq hf/3-21g geom=connectivity
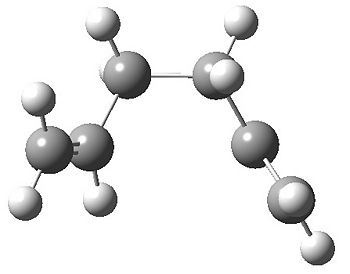
The calculation failed to converge to a transition state, the outputed structure more resembles the chair transition state (see below). It appears that the optimisation method did not rotate any the bonds that may lead to the boat transition state therefore it can assumed the start structure is two far away from the transition state structure.

The conformation of the input reactant and product for the QST2 method was altered such that the central C-C-C-C dihedral angles were changed for 180° to 0° and the inside C-C-C bond angle was reduce to 100° from around 110°. The new input arrangements can be seen below.
These new arrangements were then optimised again using the QST2 method and the following boat transition state was achieved. The reactive carbon seperation is 2.14 angstroms (mucg larger than in the chair 2.02 angstroms), a imagnery frequency was seen at -840cm-1 again corresponding to the bond making and breaking of the cope arrangement (see below).

Output File
Boat Opt 1 (Failure) DOI:10042/to-4792 Boat Opt 2 DOI:10042/to-4793
Chair and Boat IRC
Both that of the Chair and Boat transition state were successfully modelled, knowledge of the reactant and product geometries is still unknown. The IRC calculation (Intrinsic Reaction Co-ordinates) can be used to find out which reactant geometry leads to each transition state, the calulation involves making small changes in the transition state geometry to minimise energy until a energy minima is achieved (i.e the reactant). As mentioned previously the reaction is symmetrical and therefore the calculation need only be run in a single direction to achieve the product and reactant geometry.
The IRC calulcation was firstly completed on the Chair transition state with 50 iterations and calulating the force constants once.
# irc=(forward,maxpoints=50,calccfc) hf/3-21g geom=connectivity
The calculation did not yield a structure that was one of ten most stable structures for the molecule, the calculation was re-run this time calculating the force constants at every step, yielding the structure below with an energy of -231.69167 au (matching in both geometry and energy to the Gauche 2 arrangement in Appendix 1.


As can be seen from the above graphs the IRC showed a continuous pathway to the output with each step lowering the energy until a minima was reached in 47 steps. This postulates that the gauche 2 arrangement passes through a chair transition state in the Cope Rearrangement.
The same calculation was applied to the Boat transition state giving the below structure, this arrangement matching very well to the gauche 3 geometry, with an energy of -231.6919 au which is closest to the gauche 3 energy given in Appendix 1.

This output postulates that the gauche 3 arrangement passes through a boat transition state in the Cope Rearrangement.
Again the above IRC graphs show a continuous pathway to the outputted structure through energy minimisation and reached a minima after 66 iterations.
Output Files
Chair IRC DOI:10042/to-4794 Boat IRC DOI:10042/to-4795
Reaction Activation Energy
Through modelling of the reactants and transition states we have gain the knowledge of their respective energies, through this the activation energy for the cope rearrangement can be calulated. To achieve a more accurate calculation data; the tranisition states were re-optimised (as well as vibrational analysis) using the DFT-B31yp method and 6-31g(d) basis set. The summary of the results is given below (the reactant in this case is assumed to be the Anti:2 conformer and chair from first optimisation used, table code taken from Mod:phys3).
Summary of energies (in hartree)
| HF/3-21G | B3LYP/6-31G(d) | |||||
|---|---|---|---|---|---|---|
| Electronic energy | Sum of electronic and zero-point energies | Sum of electronic and thermal energies | Electronic energy | Sum of electronic and zero-point energies | Sum of electronic and thermal energies | |
| at 0 K | at 298.15 K | at 0 K | at 298.15 K | |||
| Chair TS | -231.619322 | -231.466700 | -231.461341 | -231.556983 | -234.414930 | -234.409009 |
| Boat TS | -231.602802 | -231.450933 | -231.445303 | -234.543080 | -234.402304 | -234.395970 |
| Reactant (anti2) | -231.692535 | -231.539541 | -231.532567 | -234.611731 | -234.469204 | -234.461857 |
*1 hartree = 627.509 kcal/mol
Summary of activation energies (in kcal/mol)
| HF/3-21G | HF/3-21G | B3LYP/6-31G(d) | B3LYP/6-31G(d) | Expt. | |
| at 0 K | at 298.15 K | at 0 K | at 298.15 K | at 0 K | |
| ΔE (Chair) | 45.71 | 44.69 | 34.06 | 33.16 | 33.5 ± 0.5 |
| ΔE (Boat) | 55.60 | 54.76 | 41.98 | 41.34 | 44.7 ± 2.0 |
As expected the higher basis set calculation provided an activation energy much closer to the experimental values. From the activation energy (if under kninetic control) it postulates that the reaction would procede through the chair transition state as this has lower activation energy for the reaction. However in this case we are assuming the reactant is in the conformer anti:2, while calculated previously the Gauche:3 had lower energy and is expected to be the most stable arrangement.
The additional Diels alder section of the project was not completed, as I am sure your aware, due to problems with the wiki site leaving us with less than half alloted time for the project.
Output Files
Chair DFT DOI:10042/to-4796 Boat DFT DOI:10042/to-4797
References
1. G. Schultz, I. Hargitta, J. Mol. Struc., 1995, 346, 63-69
