Rep:HJK114MgO
Introduction
History
The study of vibrations in materials began in 1905 with Einstein's seminal paper on Brownian motion that confirmed the existence of atoms[1][2]. Then, only 2 years later, he used Planck's theory of radiation to explain the temperature-dependence of the heat capacity of solids through quantised atomic vibrations[3]. Born, Von Karman and Debye then developed this work so that the vibrations were no longer viewed as having a single, average frequency[4]. Their work laid the foundations of our current understanding of lattice dynamics.
MgO
Three-dimensional crystal lattices can be classified into 14 different general types; known as Bravais lattices[5]. A Bravais lattice is an infinite array of discrete points that is identical in appearance from whichever of the points the array is viewed; it displays translational invariance[6].
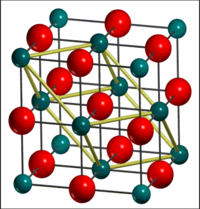
MgO is an ionic crystal with a face-centred cubic (FCC) structure. This is also known as a cubic close-packed (CCP) structure and is prevalent amongst metallic elements and their compounds because it maximises nearest neighbour interactions through a coordination number of 12; hence minimising the free energy. The electronic configuration of the ions leads to a closed electronic shell, as in the noble gas atoms[5]. Consequently, the charge distribution of the ions is spherically symmetric[5]. The main contribution to the cohesive, binding energy of the crystal is the electrostatic interaction between the ions, also known as the Madelung energy.
Interatomic Potential
The Coulomb-Buckingham Potential is used to describe the interatomic attractions and repulsions, respectively.
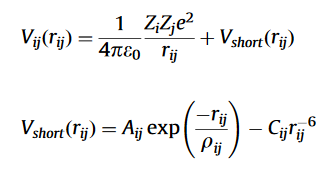
where
- Zi /Zj is the effective charge. For MgO these are +2e and -2e, respectively.
- Aij and ρij are the parameters of repulsion.
- Rij is the distance between atoms i and j (Å)
- Cij is the Van Der Waals constant.
Reciprocal Space
It has been found that the vibrational motion of atoms about their equilibrium position in condensed phases (liquids and solids) can be adequately described by harmonic, travelling waves[4]. These waves can be characterised by their wavelength, λ, angular frequency, ω, amplitude and direction of travel[4]. However, the wavelength of these vibrational waves can vary in scale from infinite down to interatomic spacing[4]. Therefore, it is convenient to work in reciprocal space (also known as k-space or momentum-space) and label each wave with a value of k, known as the wavevector[8]. The largest unique values of k are ±π/a, where a is the lattice constant of the crystal unit cell in 'real' space. These values of k define the unit cell in reciprocal space which is known as the Brillouin zone[8]. The lattice constant in reciprocal space is a* and is equal to 2π/a. The significance and advantage of reciprocal space lies in the fact that all the vibrational waves of a lattice, no matter how long their wavelength, can be contained within the Brillouin zone[5].
Phonons
When the energy of these vibrational waves/modes are quantised and treated quantum mechanically, they are known as phonons[9]. A phonon is a quantum unit of a crystal lattice vibration[9]. Atoms in crystals do not vibrate independently of each other and so phonons are the collective modes of vibration.[6] The energy of a phonon is ħω (analogous to photons with energy hν)[9]. Each phonon is labelled by a k value. Due to the translational invariance of the crystal lattice, a phonon with wavevector k can also be described by k + 2πn/a[5]. This further reaffirms the fact that all unique k values are contained within the (first) Brillouin zone[5]. Moreover, the number of allowed k values in a Brillouin zone is equal to the number of primitive cells in the crystal[5]. The translational invariance of a crystal means that its observable properties can be described by Bloch functions in accordance with Bloch's Theorem.[6]
Objective
The aim of this lab is to study the thermal expansion of MgO by examining its behaviour up to its melting point of 3250 K[10] and to compare and contrast thermal expansion coefficient, α, calculated using 2 computational methods:
- The Quasi-Harmonic Approximation (QHA)
- Molecular Dynamics (MD)
The molecular modelling code, GULP (General Utility Lattice Program), was used within the graphical modelling interface, DLVisualize.
Thermal Expansion Coefficient
- V0 (Å3) is the initial cell volume at 0K
- V(Å3) is volume at temperature T(K)
Methodology
Lattice Dynamics (LD) - The Quasi-Harmonic Approximation
The quantum mechanical treatment of the vibrational modes quantises the energy of the phonons in this way:
εn = (n + ½ħω)[9]
The Heisenberg Uncertainty Principle states that the position and momentum of a particle cannot both be known simultaneously. Therefore, since the momentum of phonons is known (ħk), the position cannot be; at absolute zero the atoms in a crystal must vibrate about their equilibrium position, and this vibrational energy is known as the zero point energy, ½ħω[9].
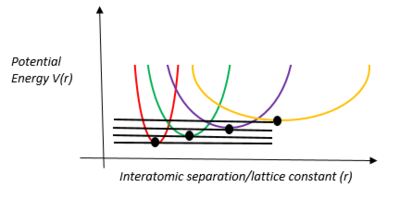
In the Taylor series expansion of the interatomic potential around the equilibrium point, the first derivative is zero. The second derivative is parabolic in nature, as shown in the diagram above. The harmonic approximation ignores the subsequent higher-order terms; these are known as anharmonic terms. For example: the cubic term represents the asymmetry of the mutual repulsion of the ions and the quartic term represents the softening of the vibrations at large amplitudes. They are very important and they explain equilibrium properties such as the thermal expansion of solids and transport properties such as the thermal conductivity[5].
The harmonic approximation is valid for small amplitude vibrations, at temperatures reasonably far from the melting point[5].
The Quasi-Harmonic Approximation, operating in reciprocal space, retains the parabolic and energy-quantised nature of the harmonic approximation but it allows the force constants to change with the expansion of the lattice. The parabola is still retained, but at different volumes that are the result of different temperatures.
The Helmholtz-Free Energy in the QHA can be simply defined as:
A = E0 + Emodes
and more fully as
- E0 is the temperature-independent internal potential energy associated with interatomic interactions
- Emodes is the contribution from the vibrational modes
- ½ħω is the zero point energy
- the third term is vibrational entropy;
- j represents phonon bands
- k is abbreviation of k-point in the reciprocal space
- ℏ is reduced Planck's constant
- ω is angular frequency (rad/s)
- kB is Boltzmann constant
- T is temperature in K.
Limitations: the frequency of a lattice mode is independent of volume and so the vibrational modes do not contribute to to the pressure (the partial derivative of the free energy wrt volume at constant temperature) and so not to the thermal expansion[9]. However, in the QHA the frequency is allowed to vary with the volume (or other thermodynamic properties). In the pure harmonic approximation the size of the crystal is independent of the temperature- thermal expansion and bond dissociation at the melting point is not possible[5]. In both the HA and QHA the phonons do not couple or interact with each other as a result of the neglected anharmonic terms. Without these anharmonic terms a perfect crystal would have infinite thermal conductivity[5].
Molecular Dynamics (MD)
Molecular Dynamics (MD) uses Newton's Second Law to classically solve the motion of Lagrangian particles (atoms, molecules) in real space[4]. Its value lies in the simplicity of its mathematical formulation, which leads to efficient calculation of the thermodynamic properties of a system which evolve and update with each timestep of the calculation[2].The force acting on each atom of the system can be obtained by the summation of the derivative of the interatomic potential energy surface. If the interatomic potential is known, then the force acting on the atoms can be simulated and so the evolution of the system's behaviour can be determined.
- is the force acting on atom i.
- is the mass of atom i.
- is the acceleration of atom i, the rate of change of its velocity.
- is the velocity of atom i.
- is the position of atom i.
As the above equation shows, the velocity and position of the particles with each timestep can be calculated.This simulation allows the centre of mass of atoms to move and bonds to break. It gives a time average of the system's properties. A femtosecond timestep was used with 500 equilibration and production steps and 5 trajectory write and sampling steps.
Limitations: The zero point energy is ignored. It functions under the ergodic hypothesis. If a system takes a long time to go between configurations (due to high activation barriers) and ergodicity is broken, the simulation will have to run for a very long time or it will never accurately characterise the system (e.g. glasses and proteins). MgO is not as complex as these systems but, at low temperatures, the thermal energy available to access different configurations within a reasonable time decreases and so MD is less accurate at lower temperatures (also because of no zero point energy). Moreover, characterising long-wavelength phonons would require large simulation cells, the 32 MgO units supercell employed is a compromise between characterising longer wavelength/more phonons and maintaining reasonably short simulation times.
Results and Discussion



Lattice Dynamics (LD)
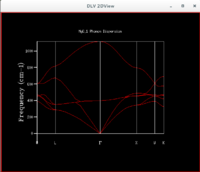
A dispersion curve, such as that shown in figure 1, displays the angular frequency, ω, of the phonons as a function of their k value[5]. If both axes are multiplied by ħ, the dispersion curve becomes a relation between the vibrational energy ħω and the momentum ħk[9]. However, this is not true kinematic momentum because of the k + 2πn/a relationship and so it is referred to as crystal momentum[9].
The density of states (DOS) at a particular angular frequency, ω, is the summation over the 'k points' of the phonons that have that angular frequency/vibrational energy(ħω)[9]. Phonons are bosons and so multiple phonons can have the same angular frequency/vibrational energy[4].
The DOS reveals the number of vibrational modes/phonons that share a particular angular frequency/vibrational energy. Ideally, all the k points (vibrational modes) would be sampled and included in the summation for the density of states; however in practice this is not computationally possible. Therefore, it is necessary to find the minimum number of k points needed to produce an accurate DOS. Once the optimal grid size has been found that produces a smooth, continuous DOS that describes the average energy and density of the vibrational modes present in the lattice as accurately as possible, this DOS per unit frequency range can be used to compute further properties such as the Helmholtz Free Energy or heat capacity[9].
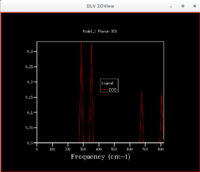
Figure 1 shows the 2D dispersion curve for 50 sampled k points. The k point, Γ, represents the origin. When there are 2 atoms per primitive basis unit, like in MgO, the vibrational motions become more complicated. N atoms in the primitive cell produces 3N branches in the dispersion relation: 3 acoustic branches and 3N-3 optical branches[5]. Generally, an acoustic mode is defined as one that has a linear dispersion as k→0 and it is a long-wavelength, low-energy branch of excitations[8]. The 2 differing atoms move in phase[4]. Whereas an optical mode is characterised by being a higher energy branch of excitations with zero group velocity at k=0 (group velocity is the gradient of the ω(k) dispersion curve)[8]. The 2 differing atoms move out of phase and represent the motion that would be caused by a sinusoidal electromagnetic wave, hence the name optical, since the atoms/ions are oppositely charged[4].
For MgO, with 2 atoms in the primitive cell, there are 6 branches[5]. One longitudinal acoustic, one longitudinal optical, two transverse acoustic and two transverse optical[5]. These are slightly hard to tell from figure 1 because some of the branches merge together. Figure 2 shows the DOS for the sampling of a single k point, L, in a 1x1x1 grid. Figures 1-3 all confirm that it is the k point, L. In order to sample more k points and so include more phonons in the DOS so it characterises the vibrational behaviour of the material more accurately, the grid size must be increased.
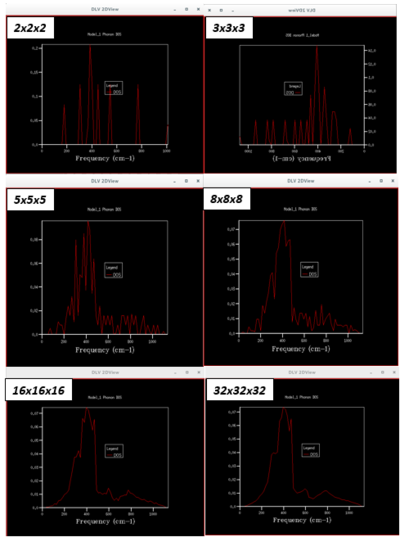
Figure 4 highlights the effect of increasing the grid size or sampling of k-points on the DOS. As the grid size increases and more phonons are included in the DOS, it becomes a smoother continuum that more accurately characterises the phonons present in MgO. A grid size of 32x32x32 was deemed optimal because 64x64x64 was not significantly different and calculations were faster with the smaller 32x32x32 grid size.
In order to quantitatively confirm the 32x32x32 optimal grid size conclusion, the convergence of the Helmholtz Free Energy (A) with increasing shrinking factor was measured.
From figure 5 it is clear that the most dramatic change in free energy is on going from grid size 1x1x1 to 2x2x2. Figure 5 also clearly indicates the convergence of A, with a minimal difference of 0.000001 eV between sizes 16x16x16 and 32x32x32. Therefore, this free energy convergence supports the use of 32x32x32 as the optimal grid size. On analysis of the data in figure 5, the 8x8x8 grid can be used for energy determination accurate to 1 meV. The 16x16x16 grid can be used for accuracy to 0.5 meV and 0.1.
With regards to the suitability of the 32x32x32 optimal grid for calculations on other crystal structures, the relative sizes of real space a and reciprocal space a* should be considered.
For similar simple ionic crystals, such as CaO, a = 4.7-4.8 Å[11]. For MgO a ~ 3 Å. Therefore 32x32x32 should be suitable, if slightly large since the a* of MgO is 1.6x larger than that of CaO, so the shrinking factor must be 1.6x smaller. A grid size of 20x20x20 may be sufficient. For large structures such as Faujasite, a zeolite, a = 24.2-25.1 Å[12]. The lattice constant of the zeolite is ~8x larger and so a shrinking factor 8x smaller with a corresponding smaller grid size would be appropriate for accurate sampling of the k-points. Metals also require a smaller shrinking factor/grid size but for an alternative reason. The gradient of the vibrational band in phonon dispersion is indicative of the repulsion between the vibrating atoms. In a metal all the metal cations are vibrating but they are shielded from each other by the sea of delocalised electrons surrounding them. As a result, metals have a small vibrational dispersion; completely opposite to their electronic dispersion; and the flatness of the dispersion means that less sampling is required. Therefore smaller shrinking factor and smaller grid. Whereas, in an ionic crystal the spherically symmetrically like charged ions can repel each other, leading to a large vibrational dispersion without shielding electrons, but these have a flat electronic dispersion with a large electronic band gap and so are good electrical insulators.
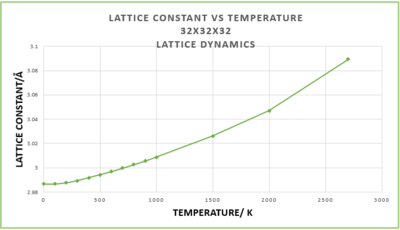
Figures 6 and 7 depict how the lattice constant and free energy respectively, vary with temperature. Both deviate from linearity below ~300 K and above 2000 K. At high temperatures the atoms are no longer vibrating about their equilibrium positions with a small amplitude; there is sufficient thermal energy for high amplitude vibrations and eventually bond breaking and melting to occur. However, within the LD QHA, the atoms behave as simple harmonic oscillators and so the bonds never break. The magnitude of the free energy increases (becomes more negative) because the -TS term increases in magnitude as the temperature increases.
Molecular Dynamics (MD)
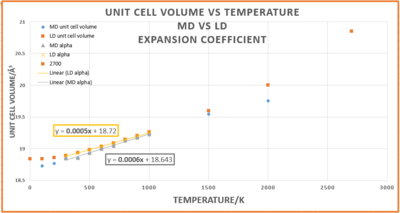
Figure 8 indicates that both LD and MD simulations generally follow a linear trend of increasing unit cell volume directly proportional to increasing temperature. However, the orange LD line deviates from linearity below 300 K and above 2000 K. A volume measurement at 3000 K was attempted using LD, but failed because 3000 K is approaching the anharmonic limit[9] and the melting point of MgO, 3250 K[10]. Even though the QHA allows the lattice constant to change on expansion of the lattice, it still utilises the parabolic harmonic approximation, as diagram 1 highlights. Therefore the bonds cannot break and so the model breaks down as the melting point is approached. It was not possible to measure an MD volume value for 0 K since, as a classical technique, MD ignores the zero point energy. Past 2000 K the gradient of LD orange line increases because the volume tends to infinity as the forbidden bond breaking at the melting point is approached.
Thermal Expansion Coefficients
The thermal expansion coefficients using the LD and MD methodologies in the linear 300-1000 K temperature range were found to be:
- LD using the QHA α = 2.68 x 10⁻⁵ K-1 (2 d.p)
- Using MD α = 3.21 x 10⁻⁵ K-1 (2 d.p)
- Literature value for this temperature range: α = 1.334x10⁻⁵K-1 [13]
The coefficients obtained from both LD and MD are of the same order of magnitude as the literature value.
Conclusion
The thermal expansion of the FCC ionic crystal, MgO, was studied using two computational, simulation methods. The first; lattice dynamics and the quasi-harmonic approximation; uses the rhombohedral primitive cell of MgO. It is a quantum mechanical method in the sense that the vibrational energy of the phonons is quantised and so, obeying the Heisenberg Uncertainty Principle, there is a zero point energy. However, in order to study thermal expansion, changing lattice parameters must be imposed upon this method to account for the expansion of the lattice; whilst still maintaining the harmonic approximation. The second; molecular dynamics; is a classical method that employs Newton's Second Law of motion and the conventional, cubic unit cell of MgO. A 'supercell' of 32 MgO units was used. Both methods yielded thermal expansion coefficients that were in good agreement with the literature value (same order of magnitude). Lattice dynamics gave a value of 2.68 x 10⁻⁵ K-1 (2 d.p) and Molecular Dynamics gave a value of 3.21 x 10⁻⁵ K-1 (2 d.p). The agreement with the literature suggests that both the 32x32x32 optimal grid used for lattice dynamics and the 32 MgO unit supercell used in molecular dynamics were reasonably accurate. A larger supercell, containing 64 MgO units, could be used to further improve the accuracy and increase the vibrations sampled since the 32 unit supercell did not take too long to run. Lattice Dynamics and the Quasi-Harmonic Approximation is favoured for low temperatures small amplitude vibrations occur. Molecular Dynamics is not suited to very low temperatures because long simulation times may be required, especially if ergodicity is broken, and it does not account for the zero point vibrational energy. Molecular Dynamics is favoured at high temperatures approaching the melting point because it allows bonds to break; whereas lattice dynamics does permit bond breaking.
References
- ↑ A. Einstein. The motion of elements suspended in static liquids as claimed in the molecular kinetic theory of heat. Annalen der Physik, 17, 549–560 (1905).
- ↑ A. Einstein. A new determination of the molecular dimensions. Annalen der Physik, 19, 289–306 (1906)
- ↑ A. Einstein. The Planck theory of radiation and the theory of specific heat. Annalen der Physik, 22, 180–190 (1907).
- ↑ 4.0 4.1 4.2 4.3 4.4 4.5 4.6 4.7 Dove M, Introduction to the theory of lattice dynamics, École thématique de la Société Française de la Neutronique, 2011, 12, 123-159
- ↑ 5.00 5.01 5.02 5.03 5.04 5.05 5.06 5.07 5.08 5.09 5.10 5.11 5.12 5.13 5.14 C. Kittel, Introduction to Solid State Physics, 2005, Wiley, 8th Edition
- ↑ 6.0 6.1 6.2 A. P. Sutton, Electronic Structure of Materials, 1993, Oxford Science Publications
- ↑ Z. Chen et al. / Physica B 404 (2009) 4211–4215
- ↑ 8.0 8.1 8.2 8.3 S. Simon, The Oxford Solid State Basics, 2013, Oxford University Press
- ↑ 9.00 9.01 9.02 9.03 9.04 9.05 9.06 9.07 9.08 9.09 9.10 J.R. Hook, H.E. Hall, Solid State Physics, 1991, Wiley, 2nd Edition
- ↑ 10.0 10.1 C. Ronchi and Mikhail Sheindlin, Journal of Applied Physics, 2001, 90.
- ↑ E. Albuquerque and M. Vasconcelos, Journal of Physics: Conference Series, 2008, 100, 42006
- ↑ J. A. Kaduk and J. Faber, The Rigaku Journal, 1995, 12, 14-34.
- ↑ A. S. Madhusudhan Rad and K. Narender, Journal of Thermodynamics, 2014, 4.
