Rep:FordpageVib
Determination of the thermal expansion coefficient of MgO through contrasting computative modelling methods
Abstract
The thermal expansion coefficients for MgO have been investigated using a classical harmonic model, and comparison made to a molecular dynamics simulation. In this report some of the benefits and limitations of each of these models are discussed, and the results produced by both models have been compared against experimental data. Unfortunately, poor correlation is found, with results from the classical harmonic and molecular dynamics treatments of 2.06 x10⁻⁵ K-1 and 3.06 x10⁻⁵ K-1 respectively at 300 K in comparison to an experimental value of 3.13 x10⁻⁵ K-1.[7] At low T, molecular dynamics is found to overestimate the thermal expansion coefficient while the classical harmonic treatment underestimates it, but at high temperature both models predict coefficients lower than those observed in reality. Due to their formulation, the quasi harmonic approximation method can be expected to give better results at low temperatures, whereas the molecular dynamics approach should resemble reality more strongly as temperature increases.
Introduction
The volumetric thermal expansion coefficient is an intrinsic quality of a material, defined as the rate by which the volume of a material changes with temperature.[1] The expression for the thermal expansion coefficient is given below:
Thermal expansion of materials in general is a vital property in engineering wherever a structure must remain stable under a range of temperatures[1]; MgO may be used to coat the interior of a furnace due to its extremely high melting point, and this is a prime example of a location where a very great range of temperature will be experienced. Knowledge of the thermal expansion coefficient can help engineers design in such a way that cracks do not form in the coating. Magnesium and oxygen are also the two most abundant elements in the Earth's mantle, so knowledge of how MgO behaves under very high temperatures and pressures has been proposed as useful to our understanding of Earth's interior[2]. Experimentally, investigating the thermal expansion of a crystalline material such as MgO presents several problems: reaching high temperatures with stability is neither quick nor simple, and the defects present in any real crystal will lead to deviation from that of a "perfect" crystal structure.[3] Instead, simulation techniques can be used to model these systems, which offer a much easier and more accessible option to calculate properties, even at high temperatures. Two of these shall be contrasted here, and compared to literature data.
The first of these is a classical harmonic approach based around the quasi-harmonic approximation.[4] The quasi-harmonic approximation uses the fact that we may calculate a large number of the vibrations, or phonons, present within a lattice of MgO at a given temperature, and is best described through an explanation of the harmonic approximation first. Each vibration in the MgO lattice has a characteristic energy and hence the free energy may be obtained from population of these states according to the boltzmann distribution. To calculate these states we sample a range of possible vibrations through the use of k-space. K-space refers to the reciprocal of real space: this is a space with dimensions of momentum rather than position, so is more useful than for representing waves, which are defined using a wavevector in reciprocal space. Analogous to real space, k-space has an infinite periodic lattice, defined by the structure of the real lattice, and a zone can be defined so as all points within the zone are closer to a single lattice point than any other. This is known as the Brillouin zone, and has a size inversely related to the real space lattice parameter, stretching in a simple 1D case from .This may be understood by consideration of the 1D dispersion relation, which relates the wavevector k to its corresponding frequency ω. Each point on the infinite lattice corresponds to one inside the Brillouin zone, a feature mathematically expressed as:
Where K represents the force constant between the two atoms, m the mass and a the lattice parameter. The physical translation of this is that in the centre of the Brillouin zone all cells in the real structure move perfectly in phase with each other; at each end neighbouring cells are in perfect antiphase and in intermediate points k describes the phase shift between adjacent cells. This generalises to the 3D case, k now describing the phase shift in 3D, although the shape of the Brilloun zone becomes more complicated: for the FCC lattice the Brillouin zone is a truncated octahedron. To save time and to simplify processing, the symmetry of the zone may reduce the required sample region even further.[4]
The first stage of the specific calculation here involves a large number of wavevectors being selected for sampling, and their corresponding frequencies may be calculated via the 3D dispersion relation for a diatomic lattice:
Which now takes the various values of k as a wavevector, having components kx ky and kz and the masses of both atoms present in the unit cell as M1 and M2. For the purpose of understanding the distribution, these frequencies can be sampled in two ways. In a phonon dispersion curve a path is followed through critical points within the Brillouin zone, and by sampling many wavevectors along that path an image is built up of how the frequency, and therefore energy, of the phonons changes with k. The other option is a density of states plot, or DOS, where a large number of points in the Brillouin zone are sampled, and a histogram of the frequencies produced. This can be used to calculate the free energy of the crystal via population of these states, in accordance with Bose-Einstein statistics as given below, which calculates the probability n of finding phonons in the state with frequency ω:
Assuming that the dispersion curve produced covers a large amount of the Brillouin zone, it is sufficient to form the density of states plot for a material through sampling the dispersion curve at many k values and forming the density of states plot using only the values plotted on the curve rather than sampling from k space directly.[4]
However, in our investigation, a slight adaptation on this is required. In the harmonic approximation, as described above, the equilibrium positions, and hence lattice parameters and volume of the unit cell, are independent of temperature. This is true for small vibrations, but does not explain thermal expansion. To investigate this, the Quasi-harmonic approximation is used, in which this is taken into account.[5] The Helmholtz free energy in the quasi harmonic approximation is:
With components of U, the internal energy, Ezp, the zero point energy, and S, the entropy. All three terms are dependent on the volume, V, of the unit cell, and the entropy is also dependent on T. The zero point energy and entropy are both calculated via summation over all N terms of K and i; that is the wavevector and specific band respectively.
Finally, the Gibbs free energy may be minimised by variation of the volume in the relation below. Since the temperature and volume are now known, the thermal expansion coefficient may be calculated.
It is very important in all cases for the sampling of kx ky and kz to be sufficiently dense so as to build up a representative picture of the system energies. This is achieved through variance of the "shrinking factor" to a suitable value. The shrinking factor simply defines the number of slices the Brillouin zone is cut into for the purpose of sampling.[5]
In the second part of the investigation, a molecular mechanical method is used to model the system. In this model, an initial system is defined, and then allowed to evolve under a forcefield for a short time, here a Buckingham potential[6], with initial atomic velocities defined by the temperature specified for the system:
Where the Van de Waals energy Φ between the two atoms 1 and 2 is described as a function of r, their interatomic distance. The parameters A, B and C are empirically measured and fitted for the system under investigation. These are widely available from other studies. The forces on the atoms present are calculated, and the velocities altered in accordance with a=F/m. The system then evolves over a short time and the procedure repeated until a steady state is reached in which the properties of the system are constant. At this point, the system is allowed to evolve with properties being collected for a certain number of iterations, and the properties averaged to give an impression of the observable properties. In this simulation, the size of the supercell chosen to simulate the system is important: as all duplicates of the supercell within the crystal are approximated to undergo identical behavior, the larger the cell the closer the situation becomes to reality. In the extreme case, the supercell would encompass the entire crystal under observation, although this is completely impractical due to the extreme processing power required. In this simulation, a 2x2x2 supercell containing 8 conventional MgO cells was used, or 32 atoms of each element overall.
Computational techniques
All modelling was done within the DLV visualisation package, utilising the GULP simulation program to calculate properties. In order to minimise processing time, a simple ionic model was selected over a more complicated ionic shell model. An initial model of an FCC MgO lattice with an Mg-O bond distance of 2.106 Å was built, and used as a starting point in all simulations. Single point energy calculations were used at first to optimise the program to minimise processing time, and the shrinking factor of 20 was found to give well converged energies. A number of simulations were run to investigate the DOS and phonon dispersion curves, the latter using an "Npoints" value, the number of points sampled between each critical point, of 50. 21 simulations were then run under the quasi harmonic approximation at different temperatures between 0 K and 2000 K, at intervals of 100 K, again using a shrinking factor of 20. The pressure was held constant at 0. The lattice parameter and gibbs free energy of each optimisation was collected. Finally, when running the molecular dynamics calculations, a supercell of 2x2x2 MgO conventional unit cells, 64 atoms in total, was allowed to equilibrate under a Buckingham potential in an NPT ensemble for 500 fs at time intervals of 1 fs. Data collection steps occurred over another 500 fs. 20 calculations were carried out between 100 K and 2000 K, again at steps of 100 K and lattice parameters were collected for each.
Results
The first part of my investigation involved optimising the value of the shrinking factor (referred to as j here) so as to minimise processing time without sacrificing accuracy. To this end a preliminary study was carried out within the harmonic approximation to find the point at which lattice energy stablised. This was done by increasing the value of j for a 3 dimensional (j x j x j) lattice until the Helmholtz free energy stablised, and the results of this investigation are presented below, demonstrating first stablisation at j=18. This corresponds to 3078 wavevectors sampled, when the symmetry of the system is accounted for. In all future simulations the value j=20, corresponding to 4200 wavevectors, is used in order for my answers to fall safely within the stable energy zone while maximising efficiency.
| j value | Helmholtz free energy/ev | j value | Helmholtz free energy/ev | j value | Helmholtz free energy/ev |
|---|---|---|---|---|---|
| 1 | -40.930301 | 8 | -40.926478 | 15 | -40.926482 |
| 2 | -40.926609 | 9 | -40.926479 | 16 | -40.926482 |
| 3 | -40.926432 | 10 | -40.926480 | 17 | -40.926482 |
| 4 | -40.926450 | 11 | -40.926481 | 18 | -40.926483 |
| 5 | -40.926463 | 12 | -40.926481 | 19 | -40.926483 |
| 6 | -40.926471 | 13 | -40.926482 | 20 | -40.926483 |
| 7 | -40.926475 | 14 | -40.926482 | 30 | -40.926483 |
Interestingly, convergence occurs very rapidly, at j=2 (and thus sampling 8 k values) the calculated energy is already within 0.126 mev of the true value, and at j=3 (27 k points), the value is only 0.051 mev away. MgO possesses a diatomic unit cell, and thus 6 bands can be seen in the dispersion curve, so each k point gathers information from 6 different bands. However, in a different system the number of k points to achieve convergence may be different: in a pure FCC metal the primitive unit cell will only contain a single atom and be about half the size, so it can be expected that the width of the Brillouin zone will be doubled. In this case, twice the number of points would need to be sampled to maintain the same sampling density, so convergence may be expected around j=23, this corresponding to twice the sample size. In a zeolite, which may contain approximately 32 atoms per unit cell, energy convergence will be reached much more quickly with a smaller shrinking factor.
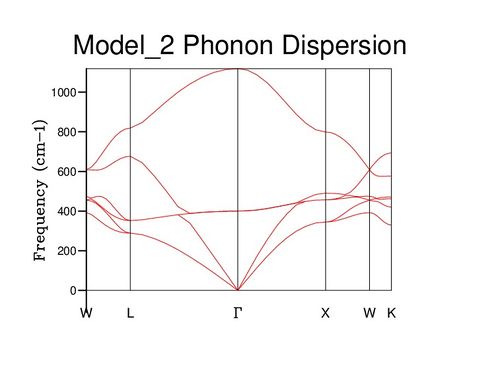
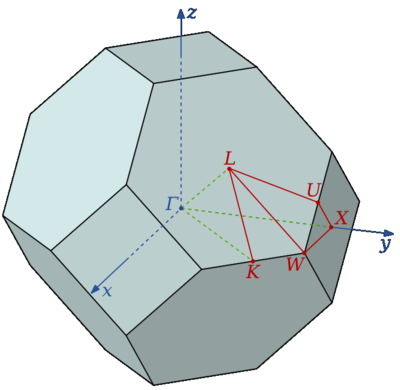
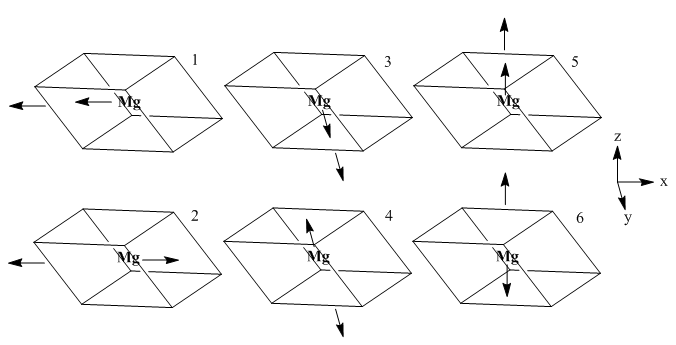
Also of interest is the dispersion curve of phonon energies. This is built by following a path through critical points of symmetry through the Brillouin zone (see diagram below) The various bands present are caused by the degrees of freedom of the system: there are 6 modes of motion available to each primitive cell. For each dimension, each of Mg and O may vibrate in phase or antiphase, and in a physical sense each phonon represents a propagation of each of these motions throughout the entire crystal structure, with various phase shifts in different directions. In general, there are 3N bands in a dispersion curve, where N equals atoms within the cell being considered. Certain points on the dispersion curve can be understood through this approach, such as the gamma point of zero momentum. At this point, all cells vibrate in perfect unison, and since three basic motions (1,3 and 5) involve only translational motion should be expected to correspond to a vibrational frequency of zero, exactly as observed. The symmetric vibrations 2 and 4 correspond to the central band, degenerate at gamma, while the highest frequency band corresponds to vibration 6, which if repeated in phase is the highest frequency possible.
|
|
|
|---|
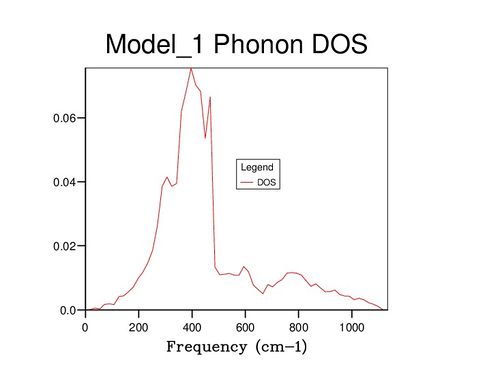
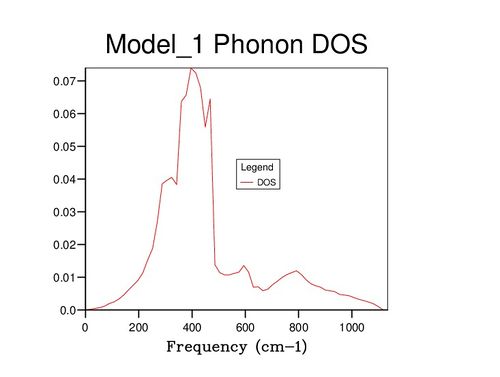
Further insight can be gained by examining the density of states (DOS) of the system at varying values of j; images of some of these are displayed below. At j=1, only a single wavevector has been sampled, and thus the DOS is very poor as only 6 frequency values have been included: one for each band. If compared to the dispersion curve shown above, it can be seen that the k point sampled corresponds to the point L. Beyond j=18, the DOS changes very little even with significant j increase, suggesting that the 18x18x18 block of k values contains sufficient phonons to be representative of the infinite crystal lattice.
| K | 1 | 18 | 30 |
|---|---|---|---|
| DOS plot | 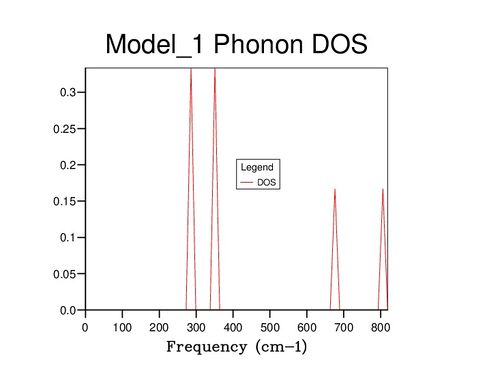
|
|
|
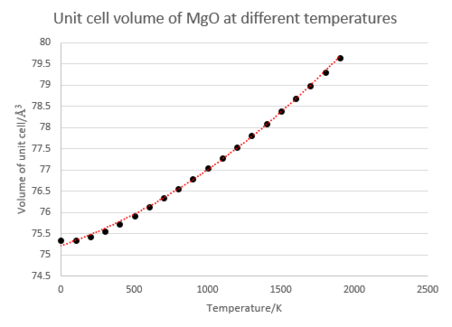
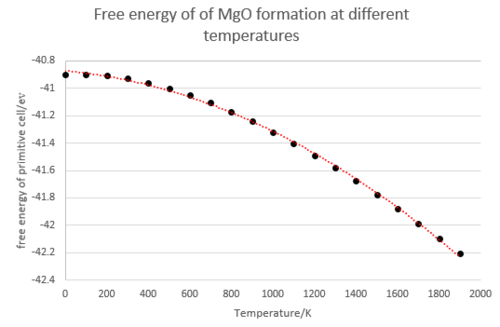
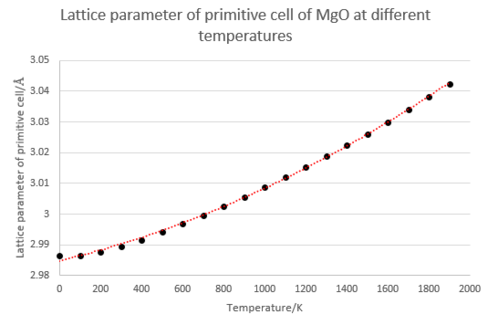
The next part of the investigation involved the calculation of the thermal expansion coefficient of MgO. This value is temperature dependent, so in order to calculate this a 2nd order polynomial curve was fitted to the data and differentiated to give the gradient, . After normalisation this gives the volumetric thermal expansion coefficient at that point. The results of this are presented below, alongside graphs depicting various other quantities extracted from the simulation. (R2 value of temperature/volume curve= 0.999)
| T | T | T | |||
|---|---|---|---|---|---|
| 0 | 1.57 | 700 | 2.71 | 1400 | 3.85 |
| 100 | 1.73 | 800 | 2.87 | 1500 | 4.02 |
| 200 | 1.89 | 900 | 3.04 | 1600 | 4.18 |
| 300 | 2.06 | 1000 | 3.20 | 1700 | 4.34 |
| 400 | 2.22 | 1100 | 3.36 | 1800 | 4.51 |
| 500 | 2.38 | 1200 | 3.53 | 1900 | 4.67 |
| 600 | 2.55 | 1300 | 3.69 | 2000 | 4.83 |
These results may be compared with experimental values for the volume expansion coefficient of 3.13 x10⁻⁵ K-1 at 300K, and 4.64 x10⁻⁵ K-1 at 1200K[7], which reveals that the coefficients predicted by the simulation method are too low. The striking feature is the presence of a curve in each graph, demonstrating the temperature dependent nature of the heat capacity and thermal expansion coefficient. The reason for this is clear: at small T values only low energy phonons may be excited, and so we need only consider small k values and can ignore any bands on the dispersion relation with a non-zero lower bound. It can be shown using the equations given in the introduction that this condition leads to a T4 dependence for the internal energy ΔU, and thus a curved relationship is seen at low T. At high T this tends toward linearity as the system approaches the classical limit and equipartion becomes valid. Several approximations are made in this calculation, which account somewhat from deviations from that observed from experiment. The primary approximation made is that at each value of a, the lattice constant, the harmonic approximation is valid: i.e for a given temperature the frequencies of the various wavevectors are independent of the lattice parameter and move purely under a harmonic potential. The value of a that gives the most negative free energy is thus the correct one. In turn, the harmonic approximation makes two major assumptions: that only directly adjacent cells need be considered when calculating energies, and that all oscillations can be described as occurring within a harmonic potential. The first is valid given that the the surrounding ions screen the charge of any considered atom from view of the rest of the crystal structure, and results in an initial set of quadratic equations of motion that are mathematically simple to solve. The second is only valid so long as the oscillations are small in amplitude, and so becomes less acceptable at high T values.
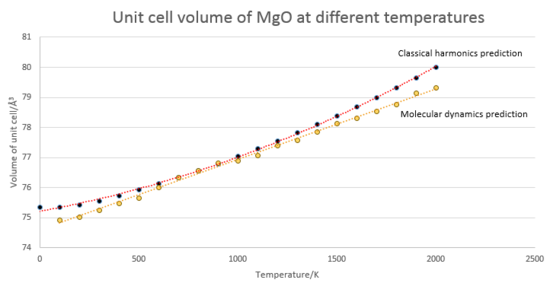
A comparison of the quasi-harmonic approach and a molecular dynamics approach is presented below.
(R2 value = 0.999 for quasi harmonic prediction, R2 value = 0.997 for molecular mechanics)
The molecular dynamics prediction results in a constant value for the thermal expansion coefficient of 3.06 x10⁻⁵ K-1, reasonably similar to that predicted by the quasi harmonic approximation, especially at mid temperatures. The linear trend observed can be explained via consideration of how the two simulations calculate their energies. The curved shape of the classical harmonic prediction has been discussed previously, but here quantum effects are discarded: the system at T=0 is allowed to become fully stationary, and so there is no low temperature curvature observed. Also of note, in the absence of zero point energy the minimum predicted volume is smaller for the molecular dynamics method than in the quasi harmonic approach. In essence, the major difference between the two methods lies in the assumption of harmonicity in the vibrations of the lattice structure. For small amplitude vibrations, such as those occurring at low temperatures, this is a valid assumption so the quasi-harmonic approximation is the better model for the system, accounting for quantum effects such as the zero point energy. However, as temperature increases this assumption loses validity as anharmonicity increases and the molecular dynamics model becomes more useful despite its neglect of any quantum phenomena. Furthermore, unlike the harmonic approach, molecular dynamics is capable of prediction of melting and boiling points of a material, these manifesting as breakdown in linearity at their respective temperatures. In the classical harmonic approach the simulation will instead attempt to model an unphysically high energy solid, giving values for the density that are wildly too low, as the system is not allowed to melt into a state of disorder.
Conclusion
In this report, an investigation into the use of two contrasting methods of studying the thermodynamic properties of crystals was carried out. For MgO under the harmonic approxoimation used as specified, a sample space of approximately 3000 k points over an 18x18x18 grid was found to give convergent energy values and a precise DOS plot, against a comparison carried out using a significantly denser sample. An examination of the mathematics of the methods reveals that phonon analysis is a more reliable method at low temperatures, whereas at high temperatures it is likely that molecular dynamics will provide a more reliable result. It was found that for the MgO FCC lattice a phonon analysis under the quasi-harmonic approximation and a molecular dynamic approach yielded reasonably similar results for the thermal expansion coefficient, predicted as 2.06 x10⁻⁵ K-1 and 3.06 x10⁻⁵ K-1 at 300 K respectively. Experimental values were found to be higher than those predicted for most temperatures, suggesting the methods used were not sufficient to accurately describe the behavior of the crystal, and further refinement is required to obtain a useful model. One way to acquire more accurate results in the phonopn analysis model may be through a higher order approximation. By breaking one of the assumptions described in this report, such as considering atoms beyond nearest neighbours in potential calculations, a more realistic model might be built, but this would greatly increase computational time and complexity. In the molecular dynamic model, an increased sample size in the simulation would give a greater resemblance to reality, but is subject to the same drawbacks.
References
[1] Tipler, Paul A.; Mosca, Gene (2008). Physics for Scientists and Engineers - Volume 1 Mechanics/Oscillations and Waves/Thermodynamics. New York, NY: Worth Publishers. pp. 666–670.
[2] Chopelas, A. Phys Chem Minerals (1990) "Thermal expansion, heat capacity, and entropy of MgO at mantle pressures" 17: 142.
[3] J D James et al (2001) "A review of measurement techniques for the thermal expansion coefficient of metals and alloys at elevated temperatures" Meas. Sci. Technol. 12 R1
[4] Misra, Prasanta Kumar (2010). "Normal modes of a one-dimensional chain with a basis". Physics of Condensed Matter. Academic Press. p. 44.
[5] Dove, Martin T. (1993). Introduction to lattice dynamics, Cambridge university press.
[6] Buckingham, R. A. (1938). "The Classical Equation of State of Gaseous Helium, Neon and Argon". Proceedings of the Royal Society A: Mathematical and Physical Sciences. 168 (933): 264–283.
[7] A. S. Madhusudhan Rao and K. Narender, (2014) “Studies on Thermophysical Properties of CaO and MgO by -Ray Attenuation,” Journal of Thermodynamics, vol. 2014, Article ID 123478, 8 pages,

