Rep:FR comp 1
Calculating the thermal energy and lattice constant of MgO
Abstract
This lab investigates the Helmholtz free energy and lattice properties of MgO at varying temperatures via computational methods. The programme DLVisualise will be used, specifically the GULP software. Two different methods, Quasi Harmonics and Molecular Thermodynamics, will be used to calculated the lattice properties and both the benefits and draw backs of each will be discussed.
Introduction
The crystal structure in MgO is repetitive. This means we can use a Fourier transform of real space to produce a periodic function in the reciprocal space[1]. If we consider our crystal lattice to be infinite, since the number of wavefunctions are equal to the number of AO's, there must be infinite wavefunctions. These wavefunctions can be defined using a Bloch function, of the form ψk=ΣneinakXn, where k is essentially an orbital coefficient and a is the lattice parameter.The function is periodic between -π/a≤k<π/a in the real space, where k=π/a represents an entirely antibonding structure and k=0 is bonding. This space is known as the Brillouen zone. A graph of E(k) vs k produces the band structure, showing the vibrational energy levels.
Method
Initially, the internal energy of MgO was calculated, using a Buckingham potential approximation. All covalent character between the atoms were discarded. The ions were considered to be spherical charges, with the magnesium and oxygen ions assigned a charge of +2 and -2, respectively. The internal energy is defined as the energy required to increase the internuclear distance to infinity, or the point where internuclear forces have tended to zero.
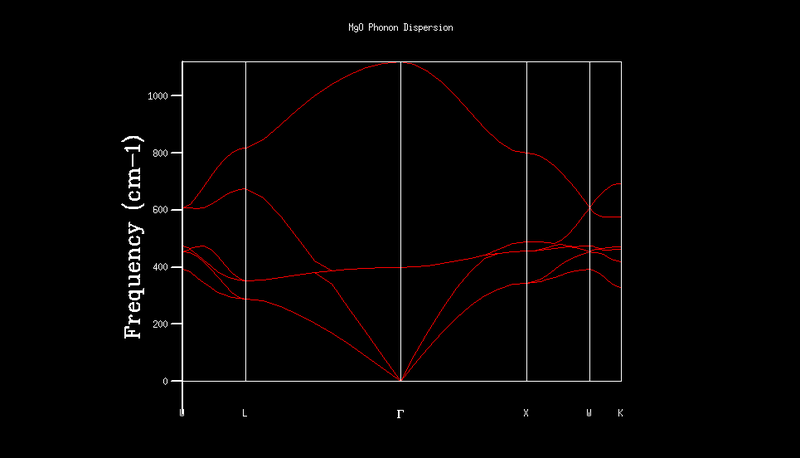
The phonon dispersion were then calculated using the same approximations. 50 points were observed along the W-L-GAMMA-W-X-K path within the k space, recording the quantum vibrational energies at each point.
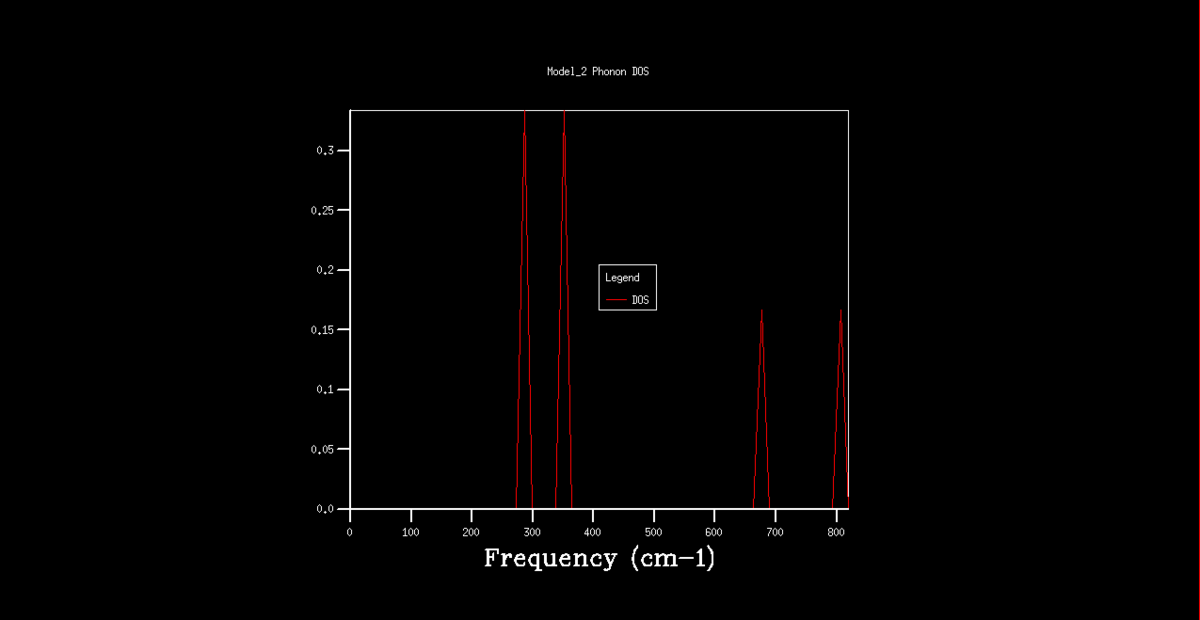
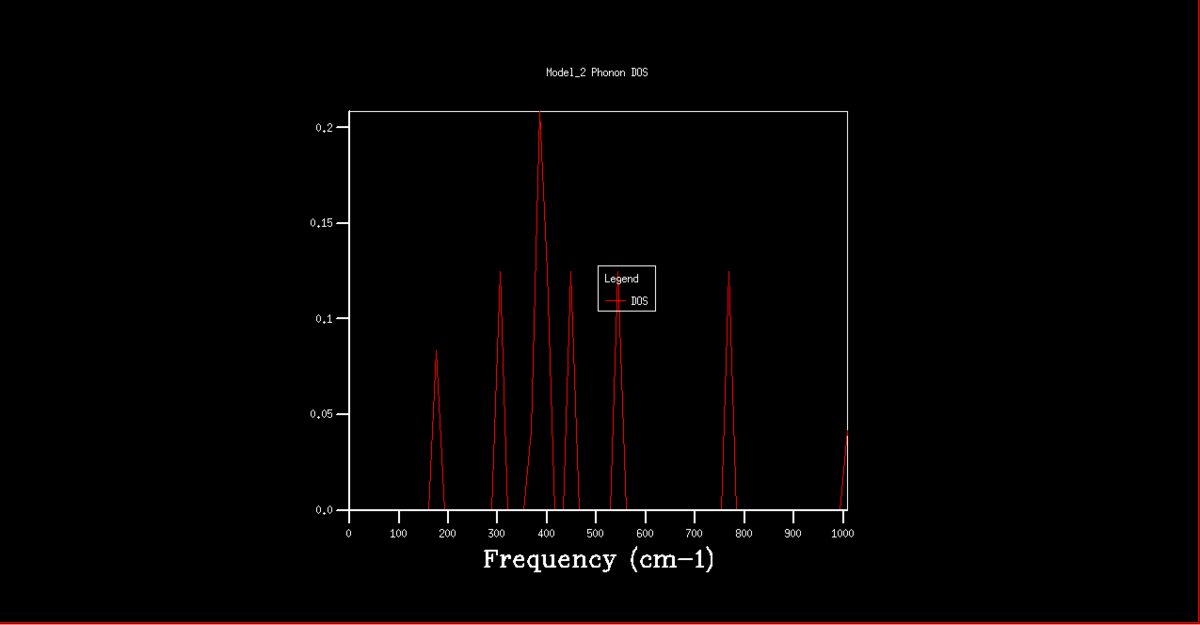
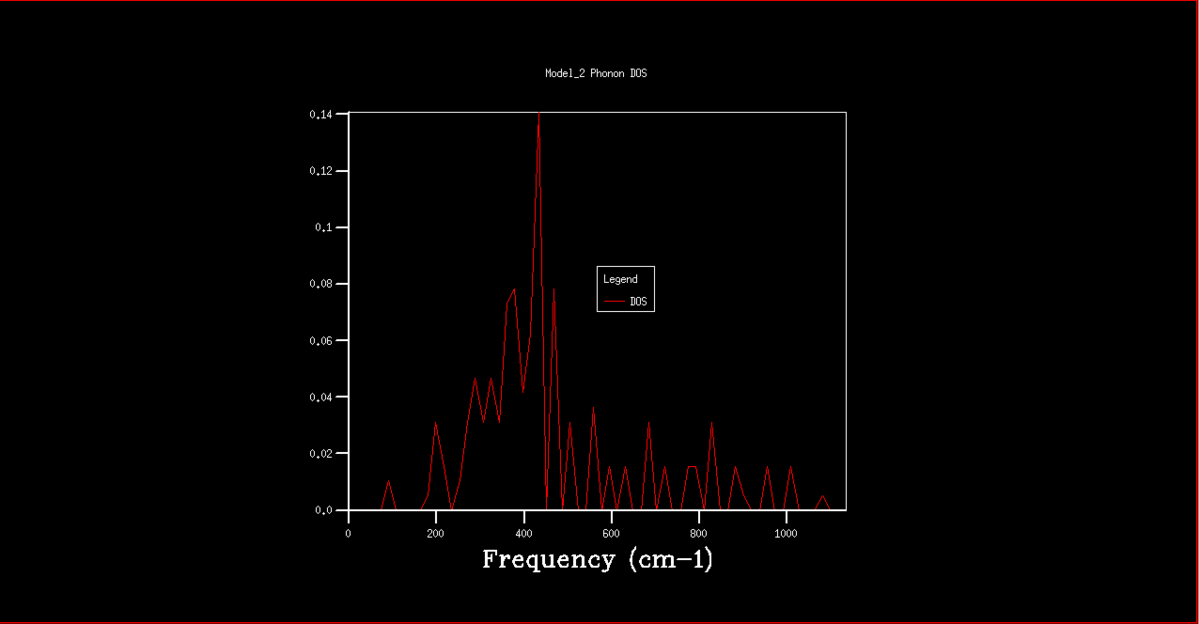
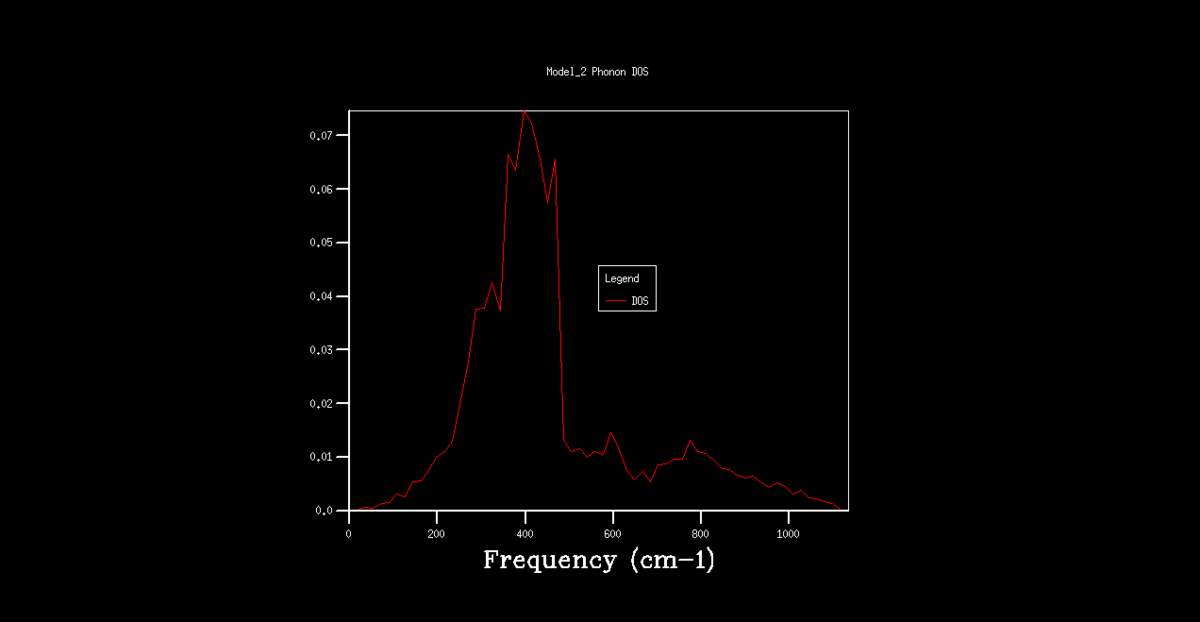
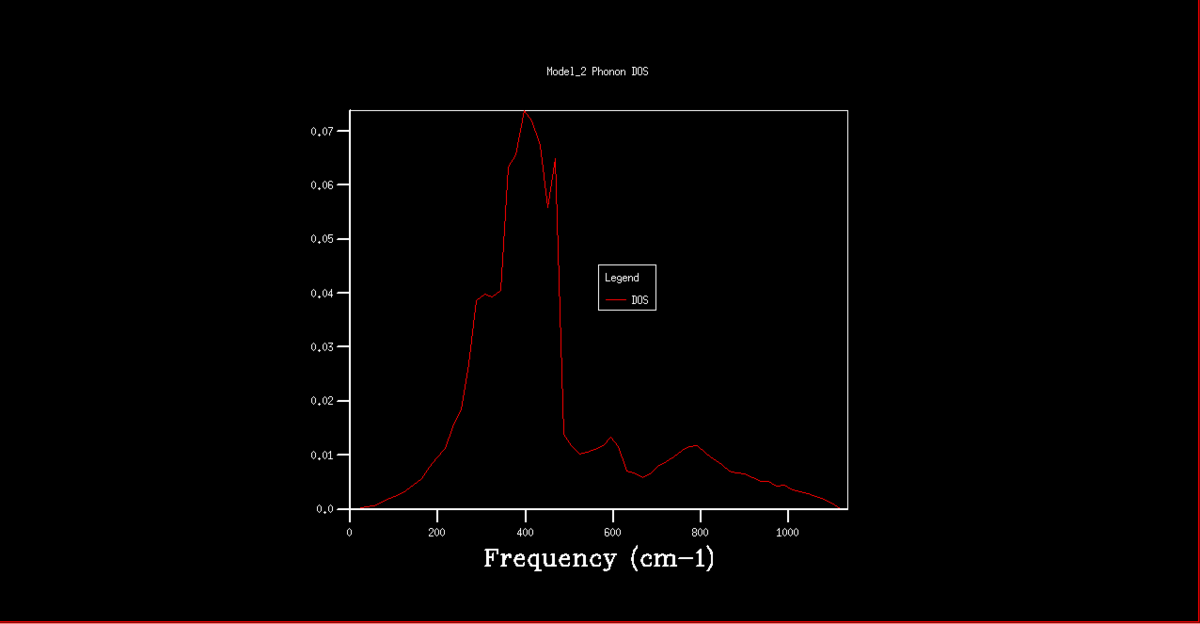
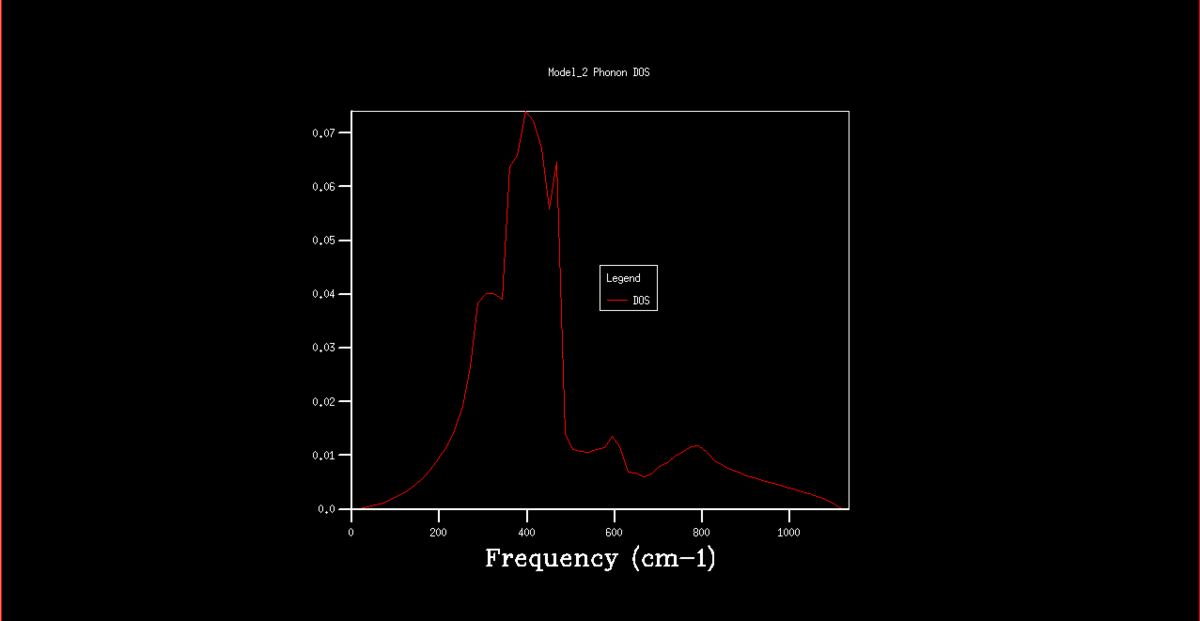
Next, the density of states graph was plotted. Initially, this was done on a 1x1x1 k grid. However, this was too much of an approximation as it gave energies which no states had, rather than a continuum. The number of points on the grid was then varied, computing the DOS for 2x2x2, 4x4x4, 8x8x8, 16x16x16 and 32x32x32 k grids.
The free energy of the crystal was then computed. Using the Quasi-Harmonic approximation, the free energy was computed as the sum over the vibrational modes of an infinity larger crystal. The k grid was once again varied, to find what size grid would provide a value of a reasonable accuracy. The same grids were tested as in the density of states computations, at a temperature 300k. It was established that a k grid of 16x16x16 was sufficient to deliver an accuracy to 0.1 meV. The free energy was then calculated for all temperatures between 100K and 1000K, in 100K intervals. The lattice constant was also calculated using this method between 0K and 1000K.
The lattice constant was also calculated using the molecular dynamics technique. Within this technique, the forces being exerted on each individual atom is computed using Newton's second law and then the process is repeated until the lattice parameters are optimised and their values converge. The time interval used was 10-15s.
Each step involves:
- Computing the force on the atom (F)
- Compute the acceleration (a=F/m)
- Calculate the new velocity (Vnew = Vold + a dt)
- Calculate the new atom positions (Rnew = Rold + Vnew dt)
This was repeated until the result converges.
Results and Discussion
The phonon dispersion graph is shown in figure 1, plotting vibrational frequency vs k. There are 6 branches in the diagram, representing the number of AOs. The diagram features both optical and acoustic bands, representing vibrational energies in the crystal. Optical vibrations occur when the neighbouring atoms vibrate out of phase and are excited in the microwave region of the electromagnetic spectrum. These phonons are non zero at gamma, (0,0,0). Acoustic phonons involve neighbouring atoms vibrating in phase. These vibrations can be transverse or longitudinal. If all atoms are vibrating in phase these represents a translation, which has zero energy.
The DOS graphs are also shown in figures 2-8. As the k grid gets larger, and more points are taken, the curve gets progressively smooth, representing the continuum of states shown in the dispersion graph. In the 1x1x1 grid, only one point was taken. By analysis of this DOS graph and the dispersion graph, it can be deduced that this point is in fact point L, as the frequencies match and the two lower frequency represent degenerate vibrational states, thus being double the density.
Figure 2. Phonon DOS graph for a 1x1x1 k grid.
|
Figure 3. Phonon DOS graph for a 2x2x2 k grid.
|
Figure 4. Phonon DOS graph for a 4x4x4 k grid.
|
Figure 5. Phonon DOS graph for a 8x8x8 k grid.
|
Figure 6. Phonon DOS graph for a 16x16x16 k grid.
|
Figure 7. Phonon DOS graph for a 32x32x32 k grid.
|
Figure 8. Phonon DOS graph for a 64x64x64 k grid.
| |
| k-grid | Helmholtz free energy (eV) |
|---|---|
| 1×1×1 | -40.930301 |
| 2×2×2 | -40.926609 |
| 4×4x4 | -40.926450 |
| 8×8×8 | -40.926478 |
| 16×16×16 | -40.926482 |
| 32×32×32 | -40.926483 |
Table 1 shows the computed Helmholtz Free energy using the quasi-harmonic approximation at 300K for the different sized k grids. Ideally, an infinite grid would be used, but this would require infinite computations. As the grid sized was increased, the computed free energy became more negative and converged towards a value. The table demonstrates the difference between 16x16x16 and 32x32x32 grids was only 4 x10 -6eV, and therefore a 16x16x16 grid was used in further computations as a compromise between high accuracy and computational time. This would be applicable to other similar sized crystals, i.e. with a similar lattice constant, a. Since the reciprocal space lattice parameter is a*=2π/a, the reciprocal lattice parameter is inversely proportional to the real lattice parameter. The size of the k grid would have to be adjusted to compensate for the change in the lattice parameter to ensure the density of points do not change. A crystal with a large lattice parameter, such as Faujasite, would therefore require an decreased number of k points, whereas a crystal with a smaller lattice parameter, such as the metal Lithium, would require an increased number of k points.
The Helmholtz free energy was calculated at 100K intervals, from 100K to 1000K. As shown in figure 2., the free energy becomes more negative as the temperature is increased. This can be explained by looking at the equation for the Helmholtz free energy, equation 1, where A is the Helmholtz free energy, U is the internal energy, T is temperature and S is entropy.
As the entropy of the system is positive, increasing the temperature will cause the Helmholtz free energy to become more negative, or more thermodynamically stable.
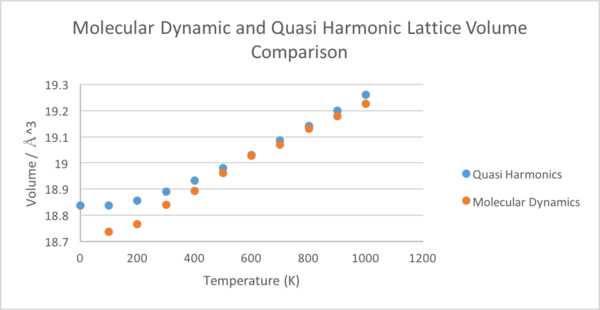
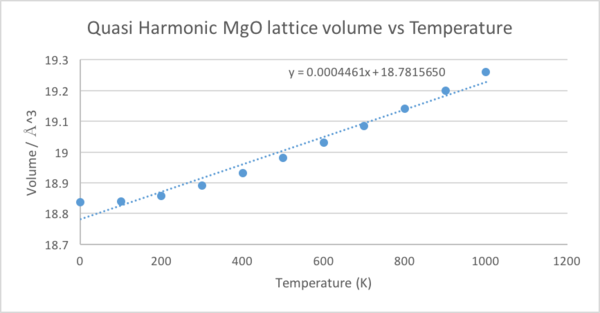
As previously mentioned, the thermal expansion of MgO was computed using two different methods. The temperature range chosen was well below the melting point of the crystal, 3098K[2], as the number of atoms used in the model were not sufficient to be able to consider the symmetry collapse of the crystal melting. As shown in figure 9., both methods produce similar lattice parameters in the higher temperature range, although they differ significantly between 0K and 300K. From the lattice parameters, it is possible to calculate the thermal expansion coefficient of MgO using equation 2.
First we shall calculate the thermal volume expansion coefficient using the quasi-harmonic approximation,as shown in figure 10. The equation implies a linear relationship between volume and temperature, so a linear line of best fit was plotted. The gradient was 0.0004461Å3K-1 and the volume at 0K was 18.836496Å3. This gave αV=2.36827x10-05K-1.
Next, we will consider the molecular dynamics computation, shown in figure 11. There is no calculation at 0K as there will be no kinetic energy at this temperature and thus the calculations break down. In order to calculate V0, the data was extrapolated back to 0K, giving 18.761418Å3. The gradient was 0.0005665Å3K-1, giving αV=3.03405x10-05K-1.
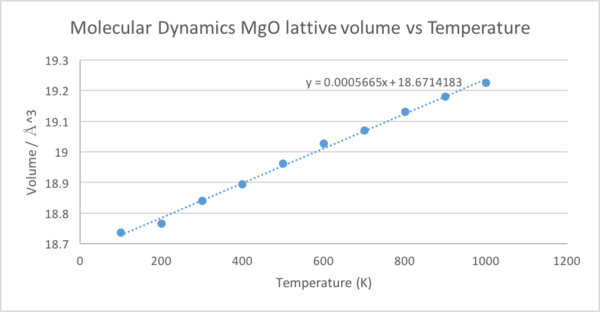
The literature value states the thermal length expansion coefficient to be αL=1.27 ± 0.22 x10-05K-1 [3], or αV=3.71 ± 0.66 x10-05 K-1 at 400k. If a quadratic curve is plotted for the quasi harmonic computation instead, shown in figure 12., it gives:

This will result in a αV=2.08x10-05K-1 at 400K, which is outside the margin of error for the literature value.
The quasi-harmonic approximation is better at lower temperatures. At low temperatures, the vibrational modes are modelled well as a harmonic oscillator. At 0K, the harmonic oscillator would remain at its equilibrium separation as there is no kinetic energy. However, the quantum model considers the Heisenberg Uncertainty Principle.
This states that there is a limit to the precision of which both the momentum of a particle and the position of that particle can be known at a point in time. Simply, this prevent the atoms from having zero kinetic energy and being precisely at the equilibrium position. This phenomena gives rise to the zero point energy, a finite amount of energy that a system must have at 0K and has been show experimentally. The molecular dynamics model does not consider this, as it is averaging the kinetic energy over all atoms.
At higher temperature, the quasi-harmonic approximation begins to break down however. As the system has more vibrational energy, the molecular potential moves away from a harmonic oscillator and is better represented by a morse potential. This would mean the internuclear separations would be calculated to be smaller than experimentally found. Instead, the molecular dynamics approach is more accurate at higher temperatures.
Conclusion
From this experiment, we can conclude both methods can produce good models for the thermal expansion of MgO for different temperatures. Quasi-harmonic methods produce better low temperature models, as at lower temperatures the crystal vibrational energy levels can be approximated to be of harmonic shape. This method also considers the zero point energy, while the molecular dynamics method does not.
The molecular dynamics calculations were more appropriate at higher temperatures. At higher temperatures, the potential graph would no longer be able to be modelled as a harmonic. This method instead uses Newton's second law, F=ma. These calculations were also carried out using a larger cell in order to get a better computation of all the forces acting on individual atoms.
Next time, I would increase the number of atoms used in the calculation and would increase the temperature up to the melting point of MgO. This would require the application of the molecular dynamics model.
[1] Hoffman, R. (1987) How Chemistry and Physics Meet in the Solid State, Angew. Chem. Int. Ed. Engl. 26, 846-878
[2] Engberg, C. J., & ZEHMS, E. H. (1959). Thermal Expansion of Al2O3, BeO, MgO, B4C, SiC, and TiC Above 1000 C. Journal of the American Ceramic Society, 42(6), 300–305
[3] Durand, M. A. (1936). The Coefficient of Thermal Expansion of Magnesium Oxide. Physics, 7(8), 297.

