Rep:Efr114MgOwiki
Introduction
Thermal expansion is the tendancy of matter to change in volume in relation to temperature, the understanding and calculation of which is essential for a vast array of fields, particularly physical sciences engineering.
The extent that a material can thermally expand can be given by the general thermal expansion coefficient, , which is definined in Equation 1.[1]
This equation can be used for solid, liquid and gaseous systems at constant pressure. A thermal expansion coefficient is an intrinsic property of the material. The coefficient's for most materials are positive values, however some materials do have negative coefficients: graphene has a negative coefficient of [2]
The purpose of this experiment was to simulate the thermal expansion of MgO and to determine the thermal expansion coefficient for MgO using both the Quasi-Harmonic Approximation method and the Molecular Dynamics method.
Methodology
MgO: The Model
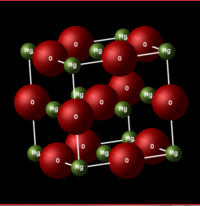
Magnesium oxide is a face-centred cubic lattice, composed of Mg2+ and O2- ions. The model used in this experiment is assumed to be ideal and non-defective with simple Buckingham repulsive potential interactions between the ions.The lattice parameters for Mgo in the input file are and
Computational Methods
DLVisualise (DLVis)was used to visualise the lattice and the output of the lattice calculations. DLVis is used to construct and modify lattices and provides a graphical user interface for GULP [3]
General Utility Lattice Program (GULP) was used to compute the lattice calculations using analytical solutions, it is a general purpose code that models atoms as hard spheres instead of separating the atom into it's components.[4]
Quasi-Harmonic Approximation
The Quasi-Harmonic Approximation (QHA), as it's name suggests, is a modification of the well- known classical mechanic harmonic oscillator system . QHA is dependant on volume, allowing the model to be used for thermal expansion calculations, the harmonic oscillator model could not be used for such calculations as it imply's that the interatomic distance between ions is independant of temperature.
The free energy of the crystal can be modeled using the QHA using Equation 2.
corresponds to the internal energy term, corresponds to the sum of zero point energies and corresponds to entropy.
Molecular Dynamics
Molecular Dynamics (MD) is a classical mechanical model that randomly assigns the velocities of the particles of the system, which are scaled using the Boltzmann distribution, force, acceleration and hence trajectory can then be calculated at timesteps throughout the simulation which runs to a time-averaged equilibrium if allowed to run for an appropriate time. If the input system obeys the Ergodic hypothesis, the macroscopic thermodynamic properties, such as the thermal expansion coefficient and Helmholtz free energy can be calculated.
Results and Discussion
MgO: Internal Energy
A single point calculation using GULP was used to measure the total lattice energy of an MgO ionic lattic , which produced an output file containing measurement of specific properties of the input structure such as , however it does not optimise or change the structure. The total lattice energy, the energy required to seperate every ion in the lattice to infinate separation, was calculated to be of -41.0753 eV per primitive cell. This value corresponds to 3963.1638 kJ mol-1.
Phonon dispersion
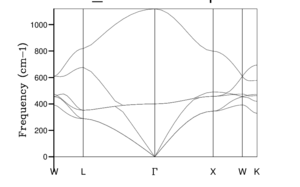
All possible vibrations of a crystal can be assigned a k-vector. To plot the vibrational frequencys over the whole three-dimensional k space would be extremely difficult and computational chemists use a specific set of k-points that depict a connected path of specific symmetry points, which are k-points that have particularly high symmetry, to plot a phonon dispersion curve. The relationship between and k-point is called the phonon dispersion relation.
The phonon dispersion operation in GULP was used to calculate the phonon dispersion curve for MgO, which is a plot of phonon vibration frequency against k-point. The frequency was calculated for 50 k-points including , seen in Fig. 2, where corresponds to
The phonon diagram of MgO was plotted, seen in Fig. 2. The diagram has 6 branches, which is concordant with theory of lattice vibrations which states that, for a 3 dimensional model with an n number of atoms in it's primitive cell, , hence for a primitive cell of two atoms, 6 branches should be visible in the photon dispersion graph. There are two types of phonon: an acoustic phonon and an optical phonon.
Acoustic phonons are lower frequency and tend to 0 at the k-space origin, they correspond to in-phase vibrations of neighboring atoms. These phonons exhibit more bonding character due to the in-phase movement away from the k-space origin. Optical phonons are high frequency and have non-zero values at the k-space origin, they correspond to out-of-phase vibrations of neighbouring atoms. For the three-dimensional system with a primitive cell of n atoms,
and
which can be clearly identified in Fig. 2. As seen in Fig. 2, branches merge with other branches and some branches appear to separate, this is due to the symmetry involved in k-space 'path'.
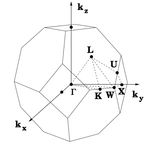
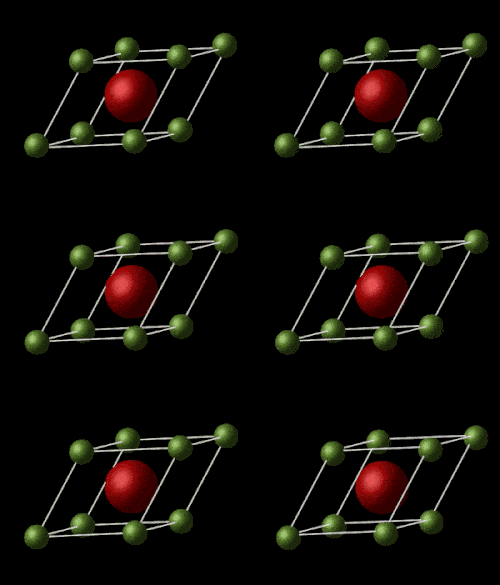
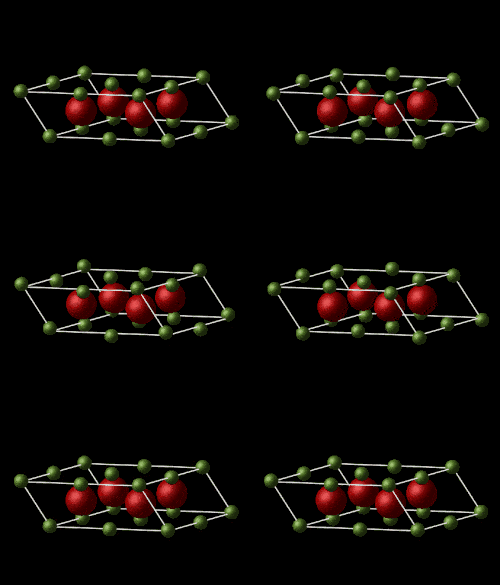
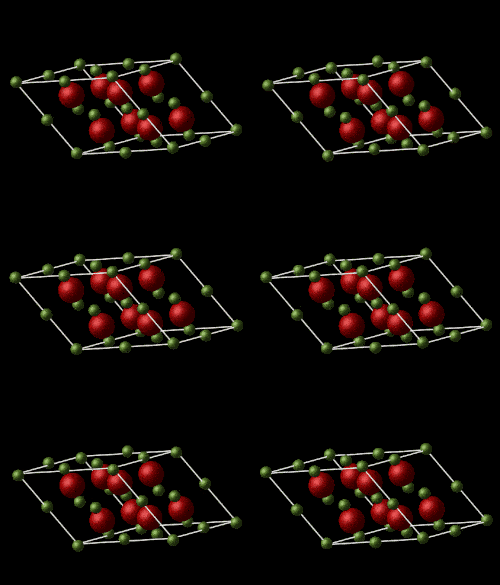
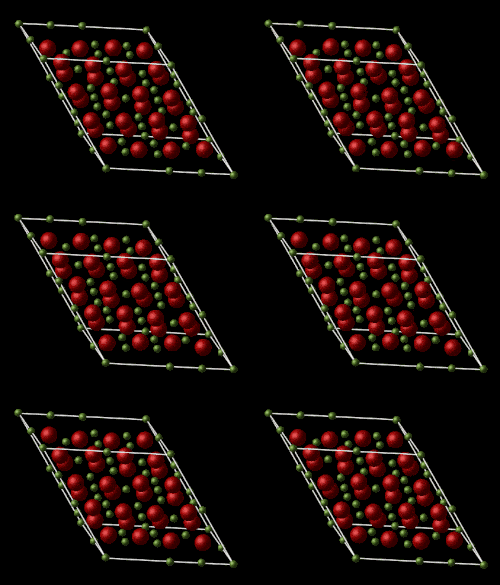
The k-space coordinates of the symmetry points in Table 1 were used with the animator function DLVis to produce the animations seen in Fig. 4 a-e. These are visualizations of the lowest frequency phonon for the symmetry points
. The
phonon can be represented within a primitive cell, however, the phonons become more complex and need to expand to larger supercells, to produce a visualisation of the whole phonon.
| Symmetry point | Real Space
|
Reciprocal space
|
|---|---|---|
| X | ||
| W | ||
| L | ||
| K | ||
| Table 1: A table of values for the real space and
reciprocal space coordinates for symmetry points | ||
Density of States
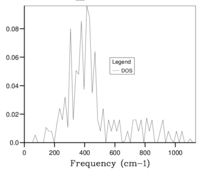
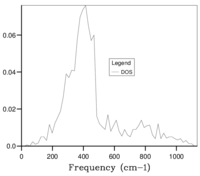
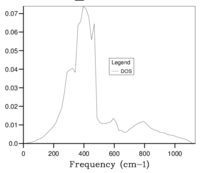
The phonon DOS operation in GULP was used to calculate a phonon density of states (DOS) plot, which is a plot of intensity against frequency of the phonon. A phonon DOS plot displays the density of vibrational energy states at a given frequency which is the number of vibrational energy states per unit frequency at any given frequency.
For a 'complete' DOS plot, every k-point in the Brillouin zone should be used in the calculation, however this calculation would require an extremely large amount of CPU and would be expensive to run. A sample of the points must be used, this is achieved by the use of a grid of points is then used. The construction of the grid is based on a shrinking factor (SF), an increase in SF results in more k-space values sampled.
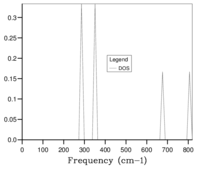
Initially, a 1x1x1 grid (shrinking factor 1) was used in calculations, producing Fig. 5a, this grid corresponds to one k-point sampled for the calculation. Fig. 5a has 4 peaks at frequencies of ca. 290,350, 680 and 810 cm-1.
These values were directly compared with the values from the photon dispersion graph, seen in Fig. 2 to conclude that the sampled k-point was the symmetry point L, this is also confirmed by the .log output file. A sample of one-k point does not accurately represent the phonon DOS of the whole crystal and the grid size must be increased to improve the accuracy. If the grid size is too high, too many k-points are sampled, increasing the CPU usage making the calculations longer and more expensive. A compromise between accuracy and CPU usage must be found.
 |
 |
 |
 |
 |
 |
 |
The optimal grid size was found by calculation of the phonon DOS, increasing in increments of SF 5. The optimal SF was found to be in between SF 30 and 35, following which calculations of phonon DOS, increasing in increments of SF 1 and starting from SF 30 were performed to result in a conclusion that a SF of 33 was the optimal value, this value was obtained from a qualitative method which increases the possibility for error. Above the optimal SF, seen in Figure 5g, the photon DOS curve does becomes more smooth and there is a small shift frequency values, however the small gain in accuracy is not worth the extra processing required.
Helmholtz free energy (HFE)
Helmholtz free energy (HFE) calculations were run under the harmonic approximation at 300K. The shinking factor was varied between 1 and 30 in steps of 5 and the optimum grid size was found to be between shrinking factor 15 and 20. The shrinking factor was then varied between 15 and 20 in steps of 1 to determine the optimal grid size. Table 2 shows the values of HFE and the difference from the most accurate value of HFE ( HFE) for a range of shrinking factors.
| Shrinking factor | HFE / eV | HFE / eV |
|---|---|---|
| 1 | 40.930301 | 0.0161 |
| 2 | 40.926609 | 0.0198 |
| 3 | 40.926432 | 0.0201 |
| 5 | 40.926463 | 0.0200 |
| 10 | 40.926480 | 0.0200 |
| 15 | 40.926482 | 0.0200 |
| 16 | 40.946482 | 1.0000*106 |
| 17 | 40.946482 | 1.0000*106 |
| 18 | 40.946483 | 0.0000 |
| 19 | 40.946483 | 0.0000 |
| 20 | 40.946483 | 0.0000 |
| Table 2: the values of HFE and the difference from the
most accurate value of HFE for a range of shrinking factors | ||
The accuracy of the HFE increases with increasing shrinking factor. To obtain an accuracy of 1 meV, a grid of 2x2x2 should be used. For an accuracy of 0.5 meV, a grid of 2x2x2 should be used and to obtain an accuracy of 0.1 meV, a grid of 3x3x3 should be used. The data in this simulation suggests that an 18x18x18 grid is the optimum grid size as it is the lowest grid size that still gives the energy to an accuracy of 6 decimal places. Considering the qualitative visual inspection method as well as the energy calculations, an 18x18x18 grid was chosen for further calculations.
Quasi-Harmonic Approximation Method
GULP optimisation calculations were used to calculate the Helmholtz free energy and lattice parameters of MgO at temperatures ranging from 0-1000 K. These calculations are under the quasi-harmonic approximation method. A shrinking factor of 18 was used for these calculations, due to conclusions from earlier stages of the experiment.
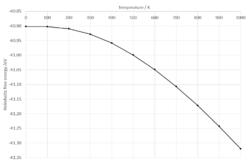
The variance of Helmholtz free energy with temperature can be seen in Fig. 6a. There is an inverse quadratic relationship between the Helmholtz free energy and temperature, confirmed by a R2 value of 0.9995 for a quadratic fit trendline. The shape of the plot in Fig. 6a can be explained using the equation for Helmholtz free energy (Equation 3).
MgO has a negative and hence exothermic lattice energy. At lower temperatures, both the internal energy and the component contribute to the Helmholtz free energy resulting in a non-linear region. As temperature increases, the component becomes increasingly dominant in the contribution to Helmholtz free energy and the plot becomes tends to linearity.
 |
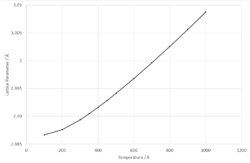 |
The varience of lattice parameter with temperature can be seen in Fig. 6b. The lattice parameter increases with increasing temperature, indicating positive thermal expansion coefficients. At lower temperatures (100 - 450 K), the data has a quadratic fit but at higher temperatures (500 - 1000 K), the data has a linear fit. The general trend of thermal expansion with increase in temperature can be explained by considering the effect of an increase of energy in the lattice system. The more energy input into the lattice, the higher energy phonons are more populated. As seen in the phonon dispersion plot, the higher frequency phonons are optical phonons - which correspond to out-of-phase vibrations with neighboring atoms, this causes increased vibration and interatomic seperation of the ions which results in expansion of the lattice.
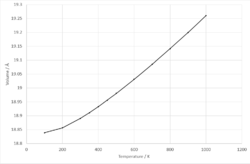 |
Volume of the unit cell of MgO can now be calculated within the temperature range 100 - 1000 K, seen in figure .At lower temperatures (100 - 450 K), the data fits a quadratic trendline and an expression can be found for volume within this temperature range. The following calculation can then be performed to find the thermal expansion coefficient.
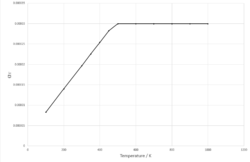 |
Figure 8 shows the plot of thermal expansion coefficient against temperature for 100-450 K, it shows that thermal expansion coefficient is proportional to temperature within this temperature range.
At higher temperatures (500 - 1000 K), the data fits a linear trendline and an expression can be found for volume within this temperature range.
a
This calculated value is in agreeable magnitude with literature, with a 3.5498% percentage difference to the literature value, which states a thermal expansion coefficient of .[6]
Molecular Dynamics
GULP Molecular Dynamics calculations were used to calculate the lattice parameters of MgO at temperatures ranging from 0-1000 K. A supercell composed of 32 primitive cells and a SF of 1 was used for the calculation. The supercell was used to find an optimal input that was a compromise between accuracy and CPU usage.
A supercell is required for MD calculations as the simulation in dependent on a large system of atoms with randomized velocities and randomized population of states.
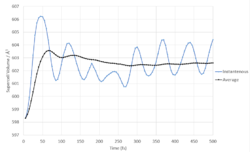 |
Fig. 9 show's how the volume of the supercell varies with time at 300K. Initially, the system is equilibrating, however after the first 200 fs the averaged volume starts tending towards an equilibrium.
 |
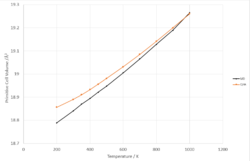 |
Fig. 10a shows there is a linear relationship between primitive unit cell volume and temperature. A thermal expansion coefficient of 3.0454*10-5 was extracted from the data, this value is in the same magnitude with a percentage difference of 2.0772% from the literature value of 3.11*10-5. [7]
Extension: CaO: calculations and comparision

Methodology
DLVis- The input DLVis structure was altered using Edit > Model > Modify Atoms to change the atom type from Mg to Ca. The Edit > Lattice Parameter function was then used to uniput the conventional cell lattice parameter of 4.8108[8]
GULP- The GULP library file also had to be altered to adjust for the different Buckingham potentials involved with CaO compared to MgO.
The same methodolody of the MgO experiment was then used.
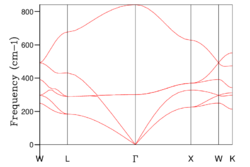
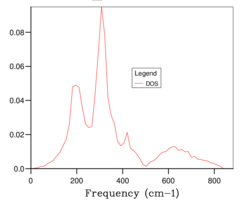
The phonon dispersion curve was calculated and the optimal grid size of 20x20 was determined, which can be seen in Fig 12 a and b respectively.
As expected, the calculated phonon dispersion curve for CaO shows great similarity to that of MgO and three acoustic branches and three optic branches can be seen, which is concordant with theory. The DOS graph is for shrinking factor 20, which was found to be the optimal grid size, complimenting the earlier hypothesis of the expected similarity of optimal grid size for CaO compared with Mgo
 |
 |
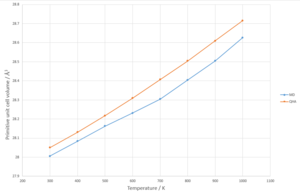
QHA and MD methods were then applied to the calcium oxide model to determine plots of primitive unit cell volume against temperature to produce Fig. 13. The QHA calculation method produced a thermal expansion coefficient of 5.0271*10-5 K-1and the MD calculation method produced a thermal expansion coefficient of 4.9243*10-5 K-1from 300 to 1000K in comparison to a literature value of 4.0791*10-5 K-1.[9]
Conclusion
The thermal expansion of MgO was investigated using two models, the quasi-harmonic model and the molecular dynamic models. In the quasi-harmonic model, phonon dispersion curves, phonon density of state curves and Helmholtz free energy were calculated at different grid sizes to determine that a grid of 18x18x18 was the optimal grid size for use in the subsequent calculations of thermal expansion coefficient using the quasi-harmonic model. Although the quasi-harmonic model is less accurate than the molecular dynamics model, it still has the significant advantage of using much less CPU and is less expensiveThe molecular dynamic model was found to be more accurate however the model does have issues with CPU usage and cost.
The experiment was also extended to CaO via modification of both DLVis and GULP files. The optimal grid size for which was found to be 20x20x20. The thermal expansion coefficients for both CaO and MgO were determined
References
- ↑ N. C. Corsepius,T. C. DeVore, B. A. Reisner and D. L. Warnaar, J. Chem. Edu., 2007, 84, 818-822
- ↑ D. Yoon, Y-W. Son and H. Cheong, Nano Lett., 2011, 11, 3227-3231
- ↑ http://www.cse.clrc.ac.uk/cmg/DLV/
- ↑ http://www.staff.amu.edu.pl/~magchem/GULP/gman.html
- ↑ http://nms.kcl.ac.uk/lev.kantorovitch/codes/lev00/MgO_vibrations/2.html
- ↑ O. Anderson and K. Zou, J. Phys. Chem. Ref., 2016, 19, 69.
- ↑ O. Anderson and K. Zou, J. Phys. Chem. Ref., 2016, 19, 69.
- ↑ S. Speziale and S. R. Shieh, J. Geophys. Res., 111, 2006, 2203-2215
- ↑ O. Anderson and K. Zou, J. Phys. Chem. Ref., 2016, 19, 69.

