Rep:Ece14 MgO Thermal Expansion
Introduction
The concept of thermal expansion is extremely important in the wider world. From the use of materials in industry which undergo significant temperature changes, such as in manufacturing processes, where exothermic reactions are being performed on a large scale, to the fitting of windows in frames which need to survive seasonal temperature changes, the response of materials to temperature must always be considered. Should two materials be placed together which expand differently upon heating, expansion could result in buckling and failure of a structure. It is important to understand the origins of this thermal expansion and be able to quantify it, so that behaviours can be predicted and planned for.
Thermal expansion originates on the molecular scale due to inharmonicity of inter-atomic potentials. As temperature increases, higher energy states become occupied, and these higher energy states have associated with them greater equilibrium bond distances. When millions of atoms are placed together, these minuscule changes in bond length add up to give a visible expansion of a structure. Computational methods may be applied to model these bond length changes, and these are able to be scaled up to predict the behaviour of materials on a macro scale, providing data not only about the way thermal expansion works, but giving cheap, fast ways of predicting its effects.
Aims & Objectives
This investigation focuses on determining the thermal expansion coefficient of MgO, an infinite crystal on a face centred cubic lattice with initial conventional parameter a = 4.212 Å. However, it is noted here that the conventional FCC lattice is not the simplest model for the MgO crystal: a primitive cell is also able to model the crystal accurately, with a = 2.978 Å and α = 60°. These cells are inter-convertible are both considered throughout the investigation.
Two separate modelling techniques are used in this study to determine the expansion coefficient of MgO, and compares their accuracy against each other and against literature data. Both models employ classical techniques, as opposed to quantum effects; there is no use of the Schrodinger equation in these models. The chosen techniques are the application of the quasi-harmonic approximation and molecular dynamics simulations. The optimisation of each technique is examined, as is the change of expansion coefficient with temperature in the results.
Computational Methods
Quasi-Harmonic Approximation
The harmonic approximation as a model for bonding interactions between atoms is well established. The two atoms are modelled as attached by a spring, with a spring constant , leading to the restoring force being the only force acting on the atoms.
This means that molecular interactions are entirely based on the spring model, and unrelated to temperature; naturally, this model cannot be used to calculate molecular expansion. Distribution of atoms across the energy levels in the potential curve is given by the Boltzmann distribution, so higher temperatures lead to higher energy states being more populated. However, the potential is parabolic in harmonic models, so is symmetrical, and no change in atomic displacement is associated with an increase of population of high energy states. Consequently, it is necessary to add some kind of inharmonicity to the model, such that the inter-atomic distance can increase.
The resulting formula may be used to determine Helmholtz free energy of a spring being modelled by a sum of the internal energy (lattice enthalpy), the zero point energy and an entropic thermal excitation term. The origin of the zero point energy is from quantum effects: at 0K, momentum of a particle cannot equal zero due to the resultant violation of the Heisenberg uncertainty principle. Therefore, it can be inferred that a particle will always have a non-zero kinetic energy.
In the above formula, refers to the phonon momentum vector, meaning summation across all of k-space (reciprocal space), while refers to the phonon branch.
It is known that the vibrational frequency of a bond directly correlates to its strength. In the latter part of the above equation, the quasi-harmonic oscillator model introduces an explicit term relating the bond vibrational frequency to bond length, and therefore lattice volume. Therefore, the system may adopt different equilibrium volumes depending on the vibrational frequency of the bonds; this vibrational frequency is described using phonons of wavevector .
It is important to note that even though the quasi-harmonic approximation does allow thermal expansion to be measured, it does maintain the assumption that the harmonic approximation holds for all values of the lattice parameter.
Molecular Dynamics
The second model used in this experiment is the molecular dynamics simulation. This model uses exclusively classical Newtonian mechanics, summing the total classical forces acting on an atom to determine its acceleration. Using this, the system is then able to calculate velocity and position after time . The system then calculates the new forces acting on the atom in a looped algorithm, where a new acceleration, velocity and position must be recalculated at each timestep. As the calculation proceeds, the system fluctuates until it reaches equilibrium; this point is apparent as temperature fluctuations become negligible if sufficient timesteps were taken.
The molecular dynamics simulation needs more manual adjustment to optimise than the quasi-harmonic approximation, as each temperature the simulation is run at may require different parameters for timestep due to increased amplitude of system fluctuations with temperature; higher temperatures often require smaller timesteps to minimise loss of information within these fluctuations. Also, high temperature calculations may need to be run for longer as larger fluctuations tend to take longer to equilibrate. Furthermore, due to the loop nature of the algorithm, this model requires significantly more computational power than the quasi-harmonic model.
Results and Discussion
Phonon Dispersion
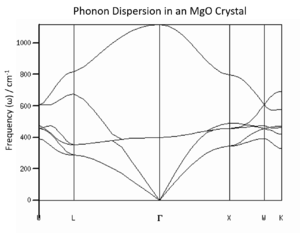
The first stage of this investigation focused on the examination of phonon dispersion in an MgO crystal. Briefly mentioned above, phonons are a description of vibrational modes across the entire crystal, and may be completely described by their momentum wavevector . While phonons have discrete energy levels, when considering an infinite periodic crystal, the energy levels become such high density and so close together they may be observed as continuous bands. These bands may be illustrated in phonon dispersion diagrams as branches, seen in Figure 1.
The figure depicts one Brillouin zone, also known as the primitive cell of reciprocal space. As the crystal considered is periodic in real space, so are its phonon modes in reciprocal space. This particular diagram shows the change in across three dimensions, where the Γ position denotes the value for entirely in-phase vibrational motion. As the primitive cell of the lattice contains more than one atom (it contains one Mg and one O atom), and this diagram depicts the phonon modes of a 3D solid, there are 3 acoustic bands, and 3N-3 (where N is the number of atoms in the primitive cell) optical bands. Acoustic bands involve concerted in-phase motion of atoms in a solid (the three for the three dimensions are one longitudinal and two transverse waves), while optical bands have atoms vibrating out of phase, hence their higher energy.[1] In Figure 1, the expected 6 phonon branches are clearly observable.
It is important to note that the k-space primitive cell (Brillouin zone) is across the range , where a is the unit cell parameter in a primitive cell in real space. Consequently, there is an inverse relationship between a*, the Brillouin zone cell parameter, and a, the real primitive cell parameter. When considered with the relationship between wavevector and wavelength, it is clear that the frequency of a vibrational mode is explicitly related to volume of the unit cell.
Choice of Shrinking Factor
Before applying the quasi-harmonic approximation to a range of temperatures, it was necessary to determine the reciprocal space grid size which would be appropriate to use for the MgO lattice. The grid size refers to the number of values (phonon wave vectors), therefore the number of vibrational modes, used in the model of the system. For an infinite lattice, there are associated an infinite number of vibrational modes, though these would take an infinite amount of time to evaluate. Instead, an optimum number of vibrational modes must be established, such that simulations may be run in a reasonable amount of time without significant loss of accuracy.
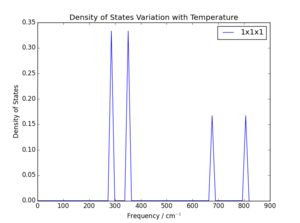
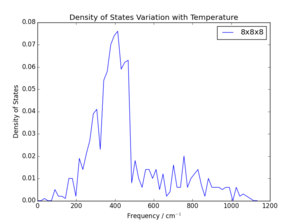
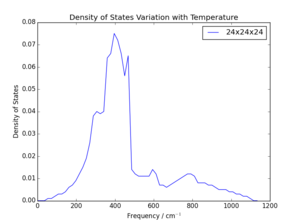
The potential grid sizes were assessed by running a GULP simulation to output the phonon density of states using different grid sizes, with a defined system temperature of 0K. Visual comparison of density of states plots at varying grid sizes and determination of the degree to which the free energy of the considered system converged were both used to select an optimum grid size. The grid is given as as the grid is to considered in three dimensions. Results are summarised in Figures 2-5 and Table 1. Note that refers to the difference between calculated lattice energy for that grid size and converged lattice energy.
| Grid Size | Number of k Values Considered | Lattice Enthalpy / eV | / eV |
|---|---|---|---|
| 1x1x1 | 1 | -40.930301 | -0.003818 |
| 2x2x2 | 4 | -40.926609 | -0.000126 |
| 4x4x4 | 32 | -40.926450 | 0.000033 |
| 8x8x8 | 256 | -40.926478 | 0.000005 |
| 16x16x16 | 2048 | -40.926482 | 0.000001 |
| 24x24x24 | 6912 | -40.926483 | 0 |
| 32x32x32 | 16384 | -40.926483 | 0 |
| 64x64x64 | 131072 | -40.926483 | 0 |
As is clear, the increase in the grid size increases the accuracy of the model. This is what would be anticipated, as the values chosen for the grid are shrinking factors; this means the number of values which are to be used within a Brillouin zone. The larger the shrinking factor, the more phonon modes are included in the calculation of density of states, and the more modes are included in the averaging of molecular behaviour and free energy. For example, in the grid, only one value is evaluated. As can be seen above, this provides a very poor representation of the dispersion of phonon energies and gives a significantly inaccurate measure of free energy. It can be determined through inspection that the particular value assessed in the grid is the L position in the W-L-G-W-X-K pathway: only 4 energies are observed, two at double the energy state density of the others. This corresponds to the two sets of two degenerate branches and two additional branches at the highest energies, which are clearly seen in Figure 1. The L position refers to values of in each coordinate, meaning the most central position in the Brillouin zone.
It is notable that the general shape of the density of state curves converges rapidly as grid size is increased. This is because as shrinking factor is doubled, the number of values summed increases by a factor of 8. Should the requirements of the system be chosen such that the lattice energy be accurate to 1 meV or 0.5 meV, a minimum of grid size of would be necessary, and a grid size of would give accuracy to 0.1 meV. This observation, and the comparison of phonon density of state curves in Figure 3 and Figure 5, means it would be reasonable to assume a grid of only would be appropriate, especially given the error in lattice energy was only 5 μeV. However, the small increase of CPU time for these calculations was considered acceptable for the reduction in error to zero. Ultimately a grid size of was chosen as this was the lowest grid size tested which showed fully converged lattice energy; larger grids showed no further convergence. The time taken to run the calculation was approximately 4s, around 10s faster than a grid. Consequently, the next grid size up was considered an unnecessary increase of CPU time for negligible improvement in calculation accuracy.
Relationship between shrinking factor and lattice parameter
When the results of the above optimisation method are examined, it might be thought a similar sized grid would work well with a crystal lattice of equivalent structure. This is not necessarily the case. As stated previously, has an inverse relationship with wavelength, and therefore lattice parameter. Consequently, as the lattice parameter in real space is increased, in reciprocal space the Brillouin zone decreases. Therefore, the same shrinking factor would select values closer together, providing a smoother curve. This system is illustrated below for three alternative FCC lattices, each with a different lattice parameter.
Faujasite crystals, a type of aluminium-silicate compound, can have cubic lattices with a cell parameter of as large as 25.132 Å (though this is known to be the largest unit cell for faujasite; unit cell can vary down to 24.669 Å dependent on Al content)[2]. This very large lattice parameter would cause significant condensation of the reciprocal lattice parameter, such that far fewer values would be required to obtain the same accuracy average of phonon energies, hence a smaller shrinking factor. This is also due to the increase in phonon branches which would be observed in a faujasite unit cell, due to the unit cell containing far more than two atoms.
The similarities between the very similar crystals of MgO and CaO would suggest very similar shrinking factors would be appropriate for the two crystals. For the conventional face centred cubic unit cell, both crystals contain 4 of each metal and oxygen atom, with lattice parameters of 4.212 Å for MgO and 4.811 Å for CaO at 297 K[3][4]. Consequently, it can be presumed that energy state density would be very similar for these two crystals, and a similar number of values would be required for equivalent accuracy, perhaps slightly fewer required for the CaO due to its larger lattice, and again, a smaller shrinking factor. The effect would be less pronounced than comparison with a faujasite due to identical numbers of phonon bands and the smaller difference in lattice parameter.
A very tight crystal structure such as lithium, a metal, would therefore be predicted to have the largest required shrinking factor. The lattice parameter of Li is 3.49 Å[5], so it would have the largest reciprocal unit cell size with the greatest potential loss of information through use of a small shrinking factor. However, it may be necessary to consider however how reasonable it is to model a metal as a series of harmonic oscillators comparable to MgO; due to their delocalised sea of valence electrons, cation-cation bonds are not as strong themselves as they are heavily shielded, which may decrease phonon energy. This could increase phonon density of states, leading to a smaller shrinking factor being required, though further investigation would be required to examine this hypothesis.
Modelling Thermal Expansion of MgO
Equilibrium volume of an MgO unit cell at a range of temperatures between 0K and 3000K were calculated by two separate methods: quasi-harmonic approximation and molecular dynamic modelling. Temperature was varied across the same intervals for each model used; the theory behind each model choice is explained above. The change in volume of the unit cell was able to be used to calculate normalised expansion coefficients for different temperature ranges.
Quasi-Harmonic Approximation
 |
 |
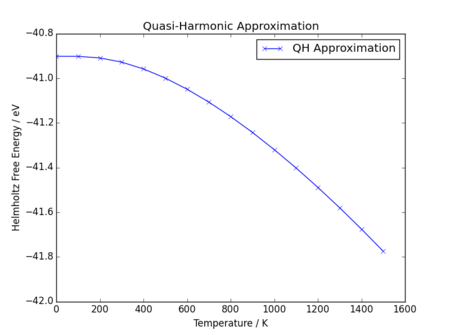
The application of the quasi-harmonic approximation shows immediately that both Helmholtz free energy and equilibrium cell parameter are initially non-linear with respect to temperature when calculated this way, and as temperature increases the relationship becomes increasingly linear. The Helmholtz free energy is shown to decrease with increasing temperature; this is what would be anticipated as Helmholtz free energy is defined as:
Clearly, as temperature increases, the entropic term becomes larger than the internal energy term. When temperature is low, internal energy dominates (at 0K, ), but the temperature increase leads to an increase in entropic term until the internal energy term is comparatively insignificant, resulting in a linear decrease (or increase in negativity) of Helmholtz free energy. It is notable that as the solid remains considered a solid throughout the considered temperature range, so a significant increase in entropy with temperature is not expected; however, there appears to remain some non-linearity as temperature increases, which could be due to increasing entropy due to increased molecular motion.
Simiarly, the primitive cell parameter also shows non-linearity at low temperature, before reaching a period of linear increase. Increase in lattice parameter, and therefore cell volume, is expected with temperature, as there is an increase in kinetic energy of the atoms. This leads to increased motion, leading to an increased average distance between atoms, and therefore thermal expansion. At low temperatures, the zero point energy inducing motion is comparable to the motion induced by the entropic term (see Quasi-Harmonic Approximation); however, as temperature increases, the entropic term becomes larger and zero point energy contribution becomes negligible, such that expansion appears to be linear with temperature.
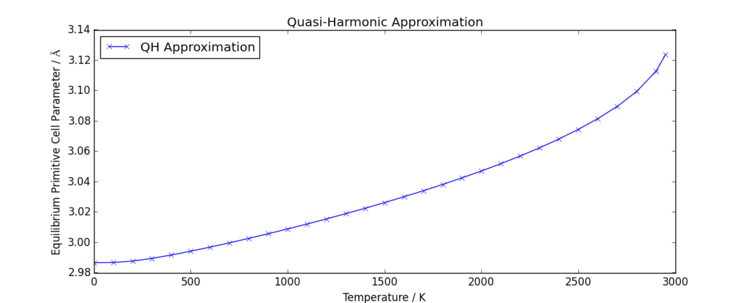
When the model is expanded to higher temperatures, further non-linearity is observed in the increase in primitive cell parameter, as shown in Figure 8. It is well known that the simple harmonic interaction of atoms only works for small vibrations, so it is plausible that the accuracy of the model decreases significantly with increased temperature, as temperature increase will affect how well the harmonic oscillator model aligns with the more accurate Lennard Jones potential. Additionally, the system may be limited by the lack of long-range interactions between atoms, which may also limit the accuracy of the model.
It is interesting to note that as the quasi-harmonic approximation was applied to very high temperatures (i.e. 3000K), the model failed. Due to the models assumption that atoms undergo purely simple harmonic motion, there is no possibility of the inter-atomic potential tending to zero as atomic separation is increased with vibrational motion. In other words, there is no way of modelling the system melting. The failure of the model observed however was a loss of lattice form; two lattice parameters extended past 50 Å while the third shrank to below 2 Å. In contrast, lower temperatures gave one equilibrium parameter (such that all three cell parameters were identical) with no significant deviation from the primitive cell bond angle of 60°. This is likely due to a failure to find a minimum energy separation; either vibrations were so large that they would have resulted in Mg and O atomic collisions, which the model is not designed to cope with, or perhaps the potential energy of the harmonic oscillator was pushed above zero interaction energy, destabilising the system. This is the point where molecules would repel each other, but as bond breaking is not a phenomenon which may occur in the model, instead the lattice is pushed out of realistic formation and the model collapses. Notably the failure of the model occurs at a lower temperature than the real melting temperature of 3250 K[6]. This is likely due to the lack of long-range interactions being considered by the model, as well as potentially a lack of covalent character and electron sharing, which would increase bond strength within the lattice. Furthermore, the quasi-harmonic approximation relies upon poorly polarisable cations. It is noted from literature that the valid temperature range for MgO for thermal expansion coefficient calculation is 10 times larger than for CaO[7].
Molecular Dynamics Model
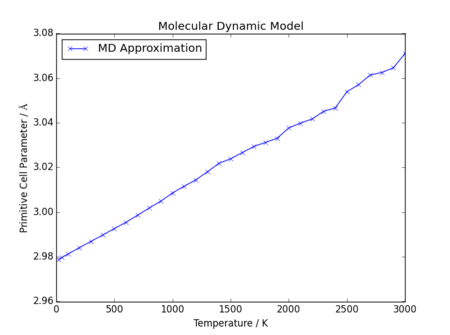
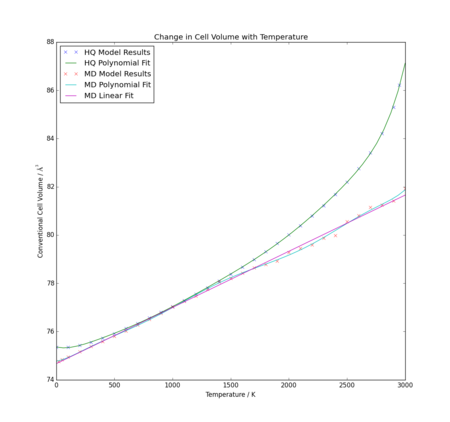
In direct contrast to the results observed from the quasi-harmonic model, the molecular dynamics model produces far more linear data, with no reduction in gradient at low temperatures. This is because the molecular dynamic model has no reliance on quantum features such as the zero point energy, and assumes purely classical interactions, right down to the minimum volume observed at 0K.
Again, in contrast to the deviation observed using the quasi-harmonic approximation, at high temperatures there is not an obvious upward shift in lattice parameter. Instead, the relationship between lattice parameter and temperature appears to remain linear, but there is an increase in deviation from a fitted linear regression. This is likely due to the limitations of the model, and failure of the model to equilibrate in the selected number of steps, as in this investigation the same number of steps was used at all temperatures. The timestep chosen here was 0.1 fs, with 5000 equilibration steps and 5000 production steps; however, it is plausible this selection was insufficiently accurate at high temperatures. Interestingly, the model did not fail in the same way the quasi-harmonic model did at high temperatures; a 3000K run was possible.
Thermal Expansion Coefficients
The volume thermal expansion coefficient may be readily calculated from the equilibrium volume data calculated above using the following relationship:
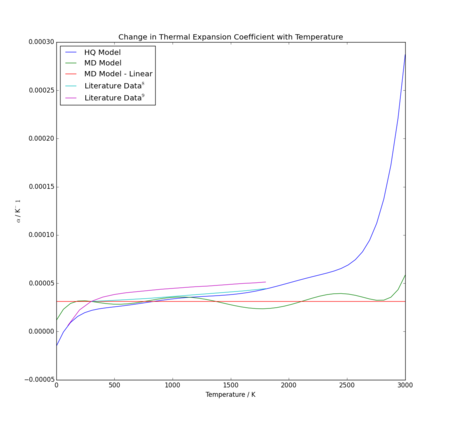
A linear fit was applied to the results of the molecular dynamics graph, as this was considered the most appropriate method of calculating expansion coefficient for a clearly linear relationship. However, thermal expansion coefficient does not necessarily remain constant with temperature, particularly with the quasi-harmonic approximation which has an obviously non-linear fit. In order to make a good comparison to literature data and each other, an 8th order polynomial was fitted to each data set, and compared directly in Figure 11. The two curves are notably different, except both provide very similar volumes over the temperature region 500-1500K. As discussed previously, only the quasi-harmonic approximation deviates significantly from a linear relationship due to the quantum effect of the zero point energy. At high temperatures, both models deviate as discussed above, though it again appears that the major deviation is from the quasi-harmonic approximation.
Comparisons of calculated values for each model and literature values are summarised in Table 2 and Figure 12. The value chosen for was the initial volume for each model at 0K.
 |
 |
| Temperature / K | Quasi-Harmonic αV / 10-5K-1 | Molecular Dynamics αV / 10-5K-1 | [8]Literature αV / 10-5K-1 | [9]Literature αV / 10-5K-1 |
|---|---|---|---|---|
| 100 | 0.619 | 3.117 | 0.63 | |
| 200 | 1.688 | 3.117 | 2.24 | |
| 300 | 2.181 | 3.117 | 3.12 | 3.13 |
| 400 | 2.412 | 3.117 | 3.17 | 3.57 |
| 600 | 2.701 | 3.117 | 3.30 | 4.02 |
| 800 | 3.051 | 3.117 | 3.44 | 4.26 |
| 1000 | 3.382 | 3.117 | 3.63 | 4.47 |
| 1200 | 3.591 | 3.117 | 3.82 | 4.65 |
| 1400 | 3.728 | 3.117 | 4.01 | 4.80 |
| 1600 | 3.960 | 3.117 | 4.20 | 4.98 |
| 1800 | 4.407 | 3.117 | 4.44 | 5.13 |
The first note to make about the results is that observed for the molecular dynamics model. As can be seen, the volume thermal expansion coefficient appears to fluctuate with temperature, but fluctuates very evenly about a perfectly straight line. Consequently, it can be concluded that the linear relationship is an adequate fit, as negligible additional information is gleaned from the polynomial fit. Hence, the same value of has been provided at all temperatures in Table 2. However, for the quasi-harmonic approximation, a dependence on temperature is clearly shown in thermal expansion coefficient. Though not a uniformly steep gradient, it is observed that increases with temperature across the entire range of the experiment.
The second observation is the scale of the expansion coefficients. They are extremely small, all of the order of 10-5 K, including literature values. This shows that the models are both at least reasonable for approximating expansion, as both predicted the solid would behave realistically, not expanding at the same rate as, for example, a liquid, which would likely expand significantly more due to the significantly less restrained atoms.
When comparing literature values to the data obtained from these models, it is apparent that the molecular dynamics system is flawed in that it does not show increase of with temperature, which all experimental data from literature did show. Similarly, its lack of a zero point energy term means there is no additional reduction of - a feature which may be clearly observed in one literature data set. This means at low temperatures, the quasi-harmonic approximation provides a significantly more accurate model. Furthermore, the quasi-harmonic model appears to have a gradient concordent with values from literature, as seen in Figure 12; even though the values come up consistently low, literature experimental trend matches well. However, at high temperature, there is a clear divergence which is not accounted for in literature. This is likely, as previously discussed, due to failure of the quasi-harmonic model at high temperatures. Further analysis of third party data would be necessary to determine if the molecular dynamics model is able to adequately behave as an appropriate model of thermal expansion coefficient at higher temperatures. Based on the current trend, it would be expected to provide less accurate data than at low temperatures, due to continued divergence of data, but potentially an improvement on the quasi-harmonic model above ~1500K.
An interesting observation is that volume expansion coefficient for MgO using the quasi-harmonic approximation goes below zero, indicating a reduction in cell volume at very low temperatures. While more likely a limitation of the model, as the quasi-harmonic approximation is not reliable across a full range of temperatures and extremely similar curves were produced in other applications of the approximation[7], a negative expansion coefficient may be observed. While uncommon, this phenomenon is recorded in some Si and Ga crystals at very low temperatures[10] and may be attributed to low-frequency (thus low Ea) transverse vibrations which push atoms closer together than longitudinal phonon modes. Typically, as temperature increases, the stretching frequency increases and this effect is nullified with increasing temperature[11].
Conclusion
This investigation focused on the calculation and comparison of volume thermal expansion coefficients of MgO using two different computational models. It was observed that the data obtained by both models was very similar in the region of 500-1200K, and closely comparable between 300K and 2000K. Furthermore, both models produced data of the order of that found in literature. For that reason, either model could prove very useful for calculating an approximate thermal expansion coefficient. However, the results from literature appear to agree more consistently with the quasi-harmonic approximation data, especially considering the molecular dynamics results show no temperature dependence of thermal expansion coefficient - a phenomenon repeatedly observed in literature. An additional interesting insight is that the quasi-harmonic model may show low temperature negative thermal expansion, which is completely lost by the molecular dynamics model.
Therefore, combined with the knowledge that the quasi-harmonic approximation is less computationally expensive, it can be accepted that the quasi-harmonic model is a preferable method of calculating thermal expansion coefficient at temperatures below 1500K. Due to the unreliability of this approximation at high temperatures, it is likely that molecular dynamics provide a more realistic thermal expansion coefficient at high temperatures, though further investigation would need to be done to test this.
References
<references> [1] [2] [3] [4] [5] [6] [7] [8] [9] [10] [11]
- ↑ 1.0 1.1 P. K. Misra, Physics of condensed matter, Academic Press, 2012.
- ↑ 2.0 2.1 E. Dempsey, G. H. Kuehl and D. H. Olson, J. Phys. Chem., 1969, 73, 387–390.
- ↑ 3.0 3.1 C. A. and editors of the volumes III/17B-22A-41B, in II-VI and I-VII Compounds; Semimagnetic Compounds, Springer-Verlag, Berlin/Heidelberg, pp. 1–6.
- ↑ 4.0 4.1 C. A. and editors of the volumes III/17B-22A-41B, in II-VI and I-VII Compounds; Semimagnetic Compounds, Springer-Verlag, Berlin/Heidelberg, pp. 1–3.
- ↑ 5.0 5.1 K. Hermann, in Crystallography and Surface Structure, Wiley-VCH Verlag GmbH & Co. KGaA, Weinheim, Germany, 2011, pp. 265–266.
- ↑ 6.0 6.1 C. Ronchi and M. Sheindlin, J. Appl. Phys., 2001, 90, 3325–3331.
- ↑ 7.0 7.1 7.2 A. Erba, M. Shahrokhi, R. Moradian and R. Dovesi, J. Chem. Phys., 2015, 142, 44114.
- ↑ 8.0 8.1 8.2 K. Y. Singh and B. R. K. Gupta, Phys. B Condens. Matter, 2003, 334, 266–271.
- ↑ 9.0 9.1 9.2 O. L. Anderson, D. Isaak and H. Oda, Rev. Geophys., 1992, 30, 57.
- ↑ 10.0 10.1 1 K. Haruna, H. Maeta, K. Ohashi and T. Koike, J. Phys. C Solid State Phys., 1986, 19, 14.
- ↑ 11.0 11.1 1 S. I. Ahmed, G. Dalba, P. Fornasini, M. Vaccari, F. Rocca, A. Sanson, J. Li and A. W. Sleight, Phys. Rev. B, 2009, 79, 104302.

