Rep:Dz1814MgO
The Free Energy and Thermal Expansion of MgO
Introduction
Most of us have benefited from the physical phenomenon of thermal expansion when finally being able to remove a tightly screwed lid from a glass jar simply by running hot water over it for several seconds. Comparison of the thermal coefficients of expansion of the two materials provides the answer to what is happening. The glass jar has a low coefficient, whilst the lid has a higher one, therefore the hot water loosens the lid whilst not affecting the glass, allowing it to be easily removed. It is for similar reasons that you can place a Pyrex container in a hot oven but try the same with normal glass and you're likely to be left with a pile of broken pieces. More importantly, thermal expansion must be considered and accounted for in the construction of building, bridges, power lines and rail-road tracks, to name a few examples, therefore understanding the underlying chemistry and physics of the process is crucial.
This computational simulation aims to explore the response of magnesium oxide to an increase in temperature by considering the atomic interactions within an infinite crystal with no defects, calculating its energy and vibrational levels, and from there, the free energy of the system. The underlying principles of phonon dispersion and density of state of the material are calculated and explored in detail. The Helmholtz free energy is calculated, along with the expansion coefficients (equation 1) using two different methods - the quasi-harmonic approximation and a more complex molecular dynamics approach. Finally, the two methods are compared and the differences between the produced data is discussed.
Eq. 1
The Quasi-Harmonic Approximation (QHA)
The quasi-harmonic approximation (also known as lattice dynamics) is an expansion of the harmonic and is used to describe volume-dependent thermal effects (such as thermal expansion). In it, the phonon frequencies become volume-dependent and the vibrations are treated as if they did not interact with one another. The system can viewed as a lattice of atoms held together by springs, the lattice constant becomes an adjustable parameter, and the harmonic approximation holds true for every new value of the lattice constant, and so the system can be viewed as a collection of independent harmonic oscillators. This method is based on classical principles but also the quantum mechanical principles of zero-point energy and quantised vibrational states. The Helmholtz Free Energy is calculated using equation 2 - where U is the internal energy of the lattice, is the zero-point energy (it's importance is discussed in part 2.2.2), S is the entropy of the lattice due to vibrational degrees of freedom, T is the absolute temperature and V is the volume.
Eq. 2
Molecular Dynamics (MD)
Molecular Dynamics is a purely classical approach which offers a more sophisticated calculation involving the numerical, step-by-step solution of the classical equation of motions[1]. It allows atoms in the system to follow their trajectories, by letting them evolve to Newton's second law (F=ma), properties of the system are then computed by taking the time averages of their behavior. A crucial part of this simulation is choosing a timestep which provides a balance of computational efficiency and sampling of all possible vibrations. Another important aspect is the size of the cell used, further discussion of this follows in section 2.2.
Computational program
All simulations were performed in DLVisualize - a general purpose graphical user interface - using the molecular modeling code GULP (General Utility Lattice Programme). GULP performs tasks based on force field methods[2] - an atomistic technique which (unlike quantum mechanics) does not treat electrons explicitly but rather together with the nuclei as effective atoms which form a mechanically connected system[3]. The atoms are considered to be hard charged spheres, with a repulsive wall between them to prevent them from collapsing into each other due to their opposite charges.
Results and Discussion
Structure of MgO
It is first best to examine the structure of the lattice we are using. MgO is a face-centered cubic with equal lattice parameters , it has 8 atoms in its conventional cell (4:4) and 2 atoms in its primitive cell (1:1). The lattice parameter of the primitive cell in our simulation is calculated to be 2.9783 Å. Simple application of Pythagoras's theorem converts this to a lattice parameter of 4.212 Å in the cubic cell, this is in excellent agreement with the real value of 4.211 Å [4] validating our simulation.
Phonon Dispersion Curves

Phonon dispersion curves relate the frequency of vibration with the wavevector (k), they can be measured using neutron scattering spectroscopy, or alternatively, as we are about to do, they can be approximated using computational methods.
The number of branches displayed in the curve equals the number of atoms in the primitive cell multiplied by the number of dimensions - hence MgO displays six. Furthermore, a crystal with two different atoms in its primitive cell, such as MgO, displays two types of phonons and hence two types of branches - optic and acoustic - which can be seen in the dispersion curve. In a 3D lattice with N atoms, there are 3 acoustic branches and 3N-3 optic branches[5] (i.e. 3:3, acoustic:optic for MgO).
An acoustic branch results due to ordered, systematic movement of neighbouring atoms around their equilibrium positions and it tends to zero when
(i.e. at Γ). The labels of the x-axis are simply symmetry points relating to a combination of k values, where Γ, for example, is (0,0,0) and L is (1/2,1/2,1/2). The optic branches are caused by out-of-phase atomic vibration around the equilibrium position - more simply put, if a magnesium ion moves up, the neighbouring oxygen ion moves down. These branches do not display a zero-frequency at any k-value due to the formation of an electric dipole as the positively charged Mg and negatively charged O move with respect to one another.
Phonon Density of States
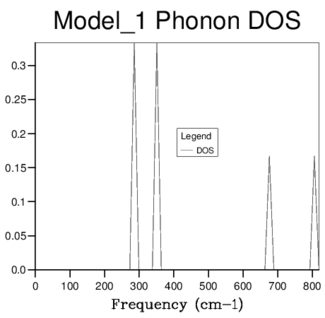
The phonon density of state (DOS) is a function of frequency which is given by combining all of the phonons described by the dispersion relation. The DOS is calculated based on the input shrinking factor (grid size), with the initial and smallest 1x1x1 grid, returning a single k point with the following frequency values (cm-1):
| 288.49 | 288.49 | 351.76 | 351.76 | 676.23 | 818.82 |
|---|
It was possible to qualitatively determine the k-point corresponding to these values by comparing the frequencies to the dispersion curve. The k-point was found to be the one at symmetry point L, examining the Log Files confirmed this to be the 16th k-point. The difference in size of the two peaks in figure 2, is due to the two lower frequency peaks being doubly degenerate and hence of higher intensity - this can be seen in the phonon dispersion curve as the two branches of lower frequency converge at point L.
Choosing the appropriate grid size
Increasing the shrinking factor splits the grid into more segments and hence measures the average over more k-values, giving a more resolved curve and a better visualisation of the vibrational energy states of the system. Eventually, the graph forms a smooth curve, and further increase in grid size does not provide extra resolution but simply increases the computational processing time, therefore we must find the optimum balance between the two. It was found that a shrinking factor of 32x32x32 provided this optimum balance as further increase did not increase the resolution, whilst a smaller grid size displayed some sharp peaks rather than a smooth curve.
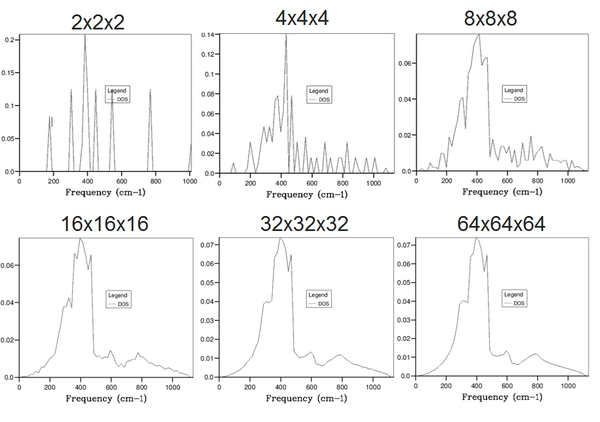

The free energy was calculated using the quasi-harmonic approximation at 300 K and 0 Pa for the same grid sizes as above in order to confirm our chosen grid size was appropriate. As can be seen, the free energy converges to a value of roughly -40.926483 eV slightly before a grid size of 32x32x32 is reached, however, we know from examining the DOS plots, that grid sizes smaller than this will not provide enough resolution and hence this is the grid size which will be used for the forthcoming calculations.
| Shrinking Factor | Free Energy (eV) | ΔA |
|---|---|---|
| 1x1x1 | -40.930301 | 0.003692 |
| 2x2x2 | -40.926609 | 0.000159 |
| 4x4x4 | -40.926450 | 0.000028 |
| 8x8x8 | -40.926478 | 0.000030 |
| 16x16x16 | -40.926481 | 0.000020 |
| 32x32x32 | -40.926483 | 0.000000 |
| 64x64x64 | -40.926483 | - |
Consideration of different systems
The appropriate grid size would vary between systems, but we can make an assumption of the size required relative to the one chosen for MgO. For example, let us consider three different systems - CaO, the Zeolite Faujasite, and pure lithium metal.
Calcium Oxide is a metal oxide similar to MgO, but with a slightly larger lattice parameter of 4.8 Å[6] due to the larger size of the calcium ion. The larger lattice parameter in real space would result in a smaller value in k-space due to its reciprocal nature and hence would require a slightly smaller shrinking factor. However since the difference is so small (0.588 Å) it would probably be reasonable to employ the same grid size as for MgO. This relationship between real and reciprocal space is rationalised through the concept of 'folding' of the branch structure[7]. Zeolites on the other hand, have a much larger lattice parameter than simple metal oxides, with Faujasite having a lattice constant of 24.7 Å - 5.86 times larger than that for MgO, hence we can predict that a grid size which is roughly 6 times smaller (i.e 6x6x6) would be appropriate.
So far we have been able to make these comparisons on the assumptions that CaO and Faujasite have similarly dispersed branch structures to MgO, however, this is not the case for lithium. Going back to our simplest model of metallic bonding, lithium can be visualised as a group of cations surrounded by a sea of negatively charged delocalised electrons. These electrons shield the positive cations whilst they are vibrating and result in weaker interactions between them, and hence a less dispersed branch structure - i.e. it would display flatter lines than those of MgO and hence a much smaller grid size would be appropriate.
Calculations using the Quasi-Harmonic approximation
The variation in free energy and lattice parameter were computed for a temperature range of 0-1300 Kelvin using the chosen 32x32x32 grid size by minimising the free energy with respect to the optimised structure at each temperature. The two graphs display the expected trends.
Lattice Parameter
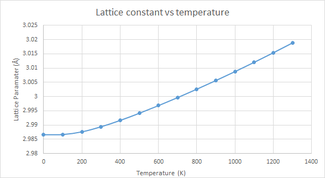
Thermal expansion is the response of matter to a change in temperature by a changing in its shape, size, or both. The lattice parameters define the length of the sides of the unit cell of a crystal, which in turn, determines the volume of the cell. Increasing the temperature increases the kinetic energy of the system causing the atoms to have a larger displacement from their equilibrium position and therefore have a greater average separation. This results in thermal expansion of the cell's volume, and hence an increased lattice parameter - this relationship is illustrated in figure 5. Thermal expansion is the norm for most materials, however, there are some examples - such as zirconium tungstate - which exhibit the opposite trend known as negative thermal expansion (NTE) resulting in contraction upon heating and expansion upon cooling[8], there are many physical origins for this, with two examples being transverse vibrational modes and phase transitions.
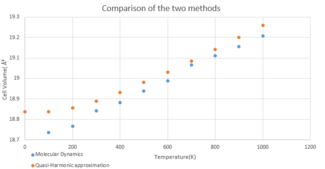
It is important to understand the difference between the quasi-harmonic and the harmonic approximation when performing these simulations. In both cases, an increase in temperature results in the population of excited states of higher energy. In the quasi-harmonic approximation, this results in an increase of the average value of inter-atomic separation - i.e. an increase in bond length and therefore thermal expansion. The harmonic approximation does not display this phenomenon due to the symmetric nature of the inter-atomic potential, the inter-atomic distance is invariant with temperature, and hence it fails to explain thermal expansion. The harmonic approximations inability to account for thermal expansion is one of its greatest limitations, because of this the quasi-harmonic model is used in these calculations.
Free Energy

The free energy displays a negative relationship with temperature. This can be explained by considering the thermodynamic equation introduced earlier.
Eq. 2
Since the entropy is the only quantity dependent directly on temperature, as the temperature of the system is increased the TS term grows linearly and the overall free energy decreases (i.e. becomes more negative). The shape of the curve can be rationalised by considering the effect of the zero point energy. At low temperatures (0-400 K) the free energy is dominated by the internal energy and the zero point energy of the system, hence showing a non-linear relationship. Above these temperature the TS term is substantially larger and becomes the dominant factor, the free energy now displays a linear relationship with further increase of the temperature (400-1000 K).
Thermal Expansion Coefficient
The thermal expansion coefficient gives a measure of how the size of a crystal varies with an increase in temperature at a constant pressure, it is calculated using equation 1. A higher coefficient at a given temperature results in a larger expansion of a material at that temperature, and the main factor affecting it, is the inter-atomic bond strength. Covalent bonds such as those in diamond, for example, are particularly strong and result in a low value and hence very little expansion, whilst materials with weaker bonds such as metals usually display a higher value and a larger expansion.[9]
The thermal expansion coefficients of MgO were calculated for three different temperature ranges, and given bellow. These temperature ranges were purposefully chosen to illustrate the importance of the shape of the curve. In the low temperature range of 0-300 the non-linearity of the curve affects the value of the thermal expansion coefficient and results in a larger deviation from literature (12.31 %). If we ignore this part of the data and calculate the coefficient taking into account only the data between 300-1300 K, we get only a 5.4% deviation from literature, this illustrates the importance of using the linear data obtained when calculating the thermal expansion coefficient using the quasi-harmonic approximation.
| Temperature Range (K) | Calculated | Literature Value | % Difference |
|---|---|---|---|
| 0-300 | [10] | ||
| 0-1300 | -- | -- | |
| 300-1300 | [4] |
We should also note that the quasi-harmonic method of calculation breaks down when approaching the melting point of the material. As discussed in the introduction, the quasi-harmonic assumes the harmonic approximation holds true for each individual lattice constant, whilst this allows it to account for thermal expansion, it still does not allow for bond dissociation and therefore fails to model the interactions near the melting point, where the disordered thermal motion takes over and the bonds between the atoms break. The melting point of MgO is much higher than the temperature range we have been working in (3,125 K [10]) therefore we can use this approximation for our calculations.
Magnesium oxide contains inter-atomic ionic bonds, the value of its coefficient would be expected to lie somewhere in between that of a purely covalent and purely metallic material, say diamond and aluminium. A comparison with literature values for these materials was performed, which verified this prediction, as shown bellow.[11][12]
| Material | |
|---|---|
| Diamond | |
| MgO | |
| Aluminium |
Calculations using Molecular Dynamics and comparison of the two methods
The primitive cell containing a single MgO unit used in the previous simulations would not be appropriate for the following molecular dynamics simulations as it would result in every cell of the crystal moving perfectly in phase, which would not be physically viable. Instead, we must again find a balance between accuracy and efficiency and choose a supercell which will accurately model the interactions between the atoms as they move along their trajectories. Increasing the number of units in the supercell allows for more vibrational modes, ideally, we would like to use an infinitely large system, which would give the most accurate data as it will provide the most accurate representation of the real system. However, this is not feasible as it would require an infinite amount of time to run. Instead, we have chosen to use a supercell containing 32 MgO units, as this was found to give sufficiently accurate results.
Examining the supercell after performing the MD simulation showed some major differences between it and the initial input cell - the atoms of both magnesium and oxygen were displaced around the lattice. This is due to the nature of the simulation, as the atoms move along their trajectories some will exit the unit cell and some from neighbouring cells will enter. The program 'rearranges' the lattice so that at every point of calculation there is a total of 64 atoms within the supercell (i.e. 32 MgO units) which results in a translational movement of the atoms.
Average Cell Volume

The average cell volume of per unit cell was calculated for a range of 100-1300 K and plotted against the data obtained from the QHA. Both methods accurately model the positive relationship of volume with temperature, therefore modeling thermal expansion, however, there is a clear difference in the shape of the graphs. The molecular dynamics model does not display the same non-linear relationship as the quasi-harmonic at low temperatures due to it being a purely classical model and not taking the zero point energy into account. Furthermore, the simulation failed to return any data when performed at extremely low temperatures (around 0 K). The MD simulation relies on the movement of atoms along their trajectories in order to calculate the average properties, however, at such low temperatures there is no thermal motion and the calculations cannot be performed. This demonstrates the limitations of the MD model at the low temperature extremes.
Thermal expansion coefficient
The coefficient for a range of 300-1300 K was computed to be which is in excellent agreement with the literature value of (measured at a temperature range of 303-1273 K) giving a difference of >1%. Comparing this to the value obtained when using the QHA in section 2.2.3 at the same temperature range (which resulted in 5.4% deviation from literature) suggests that the molecular dynamics approximation is the more accurate one to apply to this system in these conditions. The calculated value of the coefficient in the range of 100-300 K using the MD approximation, however, gives a huge error when compared to the literature value in the range of 0-300 K ( cf ). Comparison to literature further shows that this approximation is not suitable for low temperatures, however, it can provide extremely accurate results at higher ones.
Average Total Energy
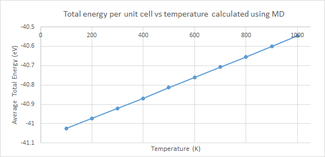
One of the major differences between MD and the QHA is that MD does not measure the vibrational entropy of the lattice and hence does not calculate the Helmholtz free energy. Instead, it calculates the internal energy of the lattice by measuring the kinetic and potential energies at each step of the simulation and combining them. The expected trend of an increase in internal energy with an increased temperature is observed (figure 9). This is easily rationalised by considering the thermodynamic equation for internal energy:
Where it the transfer of heat and is the work done on or by the system. As the temperature is increased, the value of grows and hence the internal energy increases showing the positive trend displayed in figure 9.
Conclusion
Each method has advantages and disadvantages over the other, but ultimately, both produced accurate data in regards to modeling thermal expansion of an ionic crystal. Comparing the data from the two models clearly showed their differences when performing simulations at the high and low temperature extremes. In the lower temperature limit, away from the melting point of the material, the QHA proved to be the better model for the system due to its consideration of the zero-point energy. Conversely, MD provides more accurate results at higher temperatures and allows us to calculate properties with a relatively small error at temperatures much closer to the melting point. Because the two methods displayed opposite trends at the extreme temperature limits, it may be advantageous to use the two together to allow for the analysis of a material throughout its whole temperature range.
This exercise demonstrated the power of computational simulations when investigating thermodynamic properties of crystalline structures, which would otherwise be impossible to solve analytically. Investigation of different crystalline structures would be useful in solidifying the conclusions made about the two models, it could be interesting to use a material with a different phonon dispersion to MgO such as a metal or a more complex system, such as a zeolite. Alternatively, it could be interesting to perform these simulations on a material which exhibits negative thermal expansion.
References
- ↑ M. P. Allen, John von Neumann Institute for Computing, 2004, 23, 1-28
- ↑ J. D. Gale, General Utility Lattice Program, Curtin University of Technology
- ↑ Force Field Methods, http://www.cup.uni-muenchen.de/ch/compchem/tink/mm1.html (accessed January 2017)
- ↑ 4.0 4.1 C. Y. Ho and R. E. Taylor in Thermal Expansion of Solids, ASM International, 1998, vol. 4, pp 31
- ↑ A. Sirenko, https://web.njit.edu/~sirenko/Phys-446/Lecture4-SSP-2007.pdf (accessed January 2017)
- ↑ II-VI and I-VII Compounds; Semimagnetic Compounds, ed. U. Rossler, Springer-Velag Berlin Heidelberg, Vol 1
- ↑ R. Hoffman, Angewandte Chemie, 1987, 26, pp 846-878
- ↑ T. Stephens, Unusual material that contracts when heated is giving up its secrets to physicists, University of Santa Cruz, 2004
- ↑ Fine Ceramics World, http://global.kyocera.com/fcworld/charact/heat/thermaexpan.html (accessed January 2017)
- ↑ 10.0 10.1 Magnesium Oxide (MgO), https://www.crystran.co.uk/optical-materials/magnesium-oxide-mgo (accessed January 2017)
- ↑ Thermal Properties of CVD DIamond, http://www.diamond-materials.com/EN/cvd_diamond/thermal_properties.htm (accessed January 2017)
- ↑ Thermal Effects on Materials, Isidoro Martinez, 1995-2016
