Rep:Dr1415 MgO lab
Introduction
Studying the vibrational properties of materials has applications across all of chemistry, from its use in infrared spectroscopy to creating better semiconductors for building solar cells. Here, the phonon behaviour of MgO is simulated using the general utility lattice program (GULP) and used to find the Helmholtz Free Energy and the thermal expansion coefficient of MgO. Taking into account the approximations made by GULP, computed values are compared to literature values yielded from practical experimentation (-ray attenuation, for example) and hence the limitations of GULP are explored.
Thermodynamic properties of MgO are explored here by consideration of vibrational behaviour through two different types of calculation - molecular dynamics (MD) and density of state (DOS). These methods both make use of the quasiharmonic approximation. The quasiharmonic approximation is used here because it allows for expansion, whereas the harmonic approximation does not. The harmonic approximation does not allow for expansion of solids because the result is a centrosymmetric parabola - it oscillates about a non-changing central point and does not consider bond dissociation. The quasiharmonic approximation incorporates thermal expansion and bond dissociation. The harmonic approximation also exhibits single-branch behaviour because all vibrations are of the same frequency, as all energy gaps between vibrational energy levels are the same. In phonon dispersion plots using the quasiharmonic approximation, we see several branches because vibrations at different frequencies are allowed. The quasiharmonic approximation allows for gaps between vibrational energy levels to become smaller as the energy is increased, so at higher temperatures materials are observed to behave classically[1]..
The concept of reciprocal space is used in this work in order to determine how large a shrinking factor is needed when making density of states calculations. The reciprocal space is the space in which k operates to describe the energy of vibrational modes[2]. Rather than drawing out distinct energy levels, a continuous line is drawn between values of 0 and , as mathematically this is the only range in which there are unique values of k and they do not repeat[2]. The reciprocal space may be 'folded' depending on the size of the primitive cell via the equation . The larger the primitive cell, the more atoms are involved in it and therefore the more degenerate vibrational states are present at a point. Therefore, the graph of E(|k|) versus k can be 'folded' so that degenerate states lie in the same space[2]. However, in practice, the points thought to be degenerate are not always perfectly so and this is how acoustic and optical bands are formed in a phonon dispersion chart. Hence for more complex structures, it is seen that a smaller shrinking factor is needed due to greater folding, as the reciprocal space being sampled is smaller.
The two types of calculation explored are DOS and MD. Density of state calculations sample an area of the reciprocal space at a particular symmetry point and calculate how many branches are at particular frequencies at that point. The DOS calculations tend to become less reliable at high temperatures because they do not consider anharmonicity. MD calculations work by moving one atom at a time, observing how this changes the overall structure, and then moving another as an optimisation until energy becomes constant. This is why a supercell is needed for MD, as the effects of motion of one atom on others surrounding it need to be measured. MD calculations tend to fail at low temperatures because they do not consider quantum mechanical effects such as zero-point motion[1].
These techniques and theory are utilised in this experiment in order to determine the thermodynamic properties of Helmholtz free energy and thermal expansion coefficient of a crystal of MgO.
Methods
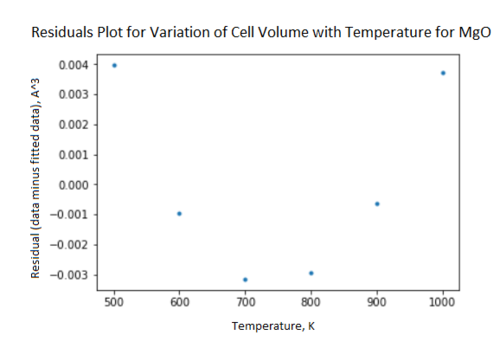
The General Utility Lattice Program (GULP) was used in the Linux RedHat environment to calculate physical properties of MgO crystals. For all calculations, the ionic.lib force field was used, which gives the Mg a charge of +2 and the oxygen a charge of -2 and a simple potential exists between them. Phonon dispersion curves for MgO were obtained, along with density of state (DOS) plots at different shrinking factors. This was done by loading a conventional MgO cell into the dlv program, and using GULP to calculate the dispersion curve with number of points = 50 and phonon eigenvectors calculated. DOS plots were obtained at shrinking factors ranging from 1x1x1 to 32x32x32. The optimal shrinking factor for a conventional MgO cell was found by calculating the DOS at a shrinking factor of 32x32x32 and temperature of 300 K and finding the Helmholtz Free Energy calculated with these parameters. Keeping temperature constant, the shrinking factor was gradually decreased until the Helmholtz Free Energy was not the same as it was at 32x32x32. This method yielded an optimal shrinking factor for MgO of 18x18x18. The symmetry point at which the DOS was calculated was deduced by comparing the number and intensity of peaks on the DOS plot to the number of branches at each symmetry point on the dispersion plot. It was found that GULP was using the L-point to calculate DOS from. The thermal expansion of MgO was then investigated and the results of running DOS calculations and molceular dynamics (MD) calculations were compared. DOS calculations to work out the thermal expansion of MgO were run at temperatures between 100 K and 1000 K in steps of 100K with the 'optimise Gibbs free energy' option selected. The .out files were inspected to find values of Helmholtz Free Energy and cell volumes at different temperatures. Plots of Helmholtz Free Energy against time and cell volume against time were generated in the Python Jupyter Notebook interface (fig. 10 fig. 11). A linear fit of cell volume against temperature was generated using the polyfit function in the numpy package with degrees of freedom = 1. However, a residuals plot analysing this plot was also generated and a clear trend in the position of the residual data point was observed, indicating a poor fit and that the trend was actually curved. The residuals plot was generated by plotting (volume data points - volumes calculated using fit) against temperature (fig. 12). The thermal expansion was then investigated using MD calculations at the same range of temperatures and the results for cell volume were plotted against temperature in Python and fitted using the polyfit function in the same way as for the DOS data (fig. 13). For the MD calculations a 32x32x32 supercell of MgO was used, number of molecules, temperature and pressure were set to be constant, temperatures were set in the range 100-1000 K as previously stated, equilibration and production steps were set to 500, sampling steps and trajectory write steps were set to 5 each and the ionic.lib force field was used. The expansion coefficients for the DOS and MD calculations were found to be 3x10⁻⁵ K-1 and 2.97x10⁻⁵ K-1 respectively using the following formula:
where
is the gradient of the fitted line
is the volume of the cell at 0 K
and is the expansion coefficient.
When selecting values of cell volume from the .out files of the MD calculations, it was found that the temperature fluctuated with each equilibration step by about 20oC.
Calculating Phonon Modes of MgO
Calculating Phonon Modes of MgO at 0K
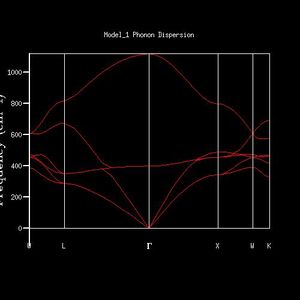
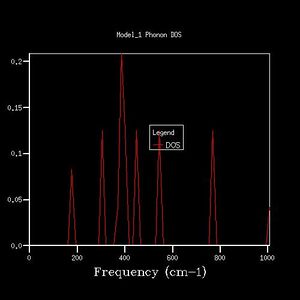
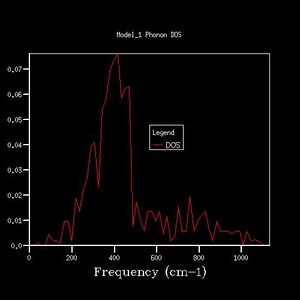
The K-point that the DOS was computed for was deduced by inspection of the phonon dispersion curve and the DOS plot (fig. 1, fig. 2). The DOS plot shows two peaks with double degeneracy at 286 cm-1 and 351 cm -1, and two peaks that are singly degenerate at 676 cm -1 and 806 cm-1. When compared to the dispersion plot it is seen that at the L-point there are two single bands at 676 cm -1 and 806 cm-1, two degenerate bands at 286 cm-1 and two degenerate bands at 351 cm -1. Therefore, the DOS plot was computed at the L-point.
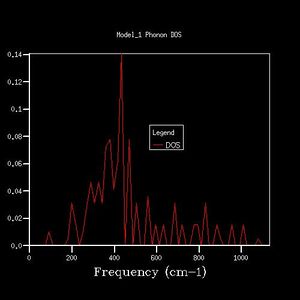
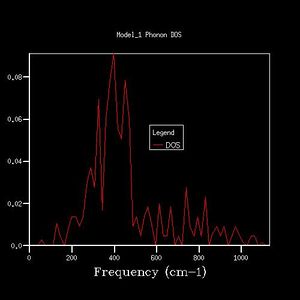
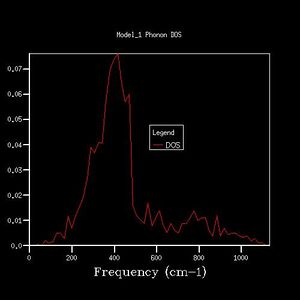
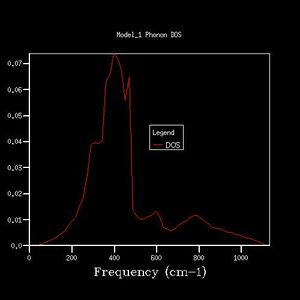
As grid size increases, the DOS plot becomes a smoother curve with less distinct separate curves, and the frequency at which the majority of branches lie is able to be determined. This is illustrated in figures 2-7. In figure 2 where the shrinking factor is only 1x1x1, there are four distinct peaks, two doubly degenerate and one singly degenerate. This does not give any indication as to where the majority of branches lie. As the shrinking factor is increased, a curve emerges and it is seen that the maximum corresponds with the region in the phonon dispersion chart in which the majority of branches lie (Fig. 9).

The minimum shrinking factor for a DOS plot is deduced by considering how smooth the plot is as this means more points along the branches are being sampled, the time taken for the plot to be computed and also the point at which the frequency with the most branches passing through it converges. There is little point continuing to increase the shrinking factor once the maximum has converged because it means that precise point on the plot has already been measured - the 'grid' generated by the shrinking factor has passed through the maximum point where the most branches occur. For MgO, only a 16x16x16 shrinking factor is necessary as the maximum of this plot is at the same frequency value as the 32x32x32 DOS plot (396 -1), and the 32x32x32 shrinking factor made the calculation take much longer. At larger shrinking factors than this optimum, the calculation takes longer but the graph is smoother as more data is sampled. At smaller shrinking factors, the graph is less smooth and peaks are distinguishable. Also, as fewer data points were sampled, the point at which the maximum really lies is less likely to have been sampled, and therefore important data may be missed out on DOS plots with smaller shrinking factors.
Density of states plots are related to dispersion curves because the DOS plot describes the amount of branches present at a particular frequency. Therefore as the shrinking factor is increased and the plot becomes smoother and measures more data points along the dispersion curve, more information is revealed and a peak maximum emerges, revealing the frequency at which the branches collectively have the most data points.
Calculating Phonon Modes of MgO at 300K
As the grid size is increased (larger shrinking factor) the Helmholtz Free Energy converges to a single value. This is because there are more data points being sampled and therefore the value of energy becomes more precise. The optimum grid size was found to be 18x18x18 as this was the point at which the Helmholtz energy converged to 6 d.p. and was also the quickest calculation to run. This result was achieved by calculating the Helmholtz energy for the MgO crystal at 300K with shrinking factors ranging between 1x1x1 and 32x32x32. The value of Helmholtz energy was found to be -40.926843 eV with a shrinking factor of 32x32x32 and then the grid size was decreased gradually until the Helmholtz energy value changed to -40.926842 eV at a shrinking factor of 17x17x17. It was therefore deduced that the 18x18x18 grid is optimal.
It was found that a 2x2x2 grid was appropriate for Helmholtz energy accurate to 1 meV (-40.926609 eV). A 4x4x4 grid gave Helmholtz energy accurate to 0.5 and 0.1 meV (-40.926450 eV).
The optimal grid size of 18x18x18 may also be optimal for CaO because it has a similar structure to MgO, and therefore similar cell parameters as the symmetry is the same and therefore the shape and size of the unit cell is the same. The grid would need to be smaller for a more complex molecule such as a zeolite because the unit cell will be larger due to the complexity. Hence, there is more 'folding' and the reciprocal space is smaller therefore less points need to be sampled. For the elemental lithium, it is a much simpler molecule and therefore has a smaller unit cell. Hence, the reciprocal space is larger and more data points need to be sampled to get an accurate idea of the the behaviour of the phonon bands and hence to be able to calculate Helmholtz free energy. This relation is described by the following equation: , where a* is the size of the reciprocal space and a is the cell parameter.
The Thermal Expansion of MgO
Variation of Helmholtz Free Energy with temperature is seen to be a non-linear decrease, with the rate of decrease of Helmholtz energy increasing with temperature (fig. 10). The Helmholtz Energy decreases more rapidly with increasing temperature because the quasi-harmonic approximation allows for the expansion of the solid and the Helmholtz free energy is dependent on the change in volume yielded by this since pressure, temperature and entropy are constants.
In the harmonic approximation, the amplitude of all vibrations remains constant regardless of their frequency and the gap between all the vibrational energy levels is the same. In the quasi-harmonic approximation, the amplitude of the different vibrations may be different from each other and the energy gaps between the different energy levels decrease as energy increases. Therefore in the quasi-harmonic approximation thermal expansion of solids is allowed because there are different amplitudes of vibration available and at higher temperatures the molecule can access higher vibrational frequencies which have higher amplitudes, so at higher temperatures more vibrational states with larger amplitudes are occupied. Therefore as the volume increases with increasing temperature, the Helmholtz free energy is seen to decrease with temperature.
A line of best fit was plotted on the cell volume against temperature plot (fig. 11) using the polyfit function in the numpy Python package. This line was used to calculate the thermal expansion coefficient, however it must be recognised that the fit is poor. The residuals plot shows a clear trend, hence the fit is not a good one as the fit is linear and the plot itself is nonlinear. Were the fit a good one, there would be an even distribution of points about zero. In a practical experiment, the value of the expansion coefficient () would be constant only at temperatures > 1000 K, however, due to the limitations of GULP in that anharmonic contributions to vibration are ignored, calculations couldn't be performed at these temperatures. According to C. J. Engberg and E. H. Zehms[3], is non-constant at room temperature, and hence this supports the GULP calculations at these lower temperatures because the graph is curved and since depends on the gradient, it is non-constant and cannot be linearly interpolated.
The following equation was used to calculate the expansion coefficient:
.
The gradient of the graph (fig. 11) is .
The gradient of the graph was found using the polyfit function. This quantity is equal to .
Therefore the gradient of the graph divided by is the thermal expansion coefficient, . was found to be 3.04x10⁻⁵ K-1.
This value of thermal expansion coefficient is smaller than one found in the literature. Madhusudhan and Narender conducted a -ray experiment to calculate the thermal expansion coefficient of MgO[4]. The coefficient using this method was found to be 4.0x10⁻⁵ K-1. This may be due to the approximations made by the GULP software or the fact that the fitted line used to calculate (fig. 11) was a poor fit.
The GULP software uses the quasi-harmonic approximation. It also assumes that less atoms surrounding one which is being moved are affected by this motion than they would be in reality. It uses a Hessian matrix to calculate thermodynamic quantities such as the Helmholtz free energy, however, it assumes that the contribution of free energy to this matrix itself is negligible and therefore only calculates the matrix using internal energy to simplify the process.
As temperature increases structure, the GULP software becomes less reliable[5]. This is due to the calculations running by minimisation of free energy, and in this process anharmonic vibrational effects are ignored, which become more evident as temperature increases. The approximation becomes unreliable as the temperature exceeds half the melting point of the substance in question (in this case, MgO)[5] [1].
There is no expansion in the harmonic approximation because there is no change in phonon amplitude allowed. The change in amplitude is what allows the thermal expansion of solids to be modeled and calculated.
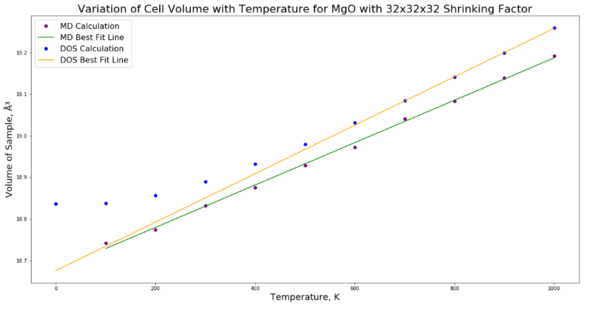
The thermal expansion predicted by molecular dynamics calculations is smaller than that predicted by the quasi-harmonic approximation. It should be noted that whereas quasi-harmonic approximations are less reliable as temperature increases, the opposite is true for molecular dynamics. At lower temperatures the calculated values deviate more from reality because they do not take into account quantum mechanical effects such as zero-point motion[1].
For the quasi-harmonic approximation a conventional cell (4x4) was used to calculate a value for Helmholtz free energy. However, for molecular dynamics a supercell (32x32) was used. This is because the molecular dynamic calculations work by moving each atom in the cell at a time and measuring and accumulating the effects. In a primitive or conventional cell, the motion of a single atom will affect all the other atoms in the cell. In the supercell a atom can be moved in one primitive cell within the supercell and others will be left unaffected. It is acceptable to use the conventional cell for the quasi-harmonic approximation because it depends on all the atoms in the cell vibrating.
At high temperature in the quasi-harmonic approximation the cell volume becomes more erratic and deviates further from reality because the prevalent anharmonic effects are ignored. At high temperature for the molecular dynamic method, the measurements become more reliable because the calculation ignores quantum mechanical effects, which are less important as temperature increases because a substance will begin to exhibit classical behaviour.
Conclusions
It is seen from the results of the DOS and MD calculations run by GULP that the two methods yield different results due to their different constraints and approximations made. It is also evident that neither value of calculated will be accurate when compared to literature regarding practical experimentation because at temperatures lower than 1000 K, the value of is not constant, and hence the MD calculations, which yield a linear plot, are inaccurate at these temperatures[3]. Additionally, the equation used to fit the trend of the DOS result was not good because the graph was nonlinear. A constant value of could be obtained at higher temperatures, but DOS is not reliable at those higher temperatures because it does not account for anharmonicity.
MD calculations at temperatures > 1000 K could be carried out for further study to obtain a constant value of to compare to literature. Further reviewing of different literature values of derived from different practical experiments could be further reviewed to try and understand why such a range of values are present in the literature.
References
- ↑ 1.0 1.1 1.2 1.3 J.D. Gale, General Utility Lattice Program Version 4.3, Nanochemistry Research Institute, Curtin University, 2014
- ↑ 2.0 2.1 2.2 H. Roald, Angewandte Chemie International Edition, 26, 1987, 846-878
- ↑ 3.0 3.1 C. J. Engberg, E. H. Zehms, Journal of the American Ceramic Society, 42, 1959, 300-305
- ↑ A.S. Madhusudhan Rao, K. Narender, Journal of Thermodynamics, 2014, 2014
- ↑ 5.0 5.1 J.D. Gale, A.L. Rohl, Molecular Simulation, 2003, 29,291-341

