Rep:Dc3415year3mgolab
Calculating the thermal expansion of MgO crystal
Abstract
The thermal expansion coefficient of the MgO crystal at 300K was calculated using two separate methods, the Quasi-harmonic approximation and Molecular Dynamics. The experiments were performed computationally using the GULP package in DLV visualiser in the Red Hat Linux environment. A single MgO lattice cell was used for the quasi-harmonic approximation and a 32 lattice supercell was used for MD. The two methods produced very similar results. The calculated volumetric thermal expansion coefficient at 300K for the Quasi-harmonic approximation was 2.81279x10⁻⁵ K-1 and for molecular dynamics 2.94202x10⁻⁵ K-1. The results obtained are in close agreement with those in literature.
Introduction
Many models have been developed over the years for scientists to try and explain the behaviour of solids. The volume-dependent thermal properties of the solid lattice such as the volumetric thermal expansion coefficient[1][2], isothermal bulk modulus[1][2], thermal conductivity[3] and heat capacity[1] are of particular interest. Several classical mechanical models can be used to calculate these properties in computational chemistry and physics. The Quasi-harmonic approximation, which is a temperature dependant adaptation of the temperature-independent classical harmonic oscillator and Molecular dynamics simulations[1] are the two methods that were used in this experiment. Both methods use classical mechanics to calculate the crystal properties and they are often coupled with quantum mechanical corrections[1] which are not accounted for in classical models, hence improving the calculation. In this experiment, the Quasi-harmonic approximation and Molecular dynamics simulations were used to calculate the volumetric thermal expansion coefficient of an MgO crystal and compare the results obtained from each of the 2 methods.
The GULP[4] method in DLV uses classical mechanical simulations to calculate the crystal properties in question and allows for the use of different models including the ones mentioned above. The Ewald summation method is used by GULP in order to calculate long-range interactions in the reciprocal space. In the real space, these interactions are short-range interactions as seen in equation 2. Another popular method for the calculation of ionic interactions is direct summation[5], however Ewald summation will converge much more quickly[6] and is compatible with both methods used in this experiment[6] hence it is used preferentially.
In the Quasi-Harmonic approximation, unlike in a diatomic molecule with a harmonic potential, raising the temperature will increase the equilibrium bond distance. The classical harmonic oscillator model is independent of temperature therefore it cannot be used to predict the thermal expansion of a solid since it assumes a constant vibrational energy contribution at all temperatures. The Quasi-Harmonic approximation assumes that as the material expands, the lattice constants remain harmonic. In other words, the bond still behaves harmonically however its equilibrium bond length changes when new vibrational states become occupied, introducing a temperature dependence to the model. Since the lattice parameter varies depending on the occupied vibrational states i.e. the density of states is now allowed to vary with temperature[7], the frequency of the phonons will depend on the volume of the lattice, hence including some anharmonic contribution[7] to the model, allowing the calculation of solid properties that arise as a result of volume and temperature like the thermal expansion coefficient.
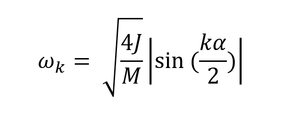
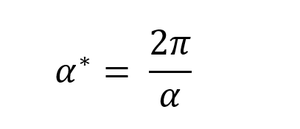
The term phonon refers to vibrations or particles when talking about vibrational energies. For the Quasi-harmonic approximation calculations, the lattice energies are calculated for a number of k-points in the reciprocal space with k-points being in the range 0<k<π/α. k behaves as a sinusoidal wave in the real space according to equation 1 but is a single point in the reciprocal space of the 3D crystal with coordinates (kx, ky, kz). The relationship between the real and reciprocal space lattice spacings is given by equation 2, where α is the lattice spacing in the real space and α* is the lattice spacing in the reciprocal space. Only points between 0 and π/α are used since at points greater than π/α, the sine function will repeat itself, producing no new frequencies. The region between 0 and π/α is referred to as the first Brillouin zone[8] of the reciprocal space.
 |
 |
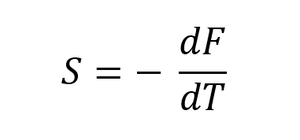
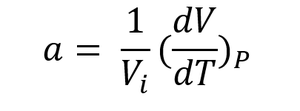
The Quasi-harmonic approximation allows the calculation of the vibrational Helmholtz free energy[7] (F) of the crystal by summing all of the frequencies at all points of k in the reciprocal space according to equation 3, where the first two terms are internal energy terms, corresponding to the zero point energy and the sum of all vibrational contributions to the internal energy and the last term is a temperature-dependent entropic term where entropy is expressed as vibrational entropy, assuming there are no other degrees of freedom contributing to it, as shown in equation 4[7]. By varying the temperature, the thermal expansion coefficient can be calculated according to equation 5.
In contrast, molecular dynamics calculations use Newton's Laws of motion[1] shown in equation 6 and optimise the structure through a series of equilibration and production steps. This means that instantaneous values of time-dependent properties such as lattice volume and lattice parameters can be obtained for every set amount of sampling steps as well as the average values of these properties. The atoms are treated as charged spheres on a spring and the motion of the ions relative to each other is observed in each timestep. This time dependence is what makes the process dynamic, introducing many degrees of freedom to the calculation making it computationally demanding.

The calculations performed by each method justify the use of different systems to obtain the thermal expansion coefficient. The system that was used during the study of thermal expansion for the Quasi-harmonic approximation was a single lattice cell of MgO, whereas for molecular dynamics a supercell consisting of 32 MgO lattice cells was used. Since the molecular dynamics depend on the motion of the ions in the lattice for a given timestep with respect to the rest of the structure, a large number of lattice cells are required in order to be able to calculate these interactions accurately. If a very small cell is used, the calculations will not give the correct result due to the small sample size but at very large cells, the calculations become very complicated and will run for a long time as a result of the many degrees of freedom in the lattice.
Experimental
For all the calculations described below, the following settings were applied for the potential parameters in GULP: The ionic.lib potential was selected and the Include Shells option was disabled. All the calculations were ran at a pressure of 0 kPa.
Calculation of phonon dispersion curves
The phonon disperison curves for a single lattice cell of MgO were calculated for 50 k-points using the Phonon Dispersion option in GULP with the Calculate Phonon Eigenvectors option selected. The calculations were performed at 0K temperature.
Density of states (DOS) calculations
The Phonon DOS option was used in GULP in order to obtain the DOS with the following shrinking factors shown in Table 1:
| a | b | c | number of k-points sampled |
|---|---|---|---|
| 1 | 1 | 1 | 1 |
| 2 | 2 | 2 | 4 |
| 3 | 3 | 3 | 18 |
| 4 | 4 | 4 | 32 |
| 8 | 8 | 8 | 256 |
| 16 | 16 | 16 | 2048 |
| 32 | 32 | 32 | 16384 |
| 64 | 64 | 64 | 131072 |
The calculations were performed at 0K temperature.
Quasi-Harmonic approximation
Helmholtz Free energy
Quasi-harmonic calculations of the Helmholtz free energy (F) were performed as described in the section Density of states (DOS) calculations, but setting the temperature at 300K. The free energy was recorded for each of the grid sizes and the convergence was examined to determine the optimal grid size.
Gibbs free energy optimisation
The optimisation function from GULP was used in order to optimise the Gibbs free energy of the MgO crystal. The Phonon DOS was also selected during these calculations with a grid size of 32x32x32. The temperature was varied from 0K to 1000K in increments of 100K and from 1200K to 2800K in increments of 200K.
Molecular Dynamics
Molecular dynamics calculations were performed using the Molecular Dynamics option in GULP. Table 2 below summarises the simulation parameters:
| Parameter | Setting |
|---|---|
| Ensemble | NPT |
| Timestep (fs) | 1.0 (for simulations 100K-1000K), 0.7 (for simulations 1200K-3000K) |
| Equilibration steps | 500 |
| Production steps | 500 |
| Sampling steps | 5 |
| Trajectory steps | 5 |
The temperature was varied from 100K to 1000K in increments of 100K and from 1200K to 3000K in increments of 200K.
Results and discussion
Phonon dispersion and DOS
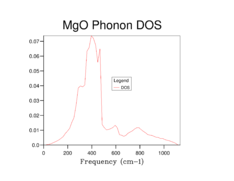
The phonon dispersion curves and the DOS plots for the different grid sizes are shown below:
 |
 |
 |
 |
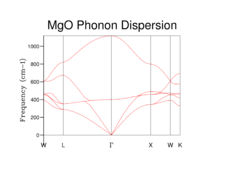
The phonon dispersion curve (Figure 1) shows 6 lines (2 atoms in 3D), with the 3 lines which have 0 frequency at the origin being acoustic branches and the 3 lines with a non-zero frequency at the origin (Γ) being optic branches. 6 lines appear since it is a diatomic lattice with one oxygen and one magnesium ion in each. At k=0, the ion pairs in the acoustic branch vibrate in the same direction, hence there is no net change in the equilibrium bond position and the frequency of the vibration will be 0. In the optic branch, the ion pairs vibrate in such a way that the interionc distance decreases, causing the elongation of bonds between other ion pairs. As the ions vibrate away from the equilibrium bond distance, the vibrational frequency increases resulting in the high frequency at the origin. The acoustic branch is said to "run up"[8], as the vibrational frequency increases with increasing the value of k and the optic branch is said to "run down"[8] as the vibrational frequency decreases with increasing values of k. This is because as k approaches the upper limit (π/α), the ion pairs in the acoustic branch will vibrate in opposite directions, resulting in an increase in the vibrational frequency and ion pairs in the optic branch vibrate in opposite directions in alternation, meaning that some of the ions will maintain their equilibrium bond distance, resulting in a lower vibrational frequency for the band. The vibrational energy levels are quantised and therefore are discontinuous in reality but due to the small energy gap between vibrational states, the branches appear to be continuous.
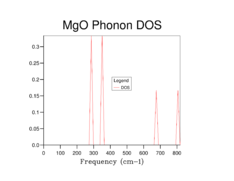
The phonon dispersion curve shows how the vibrational frequency varies as a function of a set of k-points in the reciprocal space. The density of states gives the relative population of vibrations with a certain frequency for a set of k-values. Since k is a wavevector in the real space, the DOS therefore expresses the number of frequencies with a wavevector equal to a value of k in real space. Therefore for a given k-value one can determine the vibrational frequency and the number of frequencies it produces by examining the phonon dispersion curve and then produce a DOS plot by repeating the process for all k-values. In other words, a DOS is a "count" of k-values that produce vibrations of a given frequency, expressed as a relative population by dividing by the total number of frequencies in the crystal.
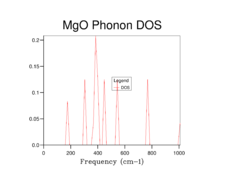
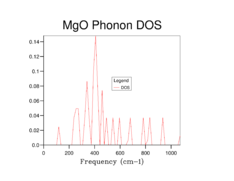
By observation of the DOS plots it can be seen that as the grid size increases, the number of vibrational states populated also increases. At lower grid sizes (between 1x1x1 and 8x8x8) (figures 2-6) individual peaks are observed rather than a continuum of vibrational frequencies but as the grid size becomes larger, the density of states becomes "smoother" as more vibrational states become populated. There is a decrease in the relative population of states which are highly populated at lower grid sizes when the grid size is increased. This is because when the grid size is increased, the weighing coefficient of each k-value decreases and more vibrational modes are now accessible and populated. Since there is a fixed number of vibrations due to the fixed number of ions in the lattice the relative population of highly populated states is expected to decrease with increasing grid size.
When a grid size of 1x1x1 is used, a single point in k-space is sampled. By observation of the populated frequencies in the DOS plot it can be seen that these four frequencies can be found at the special point L in the phonon dispersion plot which corresponds to the centre of a hexagonal face of a FCC lattice[9]. This was confirmed by checking the output file for the calculation which has the cartesian coordinates of the k-point set at 0.5 in all three dimensions. Therefore the values of the wavevector k in real space would be π/α in all 3 dimensions.
At a grid size of 16x16x16 (Figure 7), the density of states becomes continuous rather than separate peaks, however features of individual peaks such as the peak points of the peaks are still observed. This is the absolute minimum grid size for a reasonable DOS approximation as now most of the vibrational states have been occupied. At lower grid size, there are inadequate sampling points to obtain an accurate repersentation of the DOS as not all of the frequencies are observed while vibrational frequencies with high populations are overpopulated. At grid sizes higher than 16x16x16, a DOS with a smoother distribution was obtained, particularly for the 64x64x64 grid size (Figure 9), hence giving a better picture of the DOS. This however came at the cost of longer calculation times. The difference in calculation times between the 16x16x16 and 32x32x32 was relatively short (a few seconds) however for the 64x64x64 grid size the calculations became significantly longer (calculation times increased by 10 minutes). Therefore it was sensible for a 32x32x32 grid to be used in the Quasi-harmonic energy calculations.
A similar grid size to the one used here could be used for a CaO crystal which has similar size to MgO hence it will have a similar reciprocal space. Since the distance between atoms in reciprocal space (α*) is inversely proportional to the distance between the atoms in real space (α) as shown in equation 2, a larger crystal, such as zeolite will be expected to have a smaller reciprocal space, hence a smaller grid such as 16x16x16 or 8x8x8 could be sufficient to produce an accurate representation of the DOS in the crystal. Similarly, a material with a smaller atomic distance, such as lithium metal would require a larger grid to adequately sample its larger reciprocal space and obtain an accurate DOS.
Helmholtz Free energy calculations
Free energy calculations were performed for all the grid sizes listed in the experimental section with a temperature of 300K. Table 3 summarises the free energy findings as well as the convergence:
| Grid size | Helmholtz Free energy / eV | Convergence / meV |
|---|---|---|
| 1x1x1 | -40.930301 | - |
| 2x2x2 | -40.926609 | 3.692 |
| 3x3x3 | -40.926432 | 0.177 |
| 4x4x4 | -40.926450 | -0.018 |
| 8x8x8 | -40.926478 | -0.028 |
| 16x16x16 | -40.926482 | -0.004 |
| 32x32x32 | -40.926483 | -0.001 |
| 64x64x64 | -40.926483 | 0.000 |
The free energy becomes less negative as the grid size increases from 1x1x1 to 3x3x3 with large convergence. Moving to 4x4x4x and 8x8x8, there is a reduction in the free energy by -0.018 meV and -0.028 meV respectively and at higher grid sizes convergence is little to none. For small grid sizes, a large convergence is expected as many new frequencies result from the new k-points sampled in the reciprocal space and will make a large contribution to the internal energy term, hence the Helmholtz Free energy. As the lattice size is increased, very small changes are observed in the reported energy since the contribution of each new vibration to the internal energy would be small due to the large sample size.
The choice of grid size to be used in calculations depends on the required accuracy of the result. An accuracy of 1 meV can be achieved by using a 2x2x2 cell since there is only a 0.177 meV convergence when moving from 2x2x2 to 3x3x3 grid. A 3x3x3 grid could suffice an accuracy of 0.5 meV and a 4x4x4 grid can be used to obtain an accuracy of 0.1 meV.
Quasi-harmonic approximation and Molecular Dynamics
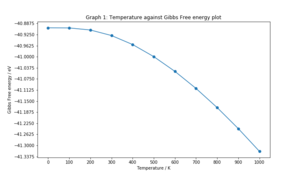
The Free energy against temperature, lattice constant against temperature, and volume against temperature plots for the Quasi-harmonic approximation for temperatures in the range of 0K to 1000K are shown below:
 |
 |
 |
The Gibbs free energy becomes increasingly negative as the temperature increases. At low temperatures, the relationship is non-linear, plateauing at -40.9019 eV, which is the free energy at 0K. As the temperature increases above 300K, a linear plot is observed. The linear lattice parameter appears to increase with temperature in a similar way as the Gibbs free energy and so does the lattice volume. This can be explained using the Helmholtz free energy equation. At low temperatures, the entropic term will be small as very few vibrational states are populated, hence the energy is dominated by the zero point energy term, which is why these temperature dependent parameters all plateau to their respective values at 0K. As the temperature is increased, the vibrational entropy term becomes significantly larger than the zero point energy and this is observed as the linear part of the graphs.
By comparing the cell volume per formula unit at similar temperatures for Quasi-harmonic and MD calculations it can be concluded that the two approximations produce similar results for the region between 400K and 1200K. The molecular dynamics calculation returns slightly lower volumes than the Quasi-harmonic one however the two results are reasonably close (difference up to approximately 0.05 A3). When the temperature is lowered close to 0K or raised to higher than 1600K and up to around the melting point of the crystal, large differences in the calculated volume are observed. This is because of the assumptions that are used in each approximation. The Quasi-Harmonic approximation assumes that a bond will continue to behave harmonically with increasing temperature. As the temperature increases, higher vibrational levels will be occupied, so the atoms will be vibrating at higher frequency and the equilibrium bond distance will continue to increase without breaking the bond since it behaves harmonically. In reality, the bond will follow a Leonard-Jones potential curve and hence the bond will break at high vibrational frequencies caused by a high temperature. Therefore the Quasi-Harmonic approach will not provide a realistic prediction for the volume of the lattice at higher temperatures since the phonon modes do not represent the actual motion of the ions in the lattice. At temperatures near the melting point, Molecular Dynamics should be used instead.
The molecular dynamics prediction is a linear increase of the cell volume as a function of temperature. While a general linear trend is observed, there are several points in the region between 1400K and 3000K that do not follow the linear prediction. A smaller time step and perhaps a larger number of equilibration steps must be used to give a better calculation of the cell volume that will fit the expected trend. Molecular Dynamics assume a purely classical approach. As the temperature is increased, the kinetic energy of the atoms will increase as well. For a given timestep, the atom motion with respect to others in the crystal is observed. Because of this, MD calculations are often long, as there are many degrees of freedom, and a large enough crystal cell is needed in order to accurately perform the calculations and include all the possible atom motions. The cell size used for the calculations will once again depend on the required accuracy of the results. Cells of several sizes can be used to perform MD calculations on and calculate the convergence in the energy as a result of increasing cell size. The optimal cell size can then be determined by choosing a cell that will provide the desired accuracy but at the same time will be the most time and cost economic in terms of the calculations that need to be performed.
The thermal expansion coefficient was computed at 300K for both methods by using equation 5, where Vi is the volume at 300K and dV/dT is the gradient obtained by performing a linear fit of the cell volume against temperature plot for the range of temperatures between 300K and 1000K. The thermal expansion coefficients obtained were 2.81279x10⁻⁵K-1 for the Quasi-harmonic approximation and 2.94202x10⁻⁵K-1 for the molecular dynamics calculations. Since both methods produce relatively similar results for the cell volume, the volumetric thermal expansion coefficients are also similar for both methods. The results obtained from the calculations were very close to the ones in literature at the same temperature (300K), with values of 2.88x10⁻⁵K-1 [1]and 23.9x10⁻⁶K-1 [2].
As the two methods use different approximations as explained above it is expected that they would produce a different result. The MD calculation predicts a slightly higher thermal expansion coefficient than the Quasi-harmonic approximation. The difference in the two results also originates from the temperature dependance of the two methods. In the Quasi-harmonic approximation, the temperature is assumed to be constant and therefore has a fixed contribution to the free energy and the lattice parameters of the crystal. In molecular dynamics, the temperature varies in each step and equilibrates as the simulation proceeds by averaging the individual steps, hence providing a more realistic and accurate motion of the ions in the lattice.
The thermal expansion arises from the fact that as the temperature is increased, higher vibrational energy levels will become populated, resulting to a larger equilibrium distance between the ions in the lattice. Since the distance between the ions increases, the crystal will expand, increasing the length of its lattice parameters and hence its volume.
Conclusion
Quasi-harmonic approximation calculations and molecular dynamics simulations using the GULP package in DLV allowed for the calculation of the thermal expansion coefficient in the MgO crystal. Density of states and free energy calculations were initially performed at varying grid sizes from 1x1x1 to 64x64x64, before running the thermal expansion calculations using a grid size of 32x32x32, sampling 16384 k-points in the Brollouin zone. The thermal expansion coefficient at 300K was found to be 2.81279x10⁻⁵K-1 when the QH approximation was used and 2.94202x10⁻⁵K-1 when MD was used. Comparison with literature data[1][2] revealed that the calculated values were very similar, adding confidence to the accuracy and precision of the results, confirming that both models are very good at predicting the thermal expansion coefficient at 300K. The two methods produced similar results for the range of temperatures between 300K and 1000K however the two models showed significant variation in the calculated parameters when temperatures near absolute zero or near the melting point of the crystal were used. This was attributed to the difference of the two methods due to their approximations, with QH assuming the bonds between atoms behaving harmonically and the MD calculating the change in the position of the atoms at every timestep as a result of their interaction with other atoms in the lattice. It has been concluded that at very low temperatures, the Quasi-harmonic approximation is a good approximation as the free energy plateaued at the zero point energy whereas the molecular dynamics produced a linear behaviour. At high temperatures, the Quasi-harmonic approximation breaks since after a given temperature, the atoms in the bond will vibrate at a very high frequency, causing the bond to break. This is not accounted for in the approximation, hence the model is not ideal for calculations at high temperatures.
The experimental results could be improved by performing some quantum mechanical correction[1] to the values obtained for the thermal expansion coefficient since both of the methods rely on classical mechanics and do not account for any quantum mechanical behaviour of the crystal that results in a better calculation of properties such as the thermal expansion coefficient than the one predicted by classical mechanics. Quantum mechanical calculations however are often very long and require a higher processing power to run that could drive up the cost of the calculations.
References
- ↑ 1.0 1.1 1.2 1.3 1.4 1.5 1.6 1.7 1.8 M. Matsui, J. Chem. Phys., 1989, 91, 489.
- ↑ 2.0 2.1 2.2 2.3 D. G. Isaak and R. E. Cohen, J. Geophys. Res., 1990, 95, 7055–7067.
- ↑ F. Clayton and D. N. Batchelder, J. Phys. C, Solid State Phys., 1973, 6, 1213–1228.
- ↑ J.D. Gale, J. Chem. Soc., Faraday Trans., 1997, 93(4),629-637
- ↑ A. Gellé and M. B. Lepetit, J. Chem. Phys., 2008, 128, 244716.
- ↑ 6.0 6.1 B. A. Wells and A. L. Chaffee, J. Chem. Theory Comput.,2015, 11, 3684–3695.
- ↑ 7.0 7.1 7.2 7.3 M. A. Blanco, E. Francisco and V. Luaña, Comput. Phys. Commun., 2004, 158, 57–72.
- ↑ 8.0 8.1 8.2 R. Hoffmann, Angew. Chemie-International Ed. English,1987, 26, 846–878.
- ↑ B. D. Wilts, K. Michielsen, H. De Raedt and D. G.Stavenga, J. R. Soc. Interface, 2012, 9, 1609


