Rep:DR1615MgO
Introduction & Method
DLVisualize was used as the interface for the molecular modelling code GULP (General Utility Lattice Program). The code was used to model the interactions in a MgO crystal. MgO is an ionic solid with a face centred cubic crystalline structure. Both Mg and O are in octahedral environments with 6 ions of O to 1 ion of Mg and 6 ions of Mg to 1 ions of O.
Lattice dynamics simulation in GULP used to calculate the vibrational energy levels of the system. This was then used to obtain the free energy of the crystal and predict how temperature affected the crystal. Later a second simulation, Molecular Dynamics, was also used to predict the affect of temperature on the crystal.
The whole experiment was done in 4 parts. The first 3 parts were for the lattice dynamics simulation and the last one for molecular dynamics. In the lattice dynamics simulation first the phonon modes of MgO was computed, then the free energy calculated in the quasi-harmonic approximation and finally the structure of MgO was optimised at different temperatures with respect to free energy. In the molecular dynamics simulation, the runs are carried out with 32 units of MgO in a cell, since doing similar steps of LD to figure out what number of units of MgO is needed would be too computationally taxing.
The data from both of these simulations are compared to see which simulation works better when. MgO expands in a linear fashion in the region 700-1300 K and non-linearly below and above these temperatures. Thermal expansion coefficient calculated as 3.45075x10⁻⁵ for LD and 3.06916x10⁻⁵ for MD.
Results and Discussion
Lattice dynamics
Computing the phonons
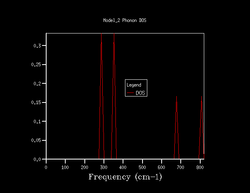
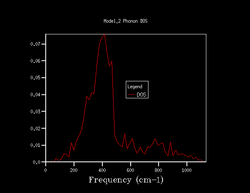
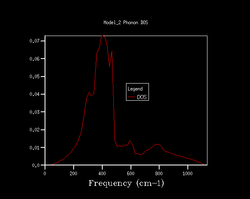
Quasi-harmonic approximation is used to find how the shrinking factor of the system affects the Density of States (DoS) of the system. 7 different shrinking factors are usedː 1, 2, 3, 4, 10, 25, 50. The DoS of these are shown below in figure 1.
| Shrinking Factor 1 | Shrinking Factor 2 | Shrinking Factor 3 | Shrinking Factor 4 |
|---|---|---|---|
 |
 |
 |

|
| Shrinking Factor 10 | Shrinking Factor 25 | Shrinking Factor 50 | |
 |
 |

|
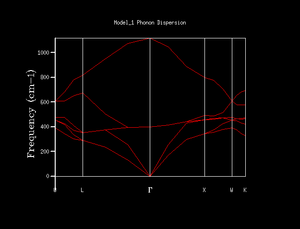
The DoS for the shrinking factor 1 was computed only for a single k-point. By inspecting the log file for this computation it was seen that the k-point computed was at 0.5, 0.5, 0.5. Additionally the frequencies populated were 288.49, 288.49, 351.76, 351.76, 676.23, 818.82 cm-1. This shows that the first two points are doubly degenerate, hence why in the DoS above the first two points are twice as intense as the last two point. Also by looking at figure 2 it can be seen that this k-point refers to L.
Increasing the shrinking factor meant that more k-points were computed which led to the calculation of a DoS of higher resolution. As the factor increases, more of the vibrations are sampled and produces a smoother and smoother curve. Comparing the DoS's of 25 against 50 showed very minimal difference but the time taken for the 50 was too long and hence a shrinking factor of 25 was used for the rest of the calculations. At 25 is when the curve is smooth enough for use which doesn't require a lot of processing power to get rid of the jagged features present for lower shrinking factors.
Computing the free energy
To corroborate the choice of shrinking factor qualitatively, the Helmholtz free energy of the system at 300 K for all shrinking factors used earlier were computed. The results can be seen in Figure 3 below.

|
It is observed that at a shrinking factor of 25 the energy has converged to -40.926483 eV which means the conclusion earlier to use shrinking factor 25 for the rest of the calculations. As the shrinking factor increases from 1 to 3 the free energy also increases from -40.930301 to -40.926432 which is already within 0.05 meV of the converged value (starts off being 3.9 meV off the final value). If calculations were to be run with a smaller shrinking factor then using 2 would have 1 meV accuracy, anything higher would give energy values accurate to 0.1 meV.
However, a shrinking factor of 25 will not work for all the solids in the universe. The shrinking factor will be different for different solids since the shrinking factor is dependent on the first Brouillion zone in reciprocal space (k-space). The first Brouillion zone is the primitive cell in k-space and is periodic. The periodicity is given by a*=2π/a where a is the lattice parameter of the solid. And obviously the parameter will change depending on the size of the lattice due to the size of the atoms that its made up of. From this fact we can assume that shrinking factor of 25 is probably appropriate for CaO as O2- will be the same size and Ca(II) will be about 30 pm bigger hence the lattice parameter should be similar. Whereas for Li metal the shrinking factor will definitely be different from 25 since the unit cell of it should be smaller given its ionic size meaning a higher shrinking factor will be needed. Faujasite clearly has a larger unit cell therefore a lower shrinking factor will give accurate results. The lattice parameter of these 4 areː MgO = 421 pm[1], CaO = 481 pm[1], Li = 349 pm[2], Faujasite = 2461-2513 pm[3]. This supports the point made above of how shrinking factor should change for each solid.
Thermal expansion of MgO
| Free Energies | Lattice Parameters |
|---|---|
 |

|
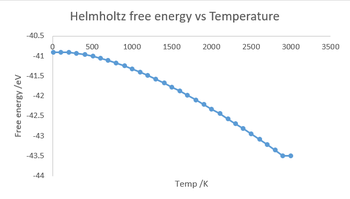
Figure 4 shows the graphs of free energy against temperature and lattice parameter against temperature. The computations were carried out at temperatures in the range of 0-3000 K for every 100 K.
Firstly the free energy calculations shows that at absolute zero there is still energy in the system in the form of zero point energy wherein which the each atom vibrates slightly at their equilibrium position. As the temperature increases to around 500 K, the free energy is dominated by the zero point energy and so the energy decreases (more negative) slowly. After this point the energy decreases faster and faster as the temperature goes up till 3000 K. This is because A=U-TS meaning the entropic contribution increases at higher temp hence free energy (A) becomes more negative. Also as temp increases from 0 K more and more vibrational states are occupied by the atoms. At 3000 K, which is close to the melting point of MgO, the free energy computed was the same as the value computed for 2900 K.
For lattice parameter calculations it is the opposite trend, increasing temperature increases the parameter. At low temperatures the increase in lattice parameter is slow compared to at higher temperatures (as earlier). The reasoning being the same as before where the atoms are vibrating in the equilibrium position for low temperatures and stay close to that initial lattice parameter. At higher temperature the atoms are gaining more and more kinetic energy which leads to, on average, a higher distance between the atoms and hence the increase in the parameter.
Also evidenced in the plots is the connection between free energy and lattice parameter, when one increases the other decreases.
The thermal expansion coefficient of MgO was calculated with the assumption that it is temperature independent for the linear region of the volume. The equation is given below.
The coefficient was calculated as 3.45075x10⁻⁵ in the range of 500-2000 K as the linear region. Comparison of this with values seen in literature (3.12x10⁻⁵ at 300 K and 3.84x10⁻⁵ at 500 K)[4] shows that the value calculated is close to either literature value. However, it is very obvious that the coefficient is not temperature independent given that volume increases non-linearly in figure 5 below over the whole range of temperatures.
Thermal expansion comes about due to the distance between atoms increasing as explained earlier. As temperature increases the lattice parameter increases and hence the volume since the atoms are gaining more kinetic energy. A diatomic molecule with an exactly harmonic potential would act in the same way where as temperature increases the vibration between atoms in the molecule increase and therefore the bond length of the molecule increases.
Molecular dynamics
|
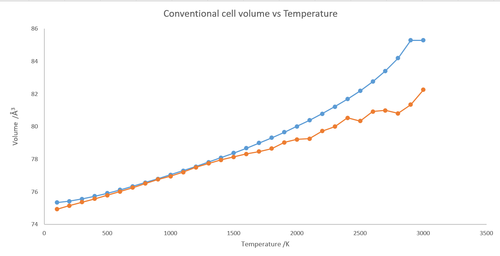
The above plot shows how the conventional cell volume changes over temperature for lattice dynamic (blue) and molecular dynamic (orange). Primitive cell volumes was computed by LD and converted to conventional by multiplying by 4 and super cell volumes computed by MD and converted by dividing be 8 to get conventional so that comparison of the two would be easy.The differences between the two plots are that for MD plot the line is pretty much linear the whole way through, it does fluctuate quite intensely at the end, and for LD it is essentially an exponential curve.
The coefficient calculated with MD is 3.06916x10⁻⁵ which is 4x10⁻⁶ off the value calculated for LD and below the values found from literature above. MD gives different answer to LD due to the fact the quantum mechanics isn't considered in MD simulation (only based on Newton's second law) and hence has a linear start and more anharmonic terms are needed for LD to show the affect on volume by temperature around MgO's melting point.
Both LD and MD values do agree with each other quite a bit for temperatures between 700 and 1300 K where the differences between the points are in the hundredths of Å3. It can be thought that around these temperatures the contributions from quantum mechanics and anharmonic behaviour to be very negligible and so the atoms behave in the classical manner.
Conclusion
DLVisualize software was utilised to probe the behaviour of MgO crystal. Two different types of simulations were usedː lattice dynamics and molecular dynamics. The shrinking factor was determined as 25 for the LD simulations which was the compromise between fast computations and accurate calculations. The dependence of temperature on the Helmholtz free energy, lattice parameter and volume were investigated from which the thermal expansion coefficient was calculated to be 3.45075x10⁻⁵. After which MD simulation was used to see which was better for computation. Both worked best around 700 to 1300 K range and below and above this range both of them start to deviate.
References
- ↑ 1.0 1.1 D.K. Smith, H.R. Leider Journal of Applied Crystallography, 1968, 1, 246
- ↑ K. Hermann, Crystallography and Surface Structure: An Introduction for Surface Scientists and Nanoscientists, Wiley-VCH, Weinheim, Appendix E
- ↑ J. J. Weitkamp, L. Puppe, Catalysis and Zeolites: Fundamentals and Applications, Springer-Verlag Berlin Heidelberg, 1999, ISBN: 978-3-540-63650-2
- ↑ O.L. Anderson, I. Suzuki, Journal of Geophysical Research, 1983, 88, 3549
