Rep:CfarnhamMgO
The Free Energy and Thermal Expansion of MgO
by Charlie Farnham
Introduction
The tendency of matter to change in volume in response to a change in temperature is termed thermal expansion and is a phenomenon prominent throughout both historical and modern-day science. [1] Willem Gravesande demonstrated this phenomenon with a wonderfully simplistic experiment, in which a room temperature brass sphere was passed through a ring of fixed diameter. This was then repeated but with the brass sphere now heated and unable to pass through the ring, due to thermal expansion. [2] The property was then exploited by the physicist Fahrenheit in 1714, with the insightful invention of the mercury-in-glass thermometer. [3] The device measures the thermal expansion of mercury along a temperature-graduated glass tube, in response to a change in atmospheric temperature.
The importance of understanding thermal expansion is evident and is exhibited in a variety of modern applications. A trivial example is overhead power lines, that droop in the hot summer months but are taught in cold weather conditions. Another instance is a component of bridge construction, aptly termed expansion joints. These allow continuous passing of traffic, whilst accommodating for the thermal expansion of a variety of materials used in the structure.
Thermal Expansion Coefficient
The volumetric coefficient of thermal expansion is given by the following equation:

It is defined as the fractional change in volume of a substance with an incremental change in temperature, at constant pressure.[4] The coefficient is an intrinsic property of a material and is normalised by dividing by the initial volume.
Each substance has its own unique thermal expansion coefficient, meaning that for a given temperature change each material will undergo a different change in volume. It should be noted, however, that not all substances expand on heating. Water, a familiar example, has a negative thermal expansion coefficient in the temperature range of 0 to 4 °C and actually experiences a contraction in volume for a given increase in temperature. [5]
Aims
In this experiment, an assumed perfect crystal of MgO with no defects and of infinitely large size was modelled. The volumetric, thermal expansion of the face centred cubic MgO lattice was simulated and investigated. Both the phonon dispersion curves and the phonon density of states were plotted for a range of grid sizes (1x1x1, 2x2x2, 4x4x4, 8x8x8. 16x16x16, 32x32x32 and 64x64x64) to probe for the optimal size. The optimal grid size was a compromise between accuracy, when compared to the real situation and computing time of an increasingly processing-intensive calculation. Essentially, the larger the grid size, the more accurate the simulation but the more time taken for the calculation to complete. The volume and Helmholts free energy of the MgO lattice were then calculated with simulations using the previously determined optimal grid size. Both the Quasi-Harmonic approximation and molecular dynamics calculations were then considered, allowing for the volumetric, thermal expansion coefficient of MgO to be determined.
Experimental
Computational Programs and Methods
- RedHat Linux
Linux is an alternative operating system that provides a useful environment for the numerical simulations involved in this experiment.
- DL Visualise
DL Visualise is a general purpose graphical user interface used for the visualisation of the MgO crystal structure and properties.
- General Utility Lattice Program
GULP is a general purpose code that performs calculations based on a system of atom-like hard spheres, instead of considering nuclei and electrons separately (the quantum mechanical approach). Since the atoms or ions possess opposite charges, imaginary, repulsive walls or Buckingham repulsive potentials are placed in between them to prevent the individual ions from collapsing into each other. [6]
Quasi-Harmonic Approximation
Lattice dynamics is the study of vibrations of atoms within crystals. The purely harmonic phonon approximation is not sufficient in describing the thermal expansion of materials, as it considers all inter-atomic forces to be purely harmonic and therefore the equilibrium inter-atomic distances are all invariant with temperature.[7] This would mean that, for any substance, no expansion would occur upon an increase in temperature.
The Quasi-Harmonic approximation is an elaboration on the simpler harmonic model of lattice dynamics and accounts for the effects of thermal expansion, by allowing phonons and their frequencies to be volume-dependent. The Quasi-harmonic approximation is quantum mechanical in nature, although it is based upon the classical harmonic oscillator, with an effective, quadratic potential term. [8] Quantum mechanical behaviour, such as zero point energy and quantised eigenstates, are expressed because the system consists of a large number of minutely-discrete, vibrational energy levels. The energy has a non-discrete band structure, however, due to a near-infinite number of energy levels with near-zero energy separation. This means that the energy will vary continuously with k in reciprocal space (within a band) and can be modelled with a Bloch wave function (a wave function for a particle in a periodic environment such as a crystal lattice). [9]
The Helmholtz free energy in the Quasi-harmonic approximation is given by:

where U is the internal energy, EZP is the vibrational zero point energy of the lattice, T is absolute temperature in kelvin, S is entropy and V is volume.
It should be noted that this approximation fails to account for the anharmonicity of phonon-phonon interactions and therefore 'anharmonic shifts' in phonon frequency may be observed. [10]
Molecular Dynamics
Molecular dynamics is an N-body simulation, based on classical mechanics and determines particle trajectories based on Newtonian physics and potentials between particles. It is an alternative approach to solving the same problem as the Quasi-harmonic approximation, and 'for systems which obey the ergodic hypothesis, the evolution of one molecular dynamics simulation may be used to determine macroscopic thermodynamic properties of the system'. [11] Essentially, the Helmholtz free energy and thermal expansion coefficients can be determined.
Procedure
The first step involved an initial optimisation of a face centred cubic, magnesium oxide lattice. The output log file described properties of the structure such as internal energy and bonding. The binding energy was determined by summing over the infinite lattice. Next, the vibrations of the lattice, or phonons, were computed. Plots of phonon dispersion and phonon density of states, along with an animated visualisation of the phonons were obtained.
In order to obtain a smooth density of states curve, more k points were sampled by increasing the shrinking factor of the lattice in all vector directions. Compromising between accuracy and shorter computing time, it was found that a 32x32x32 shrinking factor was sufficient. This was confirmed by probing for convergence of Helmholtz free energy values for the same range of grid sizes at a set temperature of 300 K.
Subsequently, using the predetermined optimal shrinking factor, the Quasi-Harmonic Approximation was used to simulate the thermal expansion of the MgO lattice. Varying the absolute temperature by 100 K increments from 0 to 1000 K, the effects on lattice constant and free energy were analysed. The thermal expansion of MgO was then reassessed by an alternate molecular dynamics method. Temperature was varied again by 100 K increments from 0 to 1000 K and the effects on internal energy and unit cell volume were investigated. As a final test, a simulation at 2000 K was run for both methods to examine the MgO crystal behaviour at high temperature.
Results and Discussion
Representing the MgO Structure
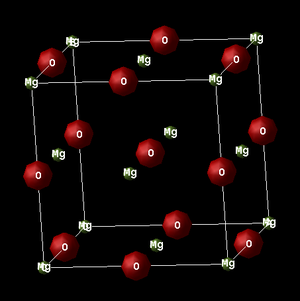
The face centred cubic structure of the MgO lattice is most simply represented by the primitive cell, as pictured below. The rhombohedral structure of the primitive cell consists of a centred oxygen atom, surrounded by 8 magnesium atoms on each corner of the cell. Since each Mg atom contributes 1/8 of itself to the cell, the result is each primitive cell effectively containing 1 Mg and 1 O atom. The output of any calculation is in terms of the simple, primitive cell with an angle of 60.0000° and lattice constant of 2.9783 Å. It should also be noted that four primitive cells are contained within one conventional cell.

Furthermore, in the image below, the conventional unit cell far better displays the symmetry of the fcc system, with 4 Mg and 4 Oxygen atoms in total. The simulation is an accurate representation of the real, cubic structure with a lattice constant of 4.212 Å, which is good concordance with the literature value of 4.211 Å.[12]
Phonon Dispersion Curves
A phonon is described as some quantised vibrational energy with a particular normal mode. The phonon dispersion relation represents the relation between the frequency of the phonon and its wave vector. The dispersion relation is, in fact, periodic with the reciprocal lattice and the phonon dispersion curve is therefore restricted to the first unit cell or Brillouin zone of the reciprocal lattice. The origin of the Brillouin zone is denoted with a capital gamma and the zone boundaries consist of planes which are perpendicular bisectors of the reciprocal lattice vectors. [13] Within the Brillouin zone, phonon vibrational frequency varies with changes in the reciprocal lattice vector, k.
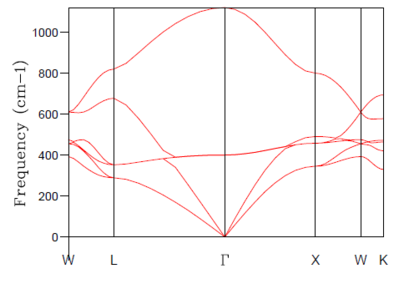
At certain points in the Brillouin zone branches may be seen to be merging. This occurs due to symmetry and degeneracy of the vibrational modes. The total number of branches (6) in the phonon dispersion curve is equal to the number of atoms in the primitive cell (2 in this case) multiplied by the number of dimensions (3).

There are two unique types of branch:
- Acoustic Phonon Modes
The first type are the lower energy, lower frequency acoustic modes which correspond to the coherent vibration of neighbouring atoms in the lattice. They are not dissimilar to sounds waves. 3 acoustic modes can be seen in figure. 1 above. The acoustic mode branches can be seen to tend to zero at the origin gamma. The reason for this is that as the wavelength of vibration tends to infinity, all atoms move in-phase and the crystal as a whole undergoes a displacement, which causes no change in total energy.
- Optical Phonon Modes
The second type are higher energy, higher frequency optical modes, corresponding to out-of-phase vibrations of adjacent atoms in the structure. They are called optical modes because in some crystals, this type of vibrational mode can interact with infra-red radiation. 3N-3 optical modes can be seen in figure. 1 above. The optical mode branches can be seen to be non-zero at the origin gamma. This is because they display a vibrational mode in which an electrical dipole moment is formed. This dipole moment is observed to vary with time. [14]
Phonon Density of States and Grid-Size Optimisation
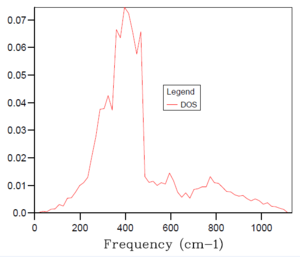
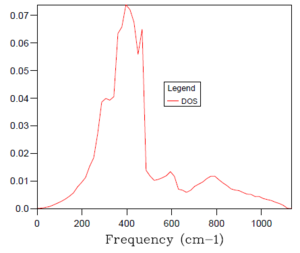
The phonon density of states is a plot of relative peak intensity vs frequency. It indicates the number of vibrational energy eigenstates present at each frequency. The perfect density of states plot would require a grid size of infinite shrinking factor and would take infinite computing time to complete the calculation for every position within the Brillouin zone.

Figure 2. above is the density of states plot for the smallest grid size of 1x1x1, which took the shortest time to simulate, as only one k point was considered. There are two peaks of relative intensity 2, at around 300 cm-1 and two of relative intensity 1, at around 750 cm-1. Considering the related phonon dispersion curve in figure 1. above, it can be seen that this density of states plot is for the symmetry point or k point L. The two lower frequency, lower energy peaks are twice as intense. This is explained by the fact that the branches of the lower energy modes in the phonon dispersion curve merge at k point L and, therefore the corresponding phonons are doubly degenerate. The two higher frequency peaks, however, are single branches at k point L in the phonon dispersion curve and therefore have half the intensity of the doubly degenerate peaks.
| 2x2x2 | 4x4x4 | 8x8x8 |
|---|---|---|
 |
 |
 |
| 16x16x16 | 32x32x32 | 64x64x64 |
 |
 |
 |
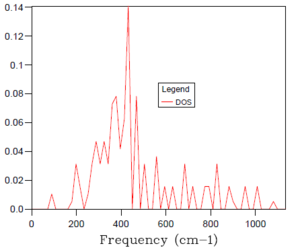
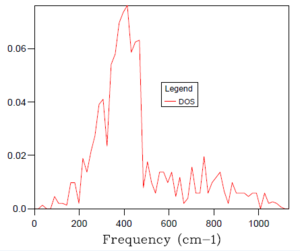
As introduced earlier, the optimal grid size is therefore a compromise between accuracy (when compared to the real situation) and computing time of an increasingly processing-intensive calculation. Essentially, the larger the grid size, the more k values that are covered and the more accurate accurate the simulation but the more time taken for the calculation to complete. A 1x1x1 grid size was inaccurate, only sampling a single k point and, hence providing a density of states plot with sharp peaks. With reference to the table of density of states plots above, it can be seen that as the grid size and shrinking factor are increased, the density of states plots begin to resemble smoother curves and become more accurate. The optimal grid size was found to be 32x32x32, with no significant change in the shape of the DOS graph from this to the next, far more time demanding grid size of 64x64x64. It was decided to not probe for a similar plot with smaller, faster to compute grid sizes because the 32x32x32 simulation was sufficiently quick to complete.
As a means of confirming that the 32x32x32 grid size was indeed optimal, the changes in Helmholtz free energy with varying grid size were calculated. This was performed using a Quasi-harmonic approximation of the MgO system at a set temperature of 300 K. As seen in the table of data below, the Helmholtz free energy reaches optimal accuracy at a value of -40.926483 eV for the 32x32x32 grid size. Any larger grid size produces the same value, with the added disadvantage of a longer computing time.
| Grid Size | Helmholtz Free Energy/ eV |
|---|---|
| 1x1x1 | -40.930301 |
| 2x2x2 | -40.926609 |
| 4x4x4 | -40.926459 |
| 8x8x8 | -40.926478 |
| 16x16x16 | -40.926482 |
| 32x32x32 | -40.926483 |
| 64x64x64 | -40.926483 |
Grid Sizes for Other Chemical Structures
Differing substances have varying structures and, therefore a variety of lattice constants. As seen in equation 4 below, an increase in lattice constant results in a decrease in reciprocal lattice constant, due to the reciprocal nature of the relationship. This means that the size of the Brillouin zone will vary between substances. Therefore, different optimal grid sizes will be appropriate in simulating different size Brillouin zones, in order to sample the same number of k points and, hence maintain the same accuracy or smoothness for each phonon density of states curve.

Below is included a table of literature lattice constant values for a variety of substances under speculation.
| Substance | Lattice Constant/ Å [15] [16] [17] |
|---|---|
| CaO | 4.800 |
| Faujasite | 24.700 |
| Lithium | 3.490 |
- The face centred cubic structure of CaO has a lattice constant of 4.800 Å, that is only slightly larger than that of MgO (4.212 Å). This is most likely due to the calcium ion possessing a larger ionic radius than that of the magnesium ion. Thus, the Brillouin zone for CaO will be only slightly smaller than that of MgO. A slightly smaller optimal grid size could therefore be employed in simulating the smaller Brillouin zone of CaO, but this would save only a negligible amount of time. Hence, for CaO the same grid size as MgO (32x32x32) would be appropriate. It should be recalled that this grid size has already been determined to be efficient in terms of computing time.
- The cubic structure of faujasite has a much larger lattice constant (24.7 Å) than that of MgO. This implies that the Brillouin zone is far smaller for faujasite and therefore a drastically smaller grid size would suffice in obtaining an accurate, smooth density of states curve. This would save a significant amount of simulation time.
- The metallic structure of lithium has a relatively small lattice constant of 3.490 Å. This would suggest that lithium would require a larger optimal grid size than that of MgO. This, however, is not the case due to the delocalised electron structure of elemental lithium. The oppositely charged electrons reduce repulsive interactions between the oscillating lithium ions and therefore result in lower phonon vibrational energies with lower phonon dispersion. As a result, the density of states plot would be of a less disperse range and, hence require a significantly smaller optimal grid size. This knowledge would save significant computing time.
Quasi-Harmonic Approximation Calculations
Helmholtz Free Energy vs Temperature
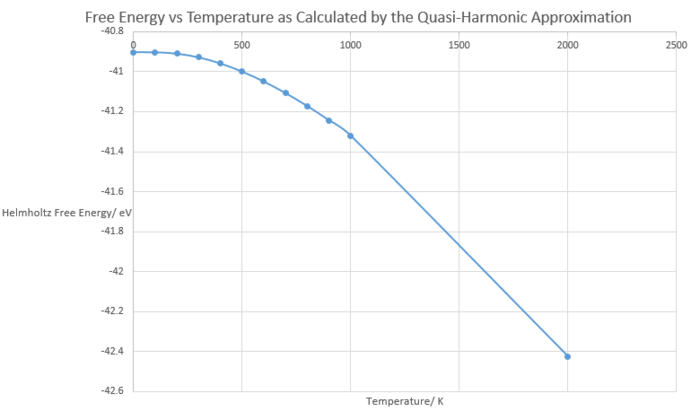
Figure 3. below shows a plot of Helmholtz free energy against absolute temperature when using the Quasi-harmonic approximation. Also provided below is the equation for Helmholtz free energy.

The Helmholtz free energy of the lattice shows a general decreasing trend with increasing temperature. The lattice energy of MgO is exothermic and therefore negative, whilst absolute entropy is positive. Thus, considering the equation above, the value of free energy for MgO will always be negative. The gradient also becomes more negative with increasing temperature. At low temperatures (in the range of 0 to 1000 K) internal energy, U is the dominating factor of free energy. There is a seemingly linear region above the temperature of 1000 K. This is explained by the fact that the small changes in internal energy, U and entropy, S become insignificant when compared with large temperature values. Essentially, free energy, A becomes linearly proportional to temperature.
At 0 K, the zero-point energy of the system can be seen. This is not at the origin and there is some residual energy in the system, a quantum mechanical property.
Lattice Constant vs Temperature
As seen below in figure 4, the MgO lattice constant shows a general increasing trend with increasing temperature. As temperature is increased, the lattice gains more energy and more higher energy vibrational states become populated. The higher energy phonons have larger displacements from their equilibrium positions, as the particles are oscillating with more kinetic energy. The phonons are out-of-phase with their neighbours and the average inter-atomic distance will be larger. If average atomic distance is larger, the substance will expand as a whole to accommodate this. This process is therefore known as thermal expansion.
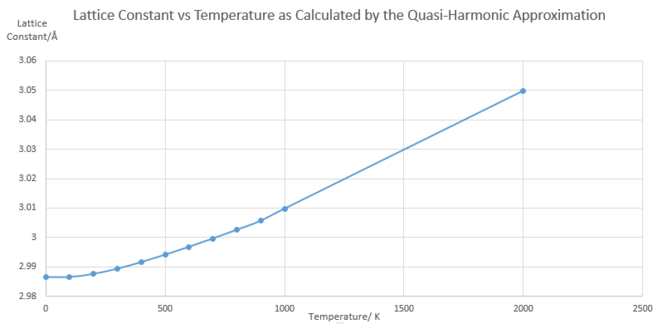
With reference to figure 5. below, the harmonic approximation alone would result in no change in lattice constant with changing temperature. This is because the equilibrium inter-atomic separation is unchanging between vibrational energy levels. So, on average, an increase in temperature would result in no increase in inter-atomic separation. The Quasi-Harmonic approximation fixes this and causes the system to follow a Morse potential. Essentially, the equilibrium inter-atomic separation increases with increasingly higher vibrational level population. Hence, the quasi-harmonic approximation is better suited to simulating this process than the purely harmonic approximation.
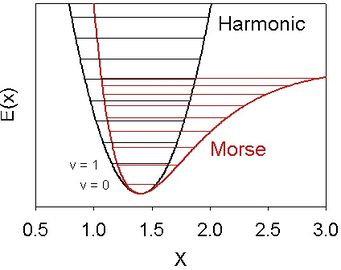
Because the quasi-harmonic approximation still relies on its harmonic basis, the simulation will, however, never predict dissociation of the ions in the MgO lattice. This is the major disadvantages of this approximation.
Molecular Dynamics Calculations
An optimal super cell size of 32 times larger than the volume of the primitive cell was utilised for these calculations. This is again, a compromise between short computing time and accuracy to the real system. This particularly large cell is required because molecular dynamics simulations rely on the equilibration and monitoring of a large, random system of randomly populated vibrational states. Simply, for the correct distribution of vibrational states to occur, there must be enough particles.
Internal Energy vs Temperature
The molecular dynamics method calculates only the internal energy of the system instead of the Helmholtz free energy. Internal energy is defined as follows; the sum of work done by the system and heat transfer into the system:
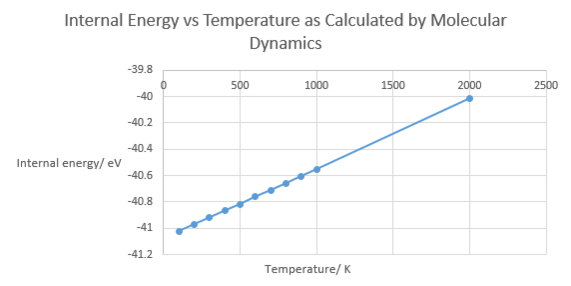
Figure 6. below shows that molecular dynamics predicts internal energy to increase linearly with increasing temperature. This is for two reasons. One, heat energy is being transferred into the system and two, work is being done by the expanding lattice on its surroundings (its compressing the atmosphere around it slightly). Both of these effects sum to increase total internal energy.
Comparison of the Quasi-Harmonic Approximation and Molecular Dynamics
Cell Volume per Formula Unit vs Temperature
Figure 7. below shows how cell volume is predicted to increase with increase temperature, for both the molecular dynamics simulation and quasi-harmonic approximation. Both simulations predict correctly that the MgO structure will undergo an increase in volume with increased temperature. The reason for this has been previously explained in the lattice constant vs temperature section, with discussion on increased average inter-atomic distances resulting in thermal expansion. Their values also have good concordance in the region of 600 to 1000 K.
At high temperature, the two plots begin to deviate from each other. This is because the quasi-harmonic approximation does not account for dissociation as the melting temperature is approached, as introduced previously. Instead, it assumes that expansion will continue indefinitely and so predicts incorrectly a larger volume.
At low temperature, the molecular dynamics plot of volume behaves almost linearly with changes in temperature. This is due to the fact that molecular dynamics is a purely classical simulation based on Newtonian physics and so the quantum mechanical phenomenon of zero point energy is not considered.
At 0 K, molecular dynamics calculations fail and do not run. The reason for this is that in a Newtonian system, the atoms would possess no kinetic energy, so no equilibration or particle motion would be simulated.
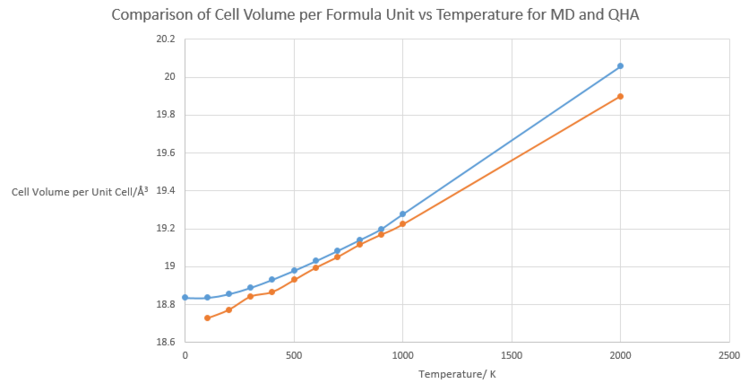
These plots provide the data required to determine the thermal expansion coefficient of MgO at different temperature ranges for both the MD simulation and QH approximation. Included below is a table comparing this data.
| Temperature (K) | QHA Prediction of a (10-6K-1) | MD Prediction of a (10-6K-1) | Literature Value of a (10-6K-1) [19] [20] [21] |
|---|---|---|---|
| 0-300 | 9.47 | 27.9 | 10.4 |
| 300-1000 | 27.9 | 28.8 | 31.1 |
| 1000-2000 | 37.9 | 35.1 | 35.9 |
With reference to the table above, at higher temperatures, the quasi-harmonic approximation overestimates thermal expansion as it predicts expansion to occur indefinitely without dissociation or melting (as mentioned previously). For this reason, molecular dynamics is more appropriate for higher temperature calculations. This is shown for the temperature range of 1000 to 2000 K, where molecular dynamics predicts a closer value to that of the literature.
For low temperature ranges (0 to 300 K), the Quasi-harmonic approximation is closer to the literature value for the thermal expansion coefficient and is more appropriate for simulating the thermal expansion. As discussed earlier, this is because the quasi-harmonic approximation considers the quantum mechanical property of zero point energy, whilst molecular dynamics does not. Molecular dynamics only considers random thermal motion of the molecules, and this classic approximation fails to even compute volume at 0 K.
Conclusion
The Quasi-harmonic approximation is better suited to thermal expansion calculations at lower temperatures. This is because it accounts for zero point energy, whilst molecular dynamics does not. This approximation is ideal, for instance, for modelling the thermal expansion of substances that are likely to be exposed to temperatures below that at which they dissociate or undergo phase changes.
Conversely, the molecular dynamics simulation is more appropriate for modelling thermal expansion at high temperatures, where random thermal motion and classical behaviour of particles are the dominant factors. The quasi-harmonic model tends to fail at higher temperatures as it does not consider dissociation, but instead results in expansions continuing infinitely.
To conclude, this computational investigation was successful, with good comparison made between the quasi-harmonic approximation and the molecular dynamics method for a range of variables. It is evident that both methods are not perfect and that, when used in unison, can provide a better understanding of substances across a broader range of temperatures.
References
- ↑ P. A. Tipler and G. Mosca, Physics for Scientists and Engineers, Worth Publishers, New York, 2008.
- ↑ W. Gravesande, Physices elementa mathematica, experimentis confirmata, sive introductio ad philosophiam Newtonianam, Leiden Publishing, Leiden, 1720.
- ↑ D. G. Fahrenheit, Philosophical Transactions. 1724, 33, 1-3.
- ↑ F. Cverna, Thermal Properties of Metals, ASM International, Ohio, 2002.
- ↑ G. D. Barrera, J. A. O. Bruno, T. H. K. Barron and N. L. Allan, Journal of Physics: Condensed Matter, 2005, 17, 217-252.
- ↑ J.D. Gale and A.L. Rohl, Mol. Simul., 2003 , 29, 291-341.
- ↑ M. T. Dove, Introduction to Lattice Dynamics, Cambridge University Press, Cambridge, 1993.
- ↑ G. P. Srivastava, The Physics of Phonons, CRC Press, Florida , 1990.
- ↑ C. Kittel, Introduction to Solid State Physics, Wiley, New York, 1996.
- ↑ B. Fultz, Progress in Materials Science, 2009, 55, 1-8.
- ↑ J. P. Mesirov, K. Schulten and D.W. Sumners, Mathmatical Applications to Biomolecular Structure and Dynamics, Springer, New York, 1996.
- ↑ C. Y. Ho and R. E. Taylor, Thermal Expansion of Solids, ASM International, Ohio, 1998.
- ↑ G. E. Peckham, 1964, Dissertation, Cambridge University.
- ↑ E. F. Schubert, Physical Foundation of Solid-State Devices, Troy, New York, 2015.
- ↑ H. Zhang and M. S. T. Bukowinski, Phys. Rev. B.,1991, 44, 2495.
- ↑ S. Bhatia, Zeolite Catalysis: Principles and Applications, CRC Press, Florida, 1990.
- ↑ K. Hermann, Crystallography and Surface Structure: An Introduction for Surface Scientists and Nanoscientists, Wiley, New York, 2011.
- ↑ Image Accessed at : http://cccbdb.nist.gov/vibnotes.asp
- ↑ C. Y. Ho and R. E. Taylor, Thermal Expansion of Solids, ASM International, Ohio, 1998.
- ↑ O. Anderson and K. Zou, Journal of Physical and Chemical Reference Data. 2016, 19, 69.
- ↑ R. R. Reeber, K. Goessel and K. Wang, Eur. J. Mineral., 1995, 7, 1039-1058.
