Rep:Cej15 - The Thermal Expansion of MgO
Abstract
The thermal expansion coefficients of MgO at constant pressure was calculated using computer software GULP. The phonon dispersion curves, density of states and Helmholtz free energy for MgO were obtained at different temperatures. Through lattice dynamic and molecular dynamic simulation methods, the thermal expansion coefficients were calculated to be for molecular dynamics and for lattice dynamics. These were then compared to literature values, and for molecular dynamics and lattice dynamics respectively[1].
Introduction
System
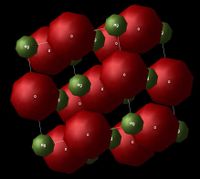
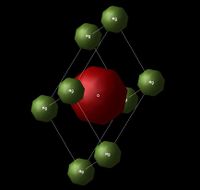
The system used for this experiment was the magnesium oxide (MgO) crystal. Figure 1 and 2 show the lattice structure (FCC - face centered cubic) and the primitive cell of MgO respectively, where the red-coloured atoms correspond to oxygen ions and the green-coloured ones correspond to magnesium ions.
Lattice Dynamics
The investigation on lattice dynamics is the study of the vibrations of the atoms in the particular lattice. At thermal equilibrium, atoms in a solid do not stay at rest - they vibrate with respect to their equilibrium positions[2].This is essential as this could lead to the discovery of the substance's heat capacity, free energy, thermal conductivity, phase transitions and many more properties.
The vibration of the atoms, in this case they are called phonons, results in lattice waves propagating through the lattice and each wave has its corresponding wavelength and frequency . As the values of the wavelengths and frequencies are different in each different type of vibration, wavevector is used and has equation . is proportional to , so is energy (). Therefore, as increases, so will the energy of the vibration.
Thermal Expansion of a crystal
Thermal expansion of a solid occurs when the volume of the substance increases due to an increase in temperature. The distance between the atoms increase, however, this would not be the case if the interaction between the atoms were harmonic, as the equilibrium bond length would stay the same no matter how much the temperature changes.
The thermal expansion coefficient (TEC) of a solid measures how much the solid expands per degree of temperature. The formula used to calculate the TEC is shown below,
where corresponds to the thermal expansion coefficient. The pressure is held constant and only the temperature changes.
Method
Calculating the phonon modes of MgO
the lattice type used for the following calculations was the primitive unit cell of MgO which had cartesian lattice vectors:
and cell parameters:
Binding energy:
Phonon Dispersion Curves
A phonon dispersion curve was computed for the primitive lattice cell of MgO, as shown in Figure 3. This was done in order to visualize all possible phonon modes of the crystal along a path in k-space.
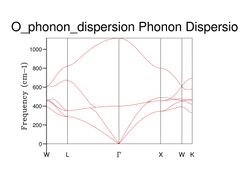

Comparing Figure 3 with Figure 4, it can be seen that the phonon dispersion curve obtained from GULP is very similar to that obtained from the literature.
The phonon density of state (Phonon DOS)
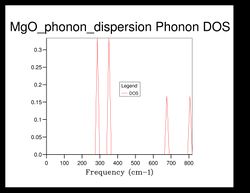
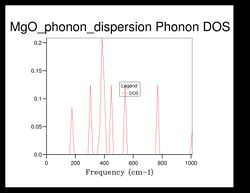


As shown in Figure 5, there are 4 distinct peaks, with 2 that have larger peaks at frequencies and and 2 that have smaller peaks at and . The two larger peaks are around twice as large as the smaller ones, indicating that those two peaks have degenerate frequencies. This can be proven by referring back to the phonon dispersion curve obtained previously (see Figure 3). The single k-point sample is at the position in the dispersion curve. At the lower frequencies at the position, corresponding to the frequencies and , the two curves split into four separate branches, indicating that they are degenerate.
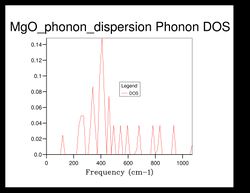
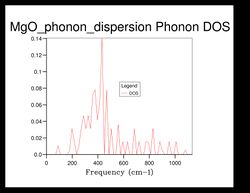
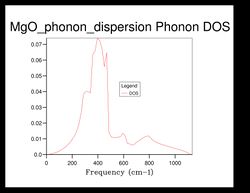
As the grid size increases, the density of states increase as well. For grid size , there was only 1 k-point; for , there were 4 k-points; for there were 18; for there were 32... It can be seen that after the intensity or frequency of the DOS do not differ much, meaning that grid size would be a reasonable approximation for the phonon DOS. However, the more the grid size is increased, the more reliable the approximation would be.
Comparing the DOS computed at with the much smaller ones, it can be seen that the curve is much smoother and there isn't any discontinuity.
Computing the free energy - the Harmonic Approximation
The lattice type used here was also the primitive unit cell as mentioned above.
Selecting a suitable k-space grid
The temperature used for the following calculations was set at .
| Grid Size | Free energy / eV | Difference compared to previous grid size / eV |
|---|---|---|
| 1x1x1 | -40.930301 | |
| 2x2x2 | -40.926609 | 0.003692 |
| 3x3x3 | -40.926432 | 0.000177 |
| 4x4x4 | -40.926450 | 0.000018 |
| 5x5x5 | -40.926463 | 0.000013 |
| 6x6x6 | -40.926471 | 0.000008 |
| 7x7x7 | -40.926475 | 0.000004 |
| 8x8x8 | -40.926478 | 0.000003 |
| 9x9x9 | -40.926479 | 0.000001 |
| 10x10x10 | -40.926480 | 0.000001 |
| 16x16x16 | -40.926482 | 0.000002 |
| 32x32x32 | -40.926483 | 0.000001 |
| 64x64x64 | -40.926483 | 0.000000 |
As shown from Table 1, as the grid size increases, the energy differences become smaller until after grid size where there is no more change in energy - the system is stabilized. Therefore, the most suitable k-space grid would be .
Thermal Expansion of MgO
The primitive unit cell was used for the following calculations and the structure was optimized at different temperatures and the free energy data was collected at a grid size of , as determined from the previous section. The free energy was computed within the quasi-harmonic approximation.
| Temperature / K | Free energy / eV | Lattice constant / A |
|---|---|---|
| 0 | 0.172485 | 2.9783 |
| 100 | -40.902420 | 2.9866 |
| 200 | -40.909377 | 2.9867 |
| 300 | -40.928125 | 2.9876 |
| 400 | -40.958594 | 2.9894 |
| 500 | -40.999436 | 2.9916 |
| 600 | -41.049316 | 2.9941 |
| 700 | -41.107119 | 2.9968 |
| 800 | -41.171892 | 2.9996 |
| 900 | -41.243018 | 3.0026 |
| 1000 | -41.319849 | 3.0056 |
Molecular Dynamics of MgO
The lattice used for the following calculations was a cell that contained 32 units of MgO. The cell volumes at equilibrium were collected at different temperatures. The time step was set to 1.0 femtoseconds, the number of equilibrium steps and production steps to 500, and sampling and trajectory write steps to 5. The volume per formula unit was calculated by dividing the equilibrium cell volume by 32.
| Temperature / K | Cell Volume / A^3 | Volume per formula unit / A^3 |
|---|---|---|
| 100 | 599.483366 | 18.73385519 |
| 200 | 600.580229 | 18.76813216 |
| 300 | 602.899441 | 18.84060753 |
| 400 | 604.188880 | 18.88090250 |
| 500 | 605.758425 | 18.92995078 |
| 600 | 608.794097 | 19.02481553 |
| 700 | 610.096648 | 19.06552025 |
| 800 | 612.495200 | 19.14047500 |
| 900 | 613.637377 | 19.17616803 |
| 1000 | 615.970085 | 19.24906516 |
Results and Discussion
Thermal Expansion of MgO within quasi-harmonic approximation - Lattice Enthalpy
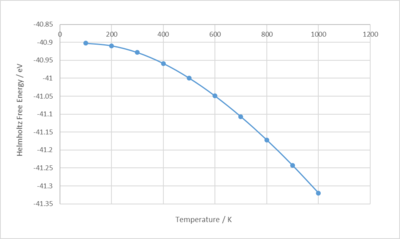
Figure 12 shows a plot of the Helmholtz free energy obtained from the optimisation of the thermal expansion of MgO against temperature. As temperature increases, the energy decreases and the gradient becomes more negative. This shows that the solid is becoming more unstable as temperature increases.
Below is a plot of the lattice constant against temperature. As temperature increases, so does the lattice constant and tends to increase even more rapidly at higher temperatures. This indicates that the solid is expanding.

Molecular Dynamics of Thermal Expansion of MgO
For this simulation, it did not work at 0K, probably because following classical mechanics, atoms won't have any kinetic energy at 0K and would not move from its equilibrium position, thus not possess motion or any molecular dynamics.
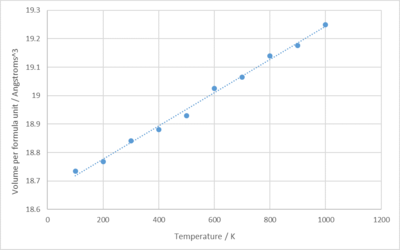
As shown above in figure 14, there is a linear positive relationship between the volume and the temperature.
Comparison between Lattice Dynamics and Molecular Dynamics

As shown above, lattice and molecular dynamics differ on thermal expansion. For lattice dynamics, thermal expansion occurs as the equilibrium bond length between the atoms increase due to the anharmonicity of the potential. For molecular dynamics, the solid expands because more energy is put into the system and that increases the kinetic and potential energy of the atoms.
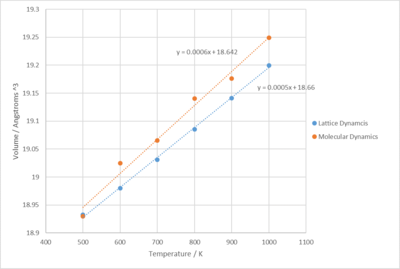
As mentioned previously, the relationship for volume against temperature for molecular dynamic thermal expansion is linear, but for lattice dynamics, the gradient increases in the beginning then turns linear to the end. Therefore, another graph was plotted with only the linear regions of the two graphs, 500K to 1000K, in order to work out the thermal expansion coefficients. The new graph is shown below as figure 16:
Conclusion
For this experiment, the thermal expansion coefficients of MgO at constant pressure was calculated using lattice dynamic and molecular dynamic simulation methods. The values of the TECs were obtained according to the equation mentioned in the introduction section. For molecular dynamics, the value calculated was and for lattice dynamics, . Comparing these values to those obtained from literature, for molecular dynamics and for lattice dynamics[5], they are quite similar.
References
- ↑ A. Chopelas, Physics of the Earth and Planetary Interiors, 1996, 98, 3-15.
- ↑ S. S. Li, in Semiconductor Physical Electronics, pp. 26–44.
- ↑ A. Erba, M. Shahrokhi, R. Moradian and R. Dovesi, The Journal of Chemical Physics, 2015, 142, 044114.
- ↑ Wu, Xiaozhi & Liu, Lili & Li, Weiguo & Wang, Rui & Liu, Qing. (2014). Effect of temperature on elastic constants, generalized stacking fault energy and dislocation cores in MgO and CaO. Computational Condensed Matter. 1. . 10.1016/j.cocom.2014.10.005.
- ↑ A. Chopelas, Physics of the Earth and Planetary Interiors, 1996, 98, 3-15.
