Rep:CeT114MgO
The Free Energy and Thermal Expansion of MgO
Introduction
The aims of this computational experiment are to compute the phonon dispersion curve, density of states, free energy and thermal expansion of magnesium oxide, MgO. Phonons are discrete ‘packets’ of vibrational energy. Both the quasi-harmonic approximation and a molecular dynamics simulation are used, and the results from both compared.
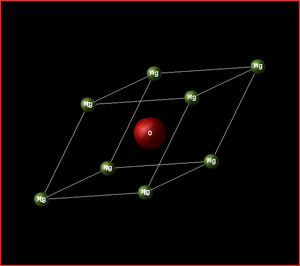
The system being analysed is the MgO crystal. The conventional cell is made up of 8 atoms, has a face centred cubic (fcc) structure and parameters ac=bc=cc. The primitive cell is made up of 2 atoms, has the parameters ap=bp=cp and is the smallest possible way of representing the crystal lattice. Below is a diagram showing how the two cells are related.
| Conventional Cell | Primitive Cell | Primitive Cell shown inside the Conventional |
|---|---|---|
 |
 |

|
Methodology
RedHat Linux was the operating system used to run all the calculations. Within Linux, the DLVisualize program was used to interface with the models of the MgO system and the General Utility Lattice Program (GULP) was used to simulate the properties of the system. The phonon dispersion curve was calculated using 50 points in the k-space and the density of states graphs were calculated at a constant pressure. The free energies were calculated at a constant temperature of 300 K. For the molecular dynamics simulations, the ensemble was set to NPT, the time-step to 1 femtosecond, equilibrium and production steps to 500 and the sampling steps, as well as the trajectory steps to 5 each.
Results and Discussions
Computing the Phonons of the MgO Lattice
The phonon dispersion curve of the MgO lattice was computed to inspect its normal modes of vibration, or phonon modes. A phonon dispersion curve shows the possible frequencies of the phonon modes at a particular wave-vector, k.
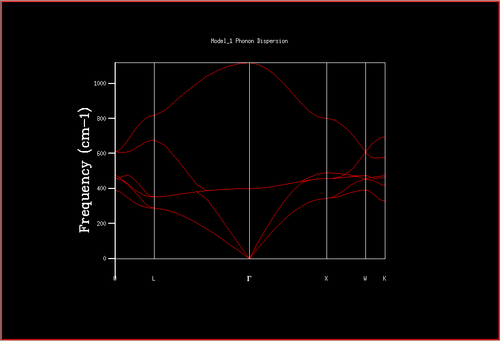
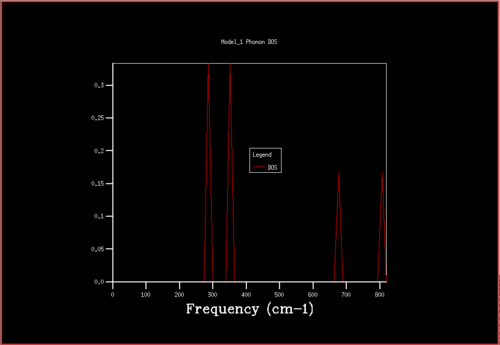
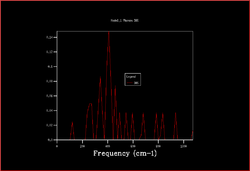
A Density of States (DOS) graph can be plotted when all the k-points are summed. A DOS was calculated for a grid with shrinking factors 1x1x1, which has a single k-point. The DOS graph has 4 peaks and relates to the L k-point in the dispersion curve, with 2 degenerate points and 2 non-degenerate points. This degeneracy explains why two of the peaks are twice the size of the other two peaks.
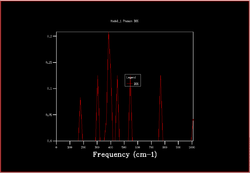
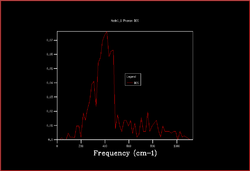
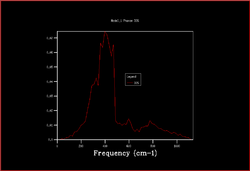
In order to plot an accurate DOS, all the k-points need to be included. This can be achieved by increasing the shrinking factors and enlarging the grid of k-points. The most accurate result would be obtained by using a grid of infinite size, however as this not possible the grid sizes 2x2x2, 3x3x3, 4x4x4, 8x8x8, 16x6x16, 32x32x32 and 64x64x64 were calculated.
| 2x2x2 | 3x3x3 | 4x4x4 | 8x8x8 |
|---|---|---|---|
 |
 |
 |
 |
| 16x16x16 | 32x32x32 | 64x64x64 |
|---|---|---|
 |
 |
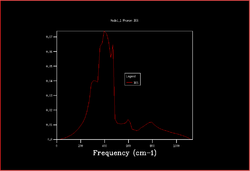 |
As the shrinking factors are increased the DOS smooths out due to more k-points being accessed. From comparing the graphs, it can be seen that the DOS with a 32x32x32 grid size gives a result similar to the 64x64x64 grid size DOS, and so is the minimum grid size that should be used in these calculations.
Calcium Oxide (CaO) has a very similar lattice to MgO. It is made up of Ca2+ and O2- ions held in an ionic lattice, with a lattice constant of 4.803 Å.[1] The lattice constant of MgO is 4.209 Å[2], meaning that the CaO is larger. As it is larger in real space, it is smaller in reciprocal space and therefore requires less k-points meaning a marginally smaller grid size could be used, however 32x32x32 would still work well. The Zeolite Faujasite is far larger than MgO, with lattice constant of 24.66 Å.[3] It is so much lager in real space that a much smaller k-point grid would be sufficient. In the case of lithium, it is a very different system. With metallic bonding the lattice is made from the lithium cations, which are surrounded by electrons, often described as a ‘sea of electrons’. The repulsion of the lithium cations is lowered due to the electrons, which lowers the energy of dispersion and allows for a smaller grid size to be used.
Using the Harmonic Approximation to Calculate the Free Energy
Using the quasi-harmonic approximation, the free energy is calculated in relation to an increasing k-point grid by summing all the normal modes of vibration. By comparing the results of increased grid sizes, the best compromise between experimental time and answer accuracy can be found.

| k-space grid | Free Energy |
|---|---|
| 1x1x1 | -40.930301 |
| 2x2x2 | -40.926609 |
| 3x3x3 | -40.926432 |
| 4x4x4 | -40.926450 |
| 8x8x8 | -40.926478 |
| 16x16x16 | -40.926482 |
| 32x32x32 | -40.926483 |
| 64x64x64 | -40.926483 |
It is seen from the table and graph above that initially there is a relatively dramatic change to the free energy with an increase in grid size. After a grid size of 8x8x8 the free energy is reasonably stable, however when you reach a size of 64x64x64 it remains the same as the 32x32x32 at 8 significant figures. For this reason, a grid size of 32x32x32 provides an accurate enough result and takes less time to run than the calculation with a 64x64x64 grid.
For free energy calculations that are accurate to 1meV and 0.5 meV, a grid size of 3x3x3 can be used, and for an energy accurate to 0.1meV a grid size of 8x8x8 could be used.
The Thermal Expansion of MgO
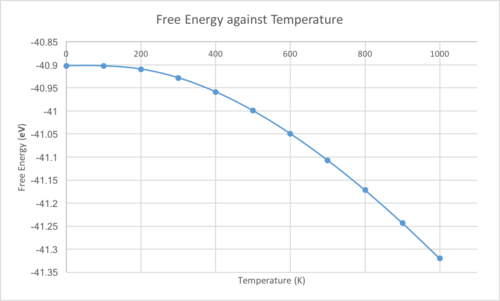
The equation for the Helmholtz free energy is . This equation can be simplified to , showing that the free energy is dependent on both temperature and volume. Using the quasi-harmonic approximation, the MgO free energy was computed with respect to the temperature of the system. The free energy, lattice constants and primitive cell volume were plotted against temperature.
| Free Energy against Temperature | Lattice Constants against Temperature |
|---|---|
 |
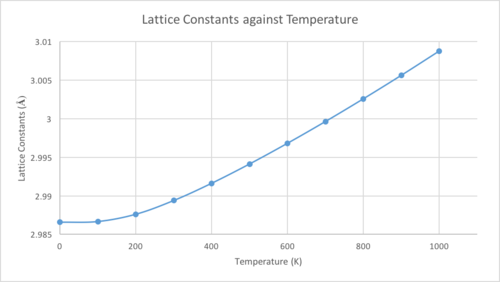 |
The lattice parameter, and volume, increase as the temperature does. This is because these computations are run using the quasi-harmonic approximation, where an increase in temperature moves the system up an anharmonic, Morse-like potential and results in the bond lengths increasing. The Helmholtz equation shows that as the temperature increases, the magnitude of the negative term increases, which explains the increased negativity of the free energy. The plots are not completely linear due to the zero-point energy assumed in the system. At high temperatures the approximation breaks down, as it assumes that the bonds will never break and simply vibrate more and more, meaning even at the melting point of the crystal the bonds would still be unbroken. With an exactly harmonic diatomic molecule, the bond lengths do not change as the equilibrium position stays the same as the energy increases.

By looking at the linear region, between 300 and 1000 K, of the graph shown above, the thermal expansion coefficient, , can be calculated using the equation .
The calculated coefficient is 2.671x10⁻⁵ K-1. The coefficient found in literature is 4.47x10⁻⁵ K-1,[4] which was taken at 1000 K. While the two are of the same order, there is a clear difference between them. This difference is likely due to the limitations of the quasi-harmonic approximation previously mentioned and the fact that a truly accurate result would require an infinite grid size.
Molecular Dynamics Calculations
Using Molecular Dynamics (MD) to compute the calculations allows the system to behave as they would in the real world, in accordance to Newton’s Laws. However, for an MD calculation a supercell needs to be used as if a single cell is used the movements in the system would all be perfectly in phase and is not a good representation of real world physics.

The thermal expansion coefficient found from the MD calculations is 3.213x10⁻⁵ K-1. This number is closer to the one found in literature. This is likely due to the MD calculations being closer to what happens in the real world. Another advantage of MD simulations over the quasi-harmonic is that when the temperature reaches the melting point of the crystal the bonds would break.
Conclusions
From the calculations run in this computational experiment, several observations can be made. It was shown that with the increase in temperature of an MgO crystal the lattice constant, and therefore also the cell volume, will increase. It can be seen that in a high temperature system the MD method should be used as it is a more realistic model, especially if the temperature is approaching the point at with the bonds will dissociate. For low temperatures, however, the quasi-harmonic model is sufficient to provide a reasonably accurate answer.
References
- ↑ K. Doll, M. Dolg and H. Stoll, Physical Review B, 1996, 54, pp. 13529-13535.
- ↑ A. Cimino, P. Porta and M. Valigi, Journal of The American Ceramic Society, 49, pp. 152-156.
- ↑ D. N. Stamires, Clays and Clay Minerals, 1973, 21, pp. 379-389.
- ↑ S.S. Kushwah, J. Shanker, Physica B, 1996, 225, pp. 283-287.
