Rep:Bc608 module3
Ben Chappell (CID: 00513494)
Introduction
In this final module of the third year computational lab, transition state modelling is addressed. New computational techniques are utilised and an attempt has been made to understand each of these new techniques in the first section where they are introduced.
The first section is a worked tutorial investigating the Cope rearrangement of 1,5-hexadiene. Extensive references are made to "Appendix 1" throughout the section, which can be found here: https://wiki.ch.ic.ac.uk/wiki/index.php?title=Mod:phys3#Appendix_1
The second section investigates the two Diels Alder reactions.
As a side note: An extension was arranged with Dr Hunt for this wiki to be handed in at 5PM on the 26th of March 2011. Unfortunately, the whole Chemistry Wiki went down from around 5PM on the 25th of March 2011 and so this was not possible. Please email me (bc608@imperial.ac.uk) if there are any queries regarding late submission.
Cope Rearrangement Tutorial
Historically, the mechanism of the Cope Rearrangement [1] was subject to much controversy. After numerous experimental and computational studies, the reaction is widely accepted to be concerted and proceed via either a chair or boat transition structure as shown in Figure 1[2]
In this tutorial, a computational study is performed on the Cope Rearrangement of 1,5 Hexadiene as an example of how to approach a chemical reactivity problem.
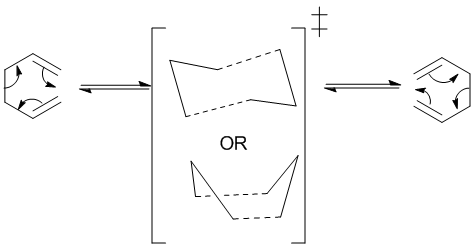
The aim of this exercise is to locate the low-energy minima and transition structure on the C6H10 potential energy surface, in order to determine the preferred reaction mechanism.
The approach that will be taken is as follows:
- Locate the low-energy minima on the C6H10 potential energy surface using a computationally inexpensive method
- Locate the high-energy maxima transition state structures on the C6H10 potential energy surface using a computationally inexpensive method
- Find which reactants and products these transition state structures link using a computationally inexpensive method
- Reoptimise structures of interest at a higher level of theory to provide an improved agreement with experiment
- Demonstrate that this approach is valid
- Use the above information in order to determine the preferred reaction mechanism
Energy minima on the C6H10 potential energy surface
Before calculations are carried out, it's important to firsty try and predict what the minima of the C6H10 potential energy surface may look like. This will allow the reasonability of the calculated minimas to be judged and prevents the results of calculations being followed blindly.
If we consider rotation about the central C-C bond of 1,5-hexadiene and assume that all interactions between groups are purely the result of steric hinderance, we can sketch a dihedral angle plot as shown in Figure 2.
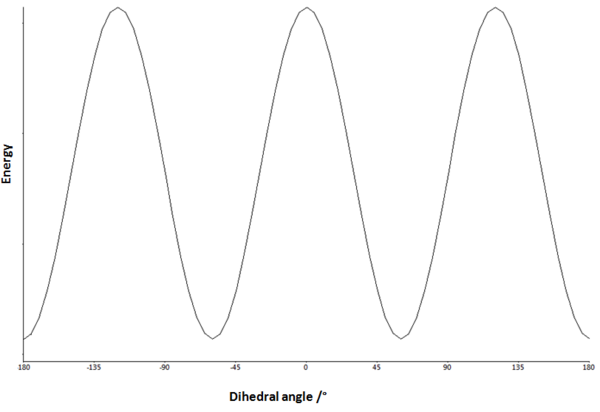
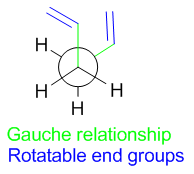
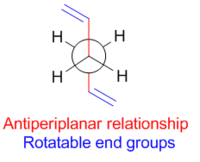
Minima on the potential energy surface can be seen at 60° and 180° corresponding to the gauche (synclinal) and antiperiplanar conformations respectively. The anticlinal (120°) and synperiplanar (0°) conformations are maxima. It is likely therefore that stable conformations of 1,5-hexadiene will adopt a gauche (Figure 3) or antiperiplanar (Figure 4) relationship of the central 4 carbons. This then leaves only the terminal two carbons to be considered, which on first consideration might be expected to be rotated such that steric repulsions are minimised. The conformation of this central bond will therefore dominate the conformation of the rest of the molecule.
 |
 | |||
Gauche versus antiperiplanar: Which is more stable?
Now it has been predicted that the minima will either be "gauche" or "antiperiplanar", it's important to predict which one of the two will be more stable. Normally, calculated activation energies are referenced with respect to the lowest energy conformation of a reactant molecule.[2] Complex reactant molecules may possess numerous possible conformations. A prediction of which conformer is most stable can allow the results of calculations to be assessed for plausibility.
It is proposed that 3 effects will determine the stability of the conformers of 1,5-hexadiene. These effects are:
- Sterics
- Stereoelectronics
- Van der Waals interactions
The effects of sterics have been discussed in the previous section and will not be discussed further. It is proposed that a small stereoelectronic effect may exist in 1,5-hexadiene, which may favour Gauche conformers.
Kirby's theory[3] states:
“There is a stereoelectronic preference for conformations in which the best donor lone pair or bond is anti-periplanar to the best acceptor bond or orbital”
The "best" donor orbital is defined as the highest energy donor orbital. The "best" acceptor orbital is defined as the lowest energy acceptor orbital. A high energy donor orbital and a low energy acceptor orbital will minimise the interaction energy between the orbitals. It can be seen from the simplified form of the Klopman-Salem equation below that this will maximise the stabilisation energy imparted on the system.


Where:
S2 is the overlap integral
ESTAB is the stabilisation energy
ΔEi is the interaction energy or the energy difference between interacting orbitals
The highest energy donor orbital in 1,5-hexadiene is the σC-C and the lowest energy acceptor orbital is the σ*C-H orbital.[4] There will therefore be a stereo-electronic preference for C-H bonds and C-C bonds to be in an antiperiplanar arrangement, which is the case in Gauche conformers but not the case in antiperiplanar conformers. Thus stereoelectronics may favour the gauche conformation. This proposed favourable stereoelectronic interaction is shown in Figure 5.
The second effect to be considered is Van der Waals interaction. A larger number of attractive Van der Waals interactions between hydrogens may exist in the Gauche conformer, analogous to the case seen for n-butane. [5] This so called "Gauche-effect" is especially abundant in large alkane chains, where "hairpin" structures are formed via Gauche linkages in order to maximise attractive Van der Waals forces. [6]
When the magnitude of these 3 effects is considered for the case of 1,5-hexadiene, one might expect both the Stereoelectronic and Van der Waals contributions to be small. Hydrogen and Carbon are very close in electronegativity and therefore σC-H and σC-C would be expected to be close in energy. σ*C-H and σ*C-C would also be expected to be close in energy. Therefore, the preference for σC-H being antiperiplanar to σ*C-C would probably be very weak. The stereoelectronic stablisation of the gauche conformers over the antiperiplanar conformers would be expected to be very small.
Van der Waals interactions are also probably insignificant. Van der Waals interactions themselves are weak and they are often only significant where they are numerous, additive interactions, as is the case in the hairpin structures described above. If the central C-C bond of 1,5-hexadiene is considered to be an ethylene unit, then one might expect Van der Waals interactions to exist between two chains each of a length of two carbons.
Due to the negligible contribution of these two effects, sterics would be expected to be the sole factor that determines conformer stability. One would therefore expect the most stable conformer of 1,5-hexadiene to have the central 4 carbons in an antiperiplanar arrangement.
Locating the energy minima computationally
In order to test the above hypothesis, two molecules of 1,5-hexadiene were drawn using Gaussview. One was drawn with an antiperiplanar relationship between the central four carbons and the other was drawn with a gauche relationship between the central four carbons. Whilst numerous gauche and antiperiplanar conformers may exist due to rotations about terminal carbons, the steric argument presented in the previous section should favour an antiperiplanar conformer significantly over any gauche conformer.
The two drawn structures were optimised with a Hatree Fock calculation using a 3-21G basis set. Figure 6 shows the results of these two calculations.
| Conformation of the central 4 carbon atoms | Total Energy ± 3.808x10⁻³ / Hatree | Log file | Point group | Structure | Appendix 1 Assignment |
| Antiperiplanar | -231.691 | https://wiki.ch.ic.ac.uk/wiki/images/1/13/Bc608_APP_LINKAGE_1_5_HEXADIENE.LOG | C1 |
|
Anti4 |
| Gauche | -231.693 | https://wiki.ch.ic.ac.uk/wiki/images/c/c7/Bc608_GAUCHE3.LOG | C1 |
|
Gauche3 |
Figure 6: The optimised structures of two structures calculated using HF/3-21G
The modelled Gauche conformer was found to be 4.4KJ mol-1 more stable than the modelled antiperiplanar conformer. Clearly there is a significant effect operating other than sterics. In order to see if there was a molecular orbital effect operating, the molecular orbitals of the two conformers were examined.
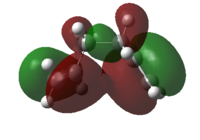
The HOMOs of the two modelled structures are shown in Figure 7.
 |
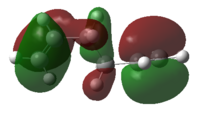 | |||
Figure 7: The HOMOs for the modelled gauche and antiperiplanar conformers
It can be seen that there is significant constructive secondary orbital overlap of π orbitals in the Gauche conformer, whereas this secondary orbital overlap is absent in the antiperiplanar conformer. One might expect different Gauche conformers to exhibit this secondary orbital overlap effect to different extents, dependent on the relative geometry of alkene groups. Antiperiplanar conformations however might be expected to be incapable of this secondary orbital overlap, due to the large distance between π orbitals in the structures.
Some groups have also postulated an attractive interaction between an alkene π orbital and a vinyl proton of the other alkene substituent[7] as shown in Figure 8. However, no evidence of this effect could be found at this level of theory.
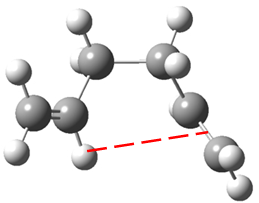
In conclusion, the lowest energy conformation of 1,5-hexadiene will either be the antiperiplanar conformation in which sterics are minimised or the gauche conformer in which constructive π overlap is maximised.
Consultation of Appendix 1[2] shows that gauche3, in which π orbital interactions are maximised is indeed the most stable conformation of 1,5-hexadiene.
Geometry optimisation the anti2 structure
Despite it having previously been stated that calculated activation energies and enthalpies often use the lowest energy conformation of a reactant molecule as a reference, in this exercise the anti2 structure[2] will be used as a reference. It's possible that this conformation is the most stable conformation at higher levels of theory or that the decision is just arbitrary.
The anti2 structure was drawn and optimised using a HF/3-21G calculation. The energy was found to match Appendix 1. The optimised structure was then reoptimised using a DFT-B3LYP/6-31G(d) optimisation. The results of the optimisations are shown in Figure 9.
| Calculation Type/Basis set | Total Energy ± 3.808x10⁻³ / Hatree | Log file | Point group | Structure |
| HF/3-21G | -231.693 | https://wiki.ch.ic.ac.uk/wiki/images/8/8b/Bc608_ANTI2_CONFORMATION.LOG | Ci |
|
| DFT-B3LYP/6-31G(d) | -234.612 | https://wiki.ch.ic.ac.uk/wiki/images/b/bc/Bc608_DFT_OPT_ANTICONF2.LOG | Ci |
|
Figure 9: The optimised structures of anti 2 using HF/3-21G and DFT-B3LYP/6-31G(d) calculations
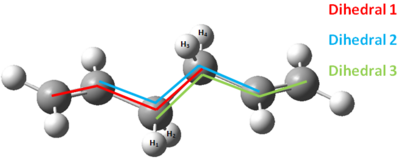
It is important at this point to check that there is not a large difference between structures at the lower level of theory and the higher level of theory. Recall the approach that was being taken in this exercise: the potential energy surface was being mapped by a low level of theory (HF/3-21G), then points of interests are being reoptimised at a higher level of theory (DFT-B3LYP/6-31G(d)) in order to make comparisons to experiment. If there is little correlation between structures at the low level of theory and the higher level of theory, then there is a problem with this approach. Namely, the potential energy surface at the higher level of theory does not resemble the potential energy surface the the lower level of theory. Transition states and minima in the lower level of theory may not be transition states or minima at the higher level of theory. Thus it is imperative that a comparison between the two levels of theory is made to determine the degree to which structures change. A good agreement in parameters such as bond lengths and angles will mean that information obtained at the low level of theory can provide information about what is happening at the higher level of theory. A poor agreement will mean that the approach has to be revised. The referencing system for the comparisons is shown in Figure 10 and the results are shown in Figure 11.
| Parameter | Calculation type | |
| HF/3-21G | DFT-B3LYP | |
| Dihedral one angle | -114.7 | 118.5 |
| Dihedral two angle | 180.0 | 180.0 |
| Dihedral three angle | 114.7 | 118.5 |
| H1-C-C-H3 dihedral angle | -62.8 | - 64.8 |
| H1-C-C-H4 dihedral angle | 180.0 | 180.0 |
| H2-C-C-H3 dihedral angle | 180.0 | 180.0 |
| H2-C-C-H4 dihedral angle | 62.8 | 64.1 |
| H-C-H bond angle | 107.7 | 106.6 |
| C=C bond length | 1.32 | 1.33 |
| C-C bond length | 1.51 and 1.55 | 1.50 and 1.55 |
| C-H bond length | 1.07 to 1.09 | 1.09 to 1.11 |
Figure 11: A table to compare dihedral angles between the optimised structures from HF/3-21G and DFT-B3LYP/6-31G(d) calculations. All angles are in ° and are accurate to ± 0.05. All bond lengths are in Å and are accurate to ±0.01
Fortunately, the overall geometry of the structure does not change drastically upon reoptimisation with DFT/6-31G(d). The positions of the terminal carbons are controlled by Dihedral 1 and Dihedral 3 and these dihedral angles change by around 2.0°. The angle between hydrogens on the central carbons has also contracted by 1.1°. The bond lengths also change by around the order of error. These changes however are small, thus calculations at the HF/3-21G level of theory are likely to be giving relevant information about the potential energy surface at the DFT-B3LYP/6-31G(d) level of theory, which has been reported to be in close agreement to reality.[2]
Frequency analysis of the optimised anti2 structure
The energies discussed so far are meaningless in terms of experimental determinable quantities. They represent the energy of the molecule on the potential energy surface and do not take into account contributions such as zero point energy, thermal energy and entropy. In order to compare calculated energies to experimentally determined energies, these contributions must be taken into account. Fortunately, these contributions to the system energy can be obtained by a frequency calculation, which performs a thermochemical analysis as part of the calculation.
A frequency calculation was performed on the DFT-B3LYP/6-31G(d) optimised structure of anti2. The log file of the calculation can be found here: https://wiki.ch.ic.ac.uk/wiki/images/f/fe/Bc608_DFT_FREQ_ANTICONF.LOG
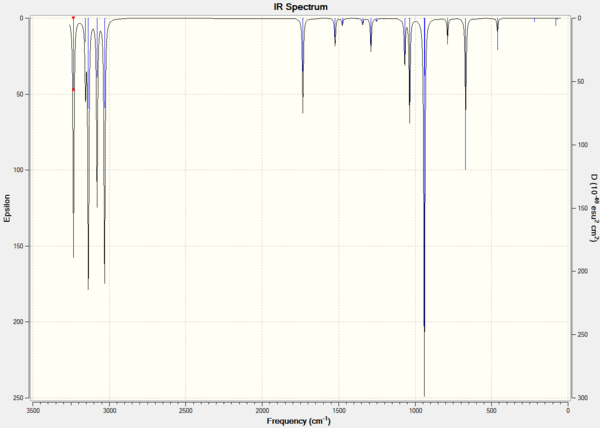
The calculated frequencies were seen to be all positive and no imaginary frequencies were seen, confirming a minima had been reached. The calculated infra-red spectrum is shown in Figure 12.
The Thermochemistry section of the output file was examined, 4 values were recorded. These are:
i) The sum of electronic and zero-point energies is the potential energy at 0 K including the zero-point energy and is given by the equation E = Eelec + ZPE
ii) The sum of electronic and thermal energies is the potential energy at 298.15 K and 1 atm, which is given by the equation E' = E + Evib + Erot + Etrans.
iii) The sum of electronic and thermal enthalpies is the previous energy, but corrected for room temperature it is given by the equation H = E' + RT
iv) The sum of electronic and thermal free energies includes entropic contributions and is given by the equation G = H - TS.
At 298.15 K, these values were calculated to be:
i) = -234.469 ± 3.808x10⁻³ Hartree
ii)= -234.462 ± 3.808x10⁻³ Hartree
iii) = -234.461 ± 3.808x10⁻³ Hartree
iv) = -234.501 ± 3.808x10⁻³ Hartree
An attempt was then made to calculate these values at 0.0 K. Examination of the log file however showed the calculation to still being performed at 298.15 K. It's possible that this is a bug where Gaussian is interpreting "0" as "default" rather than "0 K". The calculation was repeated with the temperature set as "0.0001 K". The log file is shown here: https://wiki.ch.ic.ac.uk/wiki/images/e/e8/Bc608_DFT_FREQ_ANTICONF_0K.LOG
i) -234.469 ± 3.808x10⁻³ Hartree
ii) -234.469 ± 3.808x10⁻³ Hartree
iii) -234.469 ± 3.808x10⁻³ Hartree
iv) -234.469 ± 3.808x10⁻³ Hartree
As expected, all values match the "sum of electronic and zero-point energies" value at 298.15 K.
Optimising Chair and Boat structures
Now the reactants and products of the Cope rearrangement have been optimised and their energies determined, it's now important to model the transition states of the reaction. The lowest activation energy pathway will give the fastest reaction. The fastest reaction will dominate the observed mechanism of the reaction.
There are a number of ways of modelling the transition state. This section of this report explores 3 complementary ways of achieving this.
These methods are:
- Optimise to Berny transition state directly
- Frozen co-ordinate preoptimisation, then optimise to Berny Transition State
- The QTS2 method.
The first two methods will be used to model the chair transition state and the last will be used to model the Boat Transition state. Discussion of how each method works is provided in each section.
Direct optimisation to a Berny transition state (Chair TS)
How the method works
In determination of the normal vibrational modes, the nuclear Schrödinger equation is solved. The nuclear Schrödinger equation is shown below:

The potential energy term, V(x) can be calculated using a Taylor expansion about x=0. This gives the following equation:

Where dxi and dxj are displacements of degrees of freedom. Examples of degrees of freedom include: translation in the x direction of atom 1, translation in the y direction of atom 1, translation of atom 2 in the z direction etc. Assuming the Harmonic Oscillator approximation to apply:
- Terms higher than x2 are assumed to be negligible.
- The x term is zero as the gradient at a stationary point is zero.
- V(0) is equal to zero.
This simplifies the Taylor expansion to:

This resembles the Simple Harmonic Oscillator equation, where the second derivative term resembles the spring constant. However, there is a mass dependence in the spring constant of a simple harmonic oscillator, whereas there is no mass dependence here. We cannot equate the two yet, but they are clearly related. This mass dependence will be accounted for shortly. The terms of the sum of second derivatives can be projected out in a matrix form as shown below.

This is the Cartesian Hessian containing the internal degrees of freedom of the system. The mass dependence of vibrations can now be introduced by converting the cartesian coordinates into mass-weighted-coordinates. Mass-weighted-coordinates are related to cartesian coordinates according to the following equation:

Where qi is a mass-weighted-coordinate, xi is a cartesian coordinate and mi is the mass of atom i.
The Cartesian Hessian can then be converted into the mass-weighted-coordinate Hessian and equated to the force constant:

The mass-weighted-coordinate Hessian can now be put back into the nuclear Schrödinger equation and solved. In order to solve the nuclear Schrödinger equation, the Hessian must be diagonalised to give a diagonal matrix of eigenvalues. The matrix of normal modes is an orthogonal matrix and so the inverse of the matrix is equal to the transposed matrix.
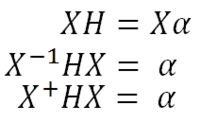
Where X is the matrix of normal modes, H is the mass-weighted-coordinate Hessian matrix and α is the diagonal eigenvalue matrix. The square root of α gives the frequency of a normal mode. The Hessian is diagonalised into a matrix of eigenvalues because normal modes are orthogonal to one another. When the transposed normal mode matrix (X+) is post multiplied by HX, any off diagonal terms are equal to zero as there is no overlap between different normal modes. When an element of the eigenvalue matrix is negative, this gives an imaginary frequency as the square root of a negative number is an imaginary number.
The first step of the optimise to Berny transition state method computes the mass-weighted-coordinate Hessian matrix and thus the normal modes of the system. The imaginary normal mode is identified by finding the normal mode that corresponds to the negative eigenvalue in the diagonal matrix of eigenvalues. The TS optimisation then moves nuclei in a manner which increases the energy of the degree of freedom that corresponds to the imaginary mode (the reaction coordinate), whilst minimising the energy of all other degrees of freedom. The Hessian is then updated using an algorithm. An algorithm is used to update the Hessian as its "from scratch" calculation is computationally expensive - calculating the Hessian at iteration would therefore lead to very slow calculations. The procedure of atom position adjustment and updating the Hessian is then repeated iteratively until the reaction coordinate is at a maxima and all other degrees of freedom are at a minima. This iterative procedure is illustrated in Figure 13.

The optimisation to the transition state is an iterative procedure and the Hessian is updated using an algorithm at each iteration. The Hessian therefore becomes less accurate as the iterations proceed, so there will be a limit to the number of iterative steps that can be taken. Furthermore, the optimisation procedure assumes that the potential energy surface has a quadratic shape - this assumption is only valid when the system is close to the transition state geometry. The method will only work as long as the quadratic potential energy surface approximation holds.
Applying the method
The chair transition state consists of two C3H5 allyl fragments positioned approximately 2.2Å apart with C2H symmetry. The chair transition state was shown in Figure 14. In order to model this transition state, this C3H5 allyl fragment must first be optimised.
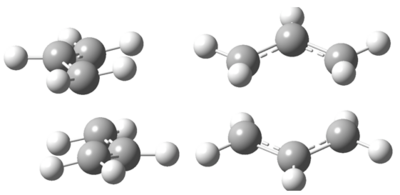
The C3H5 allyl fragment was optimised using a HF/3-21G calculation. The energy of the molecule was found to be -115.823 ± 3.808x10⁻³ Hartree and the point group was found to be CS. The log file of the calculation can be found here: https://wiki.ch.ic.ac.uk/wiki/images/6/68/Bc608_ALLYL_FRAGMENT_GEO_OPT_HF_3_21_G.LOG
The optimised structure can be viewed here:
A guessed structure of the chair transition state was then constructed. Two allyl fragments were pasted into a new window and orientated so that the guessed structure resembled the chair transition state shown in Figure 14. The two allyl fragments that come together in the reaction were set roughly 2.2Å apart. The guessed structure can be viewed here:
The guessed transition state structure was pasted into a new window. An optimisation with frequency analysis to a Berny Transition State was performed using a Hatree Fock calculation and a 3-21G basis set. The Hessian was calculated at the start and updated throughout the calculation. The additional keywords "Opt=NoEigen" were included to prevent the calculation crashing if more than one imaginary frequency is detected during the optimisation procedure. In the case of detection of multiple negative frequencies, the most negative frequency is deemed to be the reaction co-ordinate. A log file of the calculation can be found here: https://wiki.ch.ic.ac.uk/wiki/images/1/1a/Bc608_BERNY_TS_OPTIMISATION_HF_3_21_G.LOG
The optimised structure of the Berny Transition State is shown here:
One imaginary frequency was seen at -818cm-1, which corresponds to the reaction co-ordinate. This vibration shows the Cope Rearrangment via a chair transition state.
Indirect optimisation to a Berny transition state: the frozen coordinate method (Chair TS)
How the method works
The frozen coordinate method is very closely related to the direct optimisation to a Berny transition state. In this method however, there is a prior preoptimisation, which attempts to bring all degrees of freedom other than the reaction coordinate to a minima. Figure 15 shows the approach of the frozen coordinate method compared to the approach of the direct optimisation to a Berny transition state.
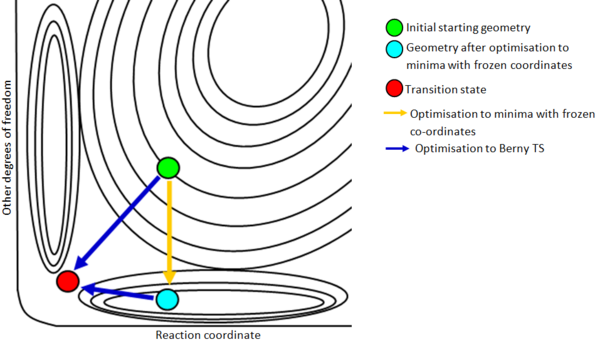
In the preoptimisation, bond forming/breaking distances are fixed. This freezes the degree of freedom corresponding to the reaction coordinate and prevents it from changing. An optimisation is then performed to attempt to minimise the energy of all other degrees of freedom. This is represented in Figure 15 by the orange arrow.
It is important to note that the other degrees of freedom may involve translations or rotations of the atoms involved in bond forming/breaking. A consequence of this is that a minima with respect to each 'other degree of freedom' may not be reached. Reaching the minima in some of these degrees of freedom may require a change in motions of atoms involved in bond forming/breaking. In cases where the energy with respect to a degree of freedom cannot be minimised fully, the calculation makes the energy as close as possible to the minima.
This preoptimisation is then followed by an optimisation to a Berny transition state as before. The frozen coordinate method provides the Berny transition state calculation with atom positions that are much closer to the transition state atom positions, so the optimisation is much more likely to converge.
Applying the method
The guessed chair transition state structure was then optimised using the frozen co-ordinate method. The guessed TS structure was pasted into a new window. The reaction co-ordinate was frozen using the Redundant Co-ordinate Editor. Additional keywords "Opt=ModRedundant" were included and a Hatree Fock optimisation using a 3-21G basis set performed.
The log file of the calculation can be seen here: https://wiki.ch.ic.ac.uk/wiki/images/0/07/Bc608_REDUNDANT_COORDS_TS_OPTIMISATION_HF_3_21_G.LOG The jmol of the resulting structure can be seen here:
The checkpoint file of the previous calculation was opened. The redundant co-ordinate editor was then used to calculate the derivative along the reaction co-ordinate. The force constants were not calculated. A Berny transition state optimisation was then performed, in which only the reaction co-ordinate was allowed to vary until a maxima was reached.
A log file for the calculation can be seen here: https://wiki.ch.ic.ac.uk/wiki/images/8/8f/Bc608_BERNY_TS_REDUNDANT_COORDS_TS_OPTIMISATION_HF_3_21_G.LOG
The optimised transition state can be seen here:
The vibration corresponding the the reaction co-ordinate can be seen here:
The bond forming and bond breaking lengths were measured to be 2.02Å ± 0.005 in both methods, showing that the methods are complementary and achieve the same optimised chair transition state.
QTS2 Method (Boat transition state)
How the method works
The QTS2 method relies on Rolle's theorem to reach a transition state. Rolle's theorem states:
If two values of a function f(x) are equal at x = a and x = b, then there must exist a point c between a and b where the first derivative of the function is 0.
This is shown pictorially in Figure 16.
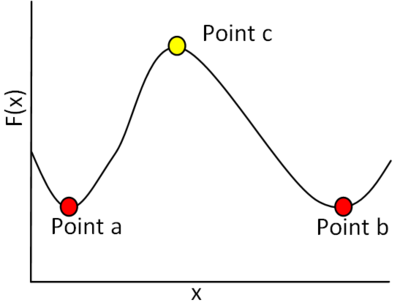
Applied to a chemical system, this means that if two minima are on the same potential energy surface and are of the same energy, with no other minima between them, then there must be a maxima that connects the two minima. This can be used to locate the transition state of a reaction, which is an energy maxima.
Atomic positions are altered so that a provided "reactant structure" is mapped onto a provided "product structure". Between these two structures will lies an intermediate structure of which the first derivative of energy with respect to atomic displacement is zero. This structure will correspond to the structure of the transition state.
Applying the method
The boat transition state structure is reached by the QST2 method. The boat transition state is shown in Figure 17.
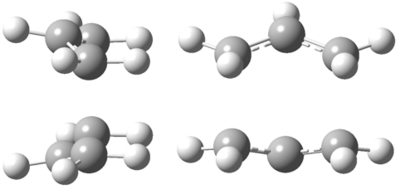
The structures of reactant and product used the previously optimised anti2 structure and the atom numbers were altered as shown in Figure 18.
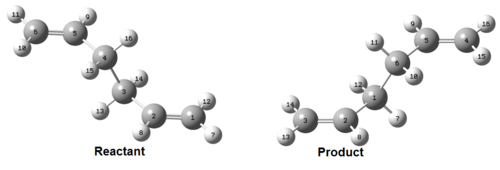
A HF/3-21G calculation was used to interpolate between these two structures to a QST2 transition state. The log file for the calculation is shown here: https://wiki.ch.ic.ac.uk/wiki/images/0/02/Bc608_QST2_BOAT_OPT_ATTEMPT_ONE.LOG
The job was found to fail, with the following structure reached:
The QST2 calculation does not consider the possibility of rotation about bonds - it is only capable of direct linear mapping of "reactant" onto "product". From this starting geometry, neither the boat nor chair transition structure can be reached linearly. The boat transition state would require prior rotation about the central C-C bond between carbons 3 and 4, which the calculation does not consider. A chair transition state cannot exist chemically between these structures, as this would require an unconcerted mechanism, in which the central bond broke before the new bond formed. The structure looks like a dissociated chair transition state, so it is possible that this is what has been attempted.
In order to achieve the boat transition state, the starting geometries had to be altered so that this prior rotation had already taken place before the QST2 calculation was attempted. The dihedral angle between C2-C3-C4-C5 was set as 0°. The C2-C3-C4 and C3-C4-C5 angles were then set as 100°. The new starting geometries are shown in Figure 19.
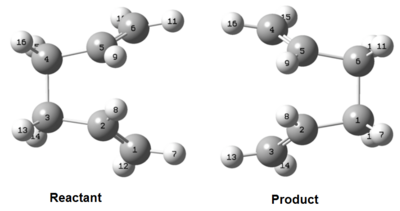
The QST2 calculation was repeated with the starting geometries shown in Figure 19. The log file of the calculation can be seen here: https://wiki.ch.ic.ac.uk/wiki/images/5/5e/Bc608_QST2_BOAT_OPT_ATTEMPT_TWO.LOG
The structure of the boat transition state is shown here:
The one imaginary frequency corresponding to the reaction coordinate can be seen here:
IRC
Transition states connect minima (reactants and products) on a potential energy surface. Now the transition states have been optimised its important to find which minima they connect. This can be achieved by the Intrinsic Reaction Coordinate method.
How the method works
The IRC method follows the minimum energy path from a transition state structure down to its local minimum on a potential energy surface. In the IRC calculation, the Hessian matrix is calculated at the starting geometry and the reaction coordinate is recognised by the negative element of the diagonal eigenvalue matrix.
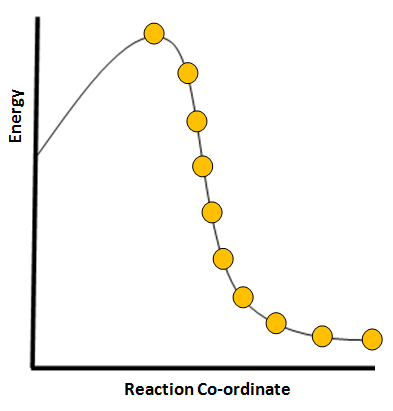
A small step (step size left as default) is then taken in the direction of the reaction coordinate in the direction where the gradient of the potential energy surface is steepest. In this exercise, the forward and backward directions are identical and thus only the forward direction was calculated. The reaction coordinate is then frozen and the atomic positions are changed so that all other degrees of freedom are optimised. This gives the minimum energy structure for the specified reaction coordinate value. Another small step is then taken in the direction of the reaction coordinate. The other degrees of freedom are then optimised. This process is repeated in an iterative procedure, until a stationary point is reached. Each iteration of this IRC procedure will be referred to as an IRC iteration from here-on-in. This is important to define, as the optimisation of all other degrees of freedom at each value of reaction coordinate is also an iterative process. Each iteration in the optimisation of all other degrees of freedom will be referred to as an Optimisation iteration. The IRC procedure is shown in Figure 20.
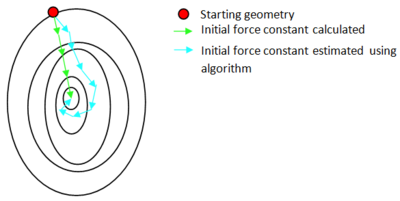
As mentioned, for each IRC iteration an optimisation of all non-reaction coordinate degrees of freedom is performed, requiring several optimisation steps. The optimisation procedure uses the inverse Hessian matrix. In the IRC method, the Hessian matrix can either be calculated for the very first IRC iteration and then updated throughout the IRC iterations by an algorithm. Alternatively, the Hessian matrix can be recalculated for every IRC iteration. In both cases, the Hessian is updated by an algorithm throughout the the optimisation procedure. The first method is named "Calculate Force Constants Once", whereas the second method is named "Calculate Force Constants Always". Whilst "Calculate Force Constants Once" gives much more rapid calculations, it can lead to a problem in optimising structures. In the method, the Hessian becomes increasingly less accurate with IRC iterations i.e. an introduced error in the Hessian at IRC iteration #3 will be present in IRC iteration #5. Furthermore, errors will be additive. "Calculate Force Constants Always" is computationally much more demanding, but the Hessian never becomes very inaccurate because it is thrown out and recalculated from scratch for every IRC iteration.
After a large number of IRC iterations, the inaccuracy introduced into the Hessian can cause the optimisation procedure to fail. A maximum number of 20 optimisation iterations are permitted on the version of Gaussian used by SCAN, whereas 58 are permitted on the version of Gaussian used by departmental computers. After the maximum number of optimisation iterations is reached, the optimisation procedure is abandoned. The effect of Hessian accuracy and therefore calculation method upon optimisation iterations is shown in Figure 21.
Applying the method (Chair TS)
The .chk file of the chair transition state structure optimised by the Frozen co-ordinates method was opened in Gaussview. The IRC method was employed in a Hatree Fock calculation using a 3-21G basis set. The IRC was computed in the forward direction only because the IRC will be symmetrical as reactants and products are the same structure. The force constants were calculated only once at the start of the calculation. 50 points along the IRC were used. Unfortunately the log file was too large to be uploaded and the optimisation was found to fail.
To try and find out why the optimisation failed, the logfile was examined. It was found that the 42nd optimisation had not converged.
     Item               Value     Threshold  Pt 42 Converged?
Maximum Force            0.001092     0.000450     NO
RMS     Force            0.000194     0.000300     YES
Maximum Displacement     0.002061     0.001800     NO
RMS     Displacement     0.000446     0.001200     YES
58 attempts were made to make the 42nd IRC iteration converge to an optimum geometry, after all of these 58 attempts failed the optimisation was stopped as the maximum number of optimisation iterations had been reached.
The structure of the 41st IRC iteration, the last one to converge is shown here:
The progress of the IRC calculation can be seen in Figure 22.
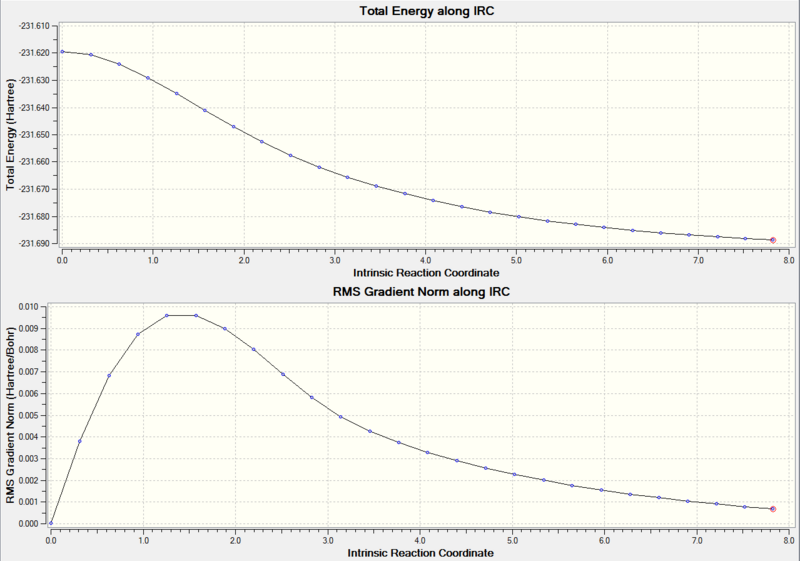
Increasing the number of IRC iterations will not help in this case. The calculation has run out of optimisation iterations, it has not run out of IRC iterations. In order to reach the local minimum, there are two approaches that could be taken.
- The 41st IRC iteration of the previous IRC calculation could be optimised to a minimum. This relies on the 41st IRC point of the previous calculation being sufficiently close in structure to the local minimum that the IRC was seeking. If the 41st IRC point is far away from the local minimum, a false minimum may be converged to.
- The IRC can be repeated with force constants calculated always. This will lead to the Hessian being more accurate throughout the 41st IRC iteration. The situation described in Figure X may apply in this case. This approach will be computationally more demanding than approach 1) however, but avoids the possibility of converging to a false minimum.
Both approaches were attempted, in order.
Direct optimisation of the 41st IRC iteration of the previous IRC calculation
A direct optimisation was performed on the 41st point of the previous IRC calculation. The log file of the optimisation is shown here: https://wiki.ch.ic.ac.uk/wiki/images/d/d5/Bc608_STRAIGHTOFFOPTMISATION.LOG
The optimised structure is shown here:
This structure is referred to in Appendix 1 as Gauche2.
Repeated IRC with a force constants calculated at every iteration
The IRC calculation was repeated with 50 IRC steps and the Hessian being calculated at the start of every IRC iteration.
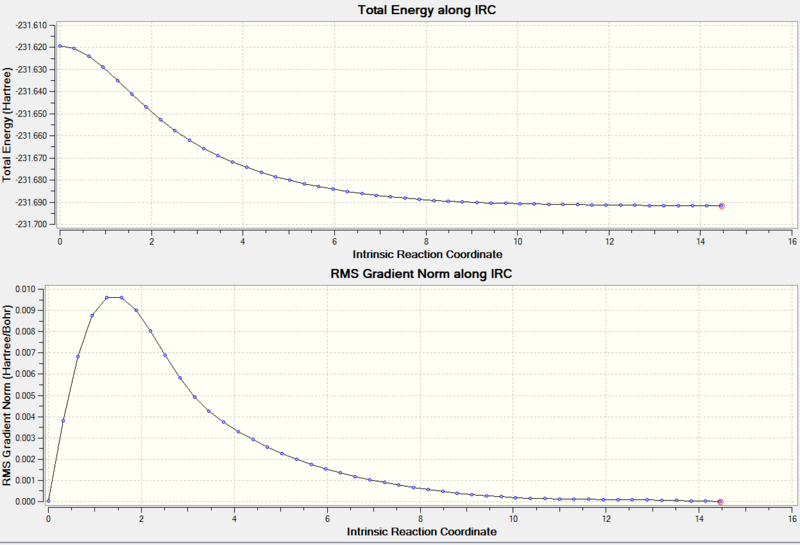
The log file of the calculation can be found here: DOI:10042/to-8012 The IRC was found to complete successfully. The progress of the IRC calculation can be seen in Figure 23.
The final structure can be found here:
This structure is referred to in Appendix 1 as Gauche2. The chair transition state therefore connects 1,5-hexadienes in the Gauche2 conformation.
Applying the method (Boat TS)
The IRC was also calculated for the boat transition state with the Hessian being recalculated at every IRC iteration. The log file of the calculation can be found here: DOI:10042/to-8013 The IRC calculation was found to be successful.
The progress of the IRC calculation can be seen in Figure 24.
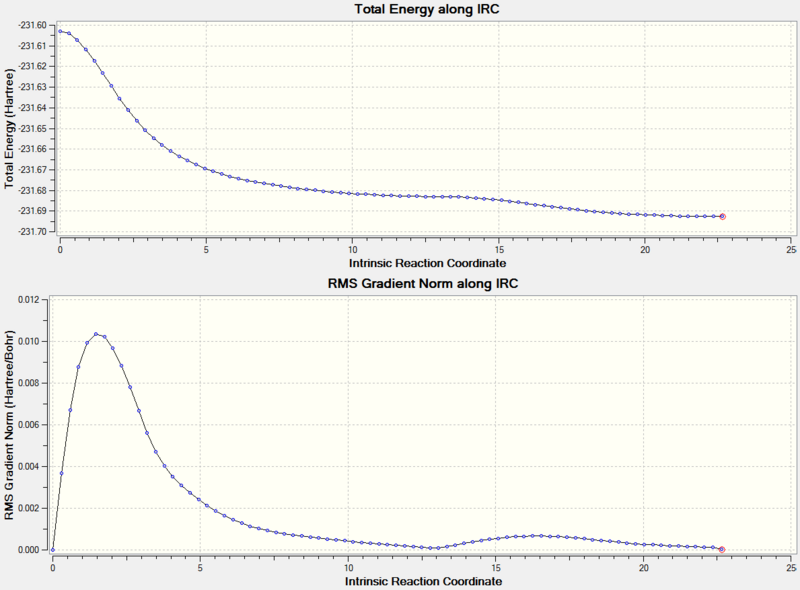
The final structure can be found here:
This structure is referred to in Appendix 1 as Gauche3. The boat transition state therefore connects 1,5-hexadienes in the Gauche3 conformation.
Comparison between low level theory, high level theory and experiment
As discussed in the introduction, the potential energy surface of C6H10 is mapped with a low level theory and then points of interest optimised at a higher level of theory so that comparisons to experiment can be made. Now the transition states have been optimised at a low level of theory, a reoptimisation at a higher level of theory must now be performed.
The previously optimised chair and boat transition state structures were reoptimised using DFT-B3LYP/6-31G(d) calculations. The results are shown in Figure 25.
| Structure | Total Energy ± 3.808x10⁻³ / Hatree | Log file | Jmol |
| Chair TS | -234.557 | DOI:10042/to-8015 | |
| Boat TS | -234.543 | DOI:10042/to-8016 | |
| Anti2 | -234.612 | https://wiki.ch.ic.ac.uk/wiki/images/b/bc/Bc608_DFT_OPT_ANTICONF2.LOG |
|
Figure 25: The relevant optimised structures at the DFT-B3LYP/6-31G(d) level of theory
Comparison of geometrical parameters
As discussed in the Geometry optimisation the anti2 structure section, the geometrical parameters of both the chair and boat transition state structures must be compared in order to show that the approach of mapping the PES with a low level theory is valid.
| Chair Transition State | |||
| Parameter | Calculation type | ||
| HF/3-21G | DFT-B3LYP | ||
| C-C-C | 124.3 | 119.9 | |
| H-C-H | 117.4 | 112.5 | |
| H-C-C-H | 180.0 and 0.0 | 163.6 and 22.6 | |
| C-C | 1.39 | 1.41 | |
| C-H | 1.07 | 1.09 | |
| Bond forming/breaking distance | 2.06 and 2.12 | 1.97 | |
Figure 26: A table to compare geometrical parameters between the optimised structures from HF/3-21G and DFT-B3LYP/6-31G(d) calculations. All angles are in ° and are accurate to ± 0.05. All bond lengths are in Å and are accurate to ±0.01
| Boat Transition State | |||
| Parameter | Calculation type | ||
| HF/3-21G | DFT-B3LYP | ||
| C-C-C | 121.7 | 122.3 | |
| H-C-H | 114.7 | 114.4 | |
| H-C-C-H | 167.0 and 17.4 | 167.5 and 18.2 | |
| C-C | 1.38 | 1.39 | |
| C-H | 1.07 | 1.09 | |
| Bond forming/breaking distance | 2.14 | 2.21 | |
Figure 27: A table to compare geometrical parameters between the optimised structures from HF/3-21G and DFT-B3LYP/6-31G(d) calculations. All angles are in ° and are accurate to ± 0.05. All bond lengths are in Å and are accurate to ±0.01
As can be seen from Figure 26 and Figure 27, the geometrical parameters are very similar between the two levels of theory for both transition states. Therefore, the approach to this exercise is valid.
Comparison of energy differences
The energy differences relative to the anti2 structure were then calculated. The results are shown in Figure 28.
| Structure | Calculation type | Relative energy to anti2 at the same level of theory ± 10 /KJ mol-1 |
| Chair TS | HF/3-21G | 194 |
| DFT/6-31G(d) | 144 | |
| Boat TS | HF/3-21 | 236 |
| DFT/6-31G(d) | 181 |
Figure 28: A comparison of energies relative to the anti2 structure at HF/3-21 and DFT/6-31G(d) levels of theory
As can be seen in Figure 28, there is a large difference in the relative energies between the two theories. This shows that the reoptimisation is required - whilst the geometries are similar, the energies of the systems are very different.
Activation energies for the chair and boat transition states
The activation energies for the reaction via the chair and boat transition states at 0 K are shown in Figure 29.
| Structure | Calculated Activation energy ± 10 /KJ mol-1 | Literature[8] Activation Energy /KJ mol-1 |
| Chair TS | 144 | 140.2 ± 2.1 |
| Boat TS | 181 | 187.0 ± 8.4 |
Figure 29: A table to compare the calculated activation energies to literature values
The experimentally determined values are in excellent agreement with the calculated values. At 298.15 K these values were calculated as:
| Structure | Calculated Activation energy ± 10 /KJ mol-1 |
| Chair TS | 139 |
| Boat TS | 173 |
Figure 30: A table to show the calculated activation energies at 298.15 K
As expected, the mechanism via the chair transition state has the lowest activation energy. The chair TS avoids eclipsing interactions between groups that are present in the more strained boat TS. The activation energies are also reduced at 298.15 K, which reflects the energy supplied to the system by the surroundings.
Conclusions
The chair transition state is the preferred transition state of the Cope rearrangement of 1,5-hexadiene. The chair TS is 34 KJ mol-1 more stable than the boat TS at 298.15 K.
The methods of obtaining structures of transition states and information about what minima they connect have been used and understood.
Diels Alder Cycloaddition
The Diels Alder reaction between Ethylene and cis-butadiene

The Diels Alder reaction between ethylene and cis-butadiene is a 4πs + 2πs cycloaddition that proceeds via a concerted mechanism.
This reaction will be investigated using methods introduced in the previous exercise. The same general approach as the previous exercise will be taken. The potential energy surface will be mapped using low level (AM1) calculations and points of interest will be reoptimised using higher level (DFT-B3LYP/6-31G(d)) calculations.
Optimisation of starting materials
Ethylene and cis-butadiene were optimised using semi-empirical AM1 calculations. A frequency analysis was then performed to characterise the stationary points reached. The results are shown below in Figure 32
| Structure | Total Energy ± 3.808x10⁻³ / Hatree | Log file of optimisation | Log file of frequency analysis | Jmol |
| Cis-butadiene | 0.049 | https://wiki.ch.ic.ac.uk/wiki/images/2/27/Bc608_BUTADIENE_AM1_OPT.LOG | https://wiki.ch.ic.ac.uk/wiki/images/7/7b/Bc608_BUTADIENE_AM1_FREQ.LOG | |
| Ethylene | 0.026 | https://wiki.ch.ic.ac.uk/wiki/images/f/f5/Bc608_ETHYLENE_AM1_OPT.LOG | https://wiki.ch.ic.ac.uk/wiki/images/9/98/Bc608_ETHYLENE_AM1_FREQ.LOG |
Figure 32: The optimised structures of Cis-butadiene and Ethylene
No negative frequencies were seen for the ethylene structure, confirming a minima had been reached. One negative frequency was seen however for the cis-butadiene at -36 cm-1. This frequency corresponds to rotation about the central C-C bond.
The negative frequency suggests that this conformer is a maxima, as would be expected due to the synperiplanar arrangement of atoms leading to significant A1,4 strain. However, this is not unexpected. One would expect cis-butadiene to be a maxima on the PES, one would also expect it to be the reactive conformation of the Diels Alder reaction. The two structures were then reoptimised using DFT-B3LYP/6-31G(d) calculations and frequency analysis was performed. The results are shown in Figure 33.
| Structure | Total Energy ± 3.808x10⁻³ / Hatree | Log file of optimisation | Log file of frequency analysis | Jmol |
| Cis-butadiene | -155.986 | https://wiki.ch.ic.ac.uk/wiki/images/c/c1/Bc608_BUTADIENE_B3LYP_OPT.LOG | https://wiki.ch.ic.ac.uk/wiki/images/a/aa/Bc608_BUTADIENE_B3LYP_FREQ.LOG | |
| Ethylene | -78.587 | https://wiki.ch.ic.ac.uk/wiki/images/3/3b/Bc608_ETHYLENE_B3LYP_OPT.LOG | https://wiki.ch.ic.ac.uk/wiki/images/8/86/Bc608_ETHYLENE_B3LYP_FREQ.LOG |
Figure 33: The optimised structures of Cis-butadiene and Ethylene
No imaginary frequencies were seen for ethylene and the cis-butadiene again showed one imaginary frequency corresponding to rotation about the central C-C bond.
Molecular Orbitals of Starting Materials
The Diels Alder reaction of cis-butadiene and ethylene is a pericyclic reaction, in which the π orbitals of ethylene (dieneophile) are used to form new σ bonds with the π orbitals of cis-butadiene (diene). Pericyclic reactions are governed by Woodward-Hoffman's rules[9]. The rules state that a cycloaddition involving 6π electrons will proceed suprafacially under heat.
The nodal properties of a system can be used in order to predict whether a reaction is allowed or disallowed.
- If the HOMO of one reactant can interact with the LUMO of the other reactant then the reaction is allowed.
- The HOMO and LUMO can only interact when there is significant overlap between the orbitals. If the orbitals have different symmetry properties then no overlap is possible and the reaction is forbidden.
Both cis-butadiene and ethylene have a mirror plane, about which their molecular orbitals must be symmetric..[9] Molecular symmetry results in orbital symmetry. This mirror plane is shown in Figure 34.
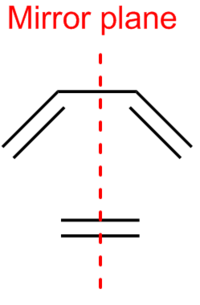
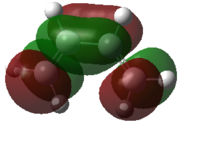
The calculated MOs of the starting materials are shown in Figure 35.
| Structure | HOMO | LUMO |
| Cis-butadiene | 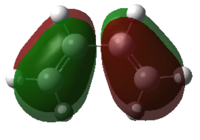 |
 |
| Ethylene | 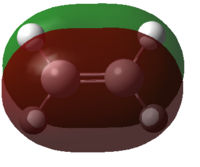 |
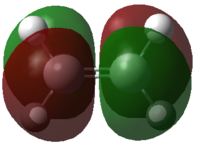 |
Figure 35: The calculated MOs of the starting materials at the DFT-B3LYP/6-31G(d) level of theory
It can be seen that the frontier molecular orbitals of ethylene and cis-butadiene are complementary. The HOMO of ethylene can interact with the LUMO of cis-butadiene and vice versa as the orbitals are of the same symmetry. Therefore, one would predict the cycloaddition reaction between these two starting materials to be allowed. In order to test this prediction, the molecular orbitals of the transition state must be examined. Before this can be done however, the transition state must first be optimised.
Transition State Optimisation
There is only one transition state of the Diels Alder reaction between ethylene and cis-butadiene. The σh plane of symmetry in both molecules means that attack from either the "top" face or "bottom" face is identical and thus endo and exo products do not exist. The transition state of the cycloaddition between ethylene and cis-butadiene has an envelope like structure in order to maximise overlap of the π orbitals. A sketch of the transition structure is shown in Figure 36.

This guessed transition state structure was drawn on Gaussview by first drawing a norbornene like structure shown in Figure 37.
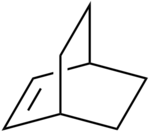
This initial norbornene structure was then optimised using semi-empirical AM1 calculations. The log file for this calculation can be found here: https://wiki.ch.ic.ac.uk/wiki/images/d/db/Bc608_NORBORNENE_PRECURSOR.LOG
The optimised structure can be seen here:
The bridging CH2-CH2 unit was then removed and the structure split into the two fragments that come together in the Diels Alder reaction. The distance between these two fragments was then set at 2.2Å. This process is shown in Figure 38.

The starting geometry for the transition state optimisation is shown here:
An optimisation to Berny Transition State was then performed using an AM1 semi-empirical calculation. The log file for the calculation can be found here. https://wiki.ch.ic.ac.uk/wiki/images/7/73/Bc608_BERNY_TS_OPT.LOG
The optimised transition state structure can be found here:
One negative frequency at 956cm-1 was seen, which corresponded to the Diels Alder Reaction.
The structure of the transition state was then reoptimised at the DFT-B3LYP/6-31G(d) level of theory. A log file for the optimisation can be found here: https://wiki.ch.ic.ac.uk/wiki/images/a/a4/Bc608_DFT_TS_OPT_ETHYLENEANDBUTADIENE.LOG
The optimised transition state structure can be found here:
One negative frequency at 525 cm-1 was seen, which corresponded to the Diels Alder Reaction.
It can be seen that the formation of both C-C σ bonds is synchronous and the reaction is a concerted process.
The lowest positive frequency was seen at 136 cm-1 and is shown:
The lowest positive frequency shows an asynchronous vibration. A positive vibrational frequency implies that displacements in the directions of these normal modes is uphill in energy and therefore unfavourable. During an asynchronous vibration, orbital symmetry about the plane is broken. This implies that the minimum energy pathway from the reactants through the transition state to the products involves retention of orbital symmetry throughout bond formation i.e. the bond formation is completely synchronous.
IRC of the Diels Alder Transition State
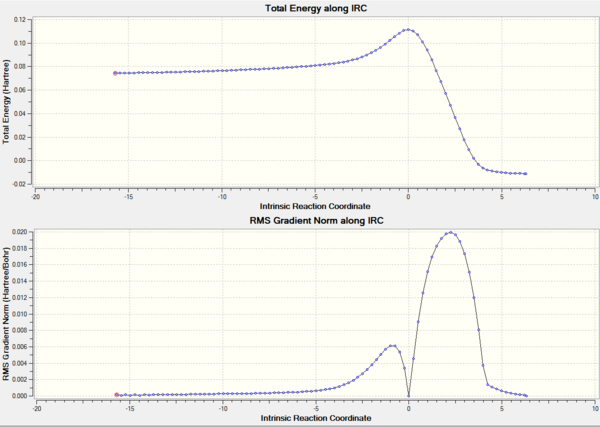
Now a transition state has been found, it's now important to prove that this transition states connects the two expected minima. An AM1 IRC calculation was performed on the AM1 optimised transition state structure. Force constants were calculated at every step and the IRC was calculated forwards and backwards. DOI:10042/to-8128
The IRC showed that the transition state connected the two following minima:
The IRC graphs are shown in Figure 39.
Molecular Orbitals of the Transition State
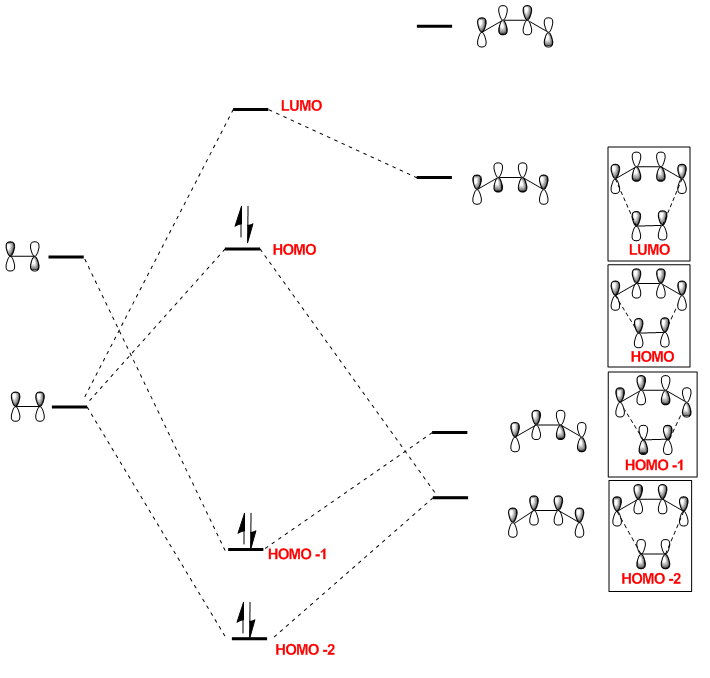
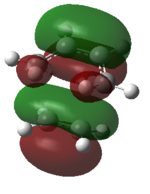
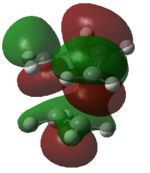
A molecular orbital diagram of the transition state is shown in Figure 40.
| Predicted MO from LCAO | Calculated MO |
 |
|
 |
|
 |
|
 |
|
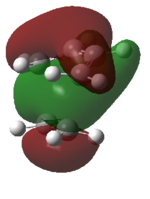
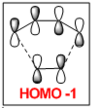
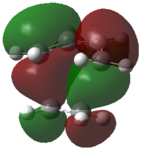
Figure 41: The calculated molecular orbitals of the transition state
The HOMO of the transition state is comprised of contributions from the HOMO of ethylene and the HOMO-2 of cis-butadiene and is symmetric with respect to the plane.
The LUMO of the transition state is comprised of contributions from the HOMO of ethylene and the LUMO of cis-butadiene and is also symmetric with respect to the plane.
The HOMO-1 of the transition state is comprised of contributions from the LUMO of ethylene and the HOMO of cis-butadiene. It is antisymmetric with respect to the plane.
Orbital symmetry has therefore been preserved from reactants to the transition state. Molecular orbitals that were symmetric in the reactants must be symmetric in the transition state.
The difference between expected molecular orbitals in the transition state and the calculated molecular orbitals can be attributed to secondary orbital mixing, which was disregarded in the simple Frontier Molecular Orbital picture. This explains why the ethylene HOMO gives character to more than one bonding and antibonding set of molecular orbitals.
The Woodward-Hoffman rules state that a 6π electron cycloaddition reaction will occur suprafacially via a Hückel transition state under thermal conditions. The molecular orbitals of the transition state show that the orbital overlap occurs via the one face of both the butadiene and ethylene components (i.e. the reaction is suprafacial) and thus the reaction is allowed.
Geometry of the Transition State
| Parameter | Value |
| C-C-C angle in butadiene fragment | 122.0 |
| C-C-C-C dihedral angle in butadiene fragment | 0.0 |
| C-C bond lengths | 1.39 (ethylene fragment), 1.38 (terminal C-Cs of butadiene fragment) and 1.41 (central C-C of butadiene fragment) |
| C-H bond lengths | 1.09 |
| Bond forming/breaking distance | 2.26 |
Figure 42: A table to show the geometrical parameters between the optimised transition state. All angles are in ° and are accurate to ± 0.05. All bond lengths are in Å and are accurate to ±0.01
Typical C-C bond lengths are shown in Figure 43.
| Parameter | Length /Å |
| Typical sp3 C-C bond length | 1.53 [10] |
| Typical sp2 C-C bond length | 1.33[11] |
| Van der Waals Radius of Carbon | 1.70[12] |
Figure 43: A table to show literature values for some parameters
The bond breaking/forming lengths are significantly shorter than twice the Van der Waals radius of carbon (3.40Å), therefore there must be an attractive interaction in between the carbons involved in bond forming and bond breaking. However, this bond length is still larger than the typical C-C σ bond length, therefore the bond has not yet fully formed.
The central C-C bond of butadiene is showing significant double bond character and is shorter than typical C-C σ bond lengths (1.41Å cf. 1.53Å) but longer than typical C-C double bond lengths (1.41 cf. 1.33Å). The length of the central C-C bond however is still longer than the terminal C-C bonds, suggesting it has less double bond character than the terminal C-C bonds. Therefore, the transition state is likely to be a relatively early transition state, because the transition state resembles the reactants more than the products.
Activation Energy
In order to calculate the activation energy for the Diels Alder reaction, the energies of the reactants were summed to give the energy of reactants. This value was then subtracted from the energy of the transition state. This calculation is valid because the transition state and the separate reactants only differ by their spatial separation. For butadiene, the energy of the most stable conformer was used (trans-butadiene).
The summed reactant energies totalled -234.580 Hartree.
The activation energy is therefore 95.1 KJ mol-1 at 0 K.
Diels Alder reaction of Malelic anhydride and Cyclohexa-1,3-diene
Optimisation of transition states
Malelic anhydride and cyclohexa-1,3-diene were optimised using semi-empirical AM1 calculations. These structures were then used to draw a guessed structure of the exo and endo transition states. Centres that were to become sp3 in the product were made sp3 like in the transition state by setting relevant angles to 109.5°. Groups that sterically clashed were bent away from each other. These guessed exo and endo transition state structures were then optimised to a Berny transition state at the AM1 level of theory. Once found, the transition states were reoptimised using a DFT-B3LYP/6-31G(d) calculation. The starting materials were then also reoptimised at the higher level of theory. Figure 44 shows the results of the transition state optimisations.
| Structure | Starting Geometry | Log file of the AM1 optimisation | Log file of the DFT-B3LYP calculation | Structure of TS at the DFT-B3LYP/6-31G(d) level of theory | Energy / Hartree |
| Endo Transition State |
|
DOI:10042/to-8145 | DOI:10042/to-8135 |
|
-612.68339680 |
| Exo Transition State |
|
DOI:10042/to-8146 | DOI:10042/to-8147 |
|
-612.67931095 |
Figure 44: A table to show the results of the transition state optimisations
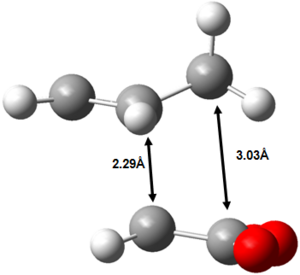
The endo form is 10.7 KJ mol-1 more stable than the corresponding exo form at the DFT-B3LYP/6-31G(d) level of theory. This may be initially somewhat surprising, considering the endo form is more strained than the exo form. The main contribution to this difference in strain is shown in Figure 45.
 |
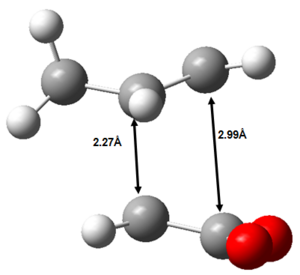 |
Figure 45: The source of increased strain in the endo transition state.
It can be seen that the two fragments are brought closer together in the endo transition state than in the exo transition state and thus the endo transition state is more strained. Despite the endo transition state being sterically more strained, it is nevertheless more stable than the exo transition state. Therefore, there must be a dominating, stabilising electronic effect operating that stabilises the endo transition state more than the exo transition state.
IRC analysis of transition states
Now the exo and endo transition states have been found, an IRC calculation must be performed to see which minimas the transition states connect. An AM1 IRC calculation was performed on the AM1 optimised structures, with the Hessian recalculated at every IRC iteration. The IRC calculations were performed both forwards and backwards.
IRC analysis of the endo transition state DOI:10042/to-8189 was found to connect the to the
IRC analysis of the exo transition state DOI:10042/to-8190 was found to connect the to the
Electronic stabilisation: Secondary orbital overlaps?
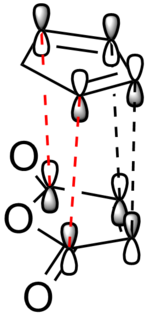
In order to explain the stability of the endo transition state, often "secondary orbital overlaps" in the transition state are invoked. The proposed orbital overlaps in the transition state are shown in Figure 46.
 |
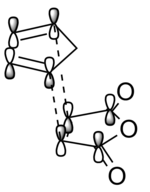 |
Figure 46: The "textbook" orbital overlaps that result in the stabilisation of the endo transition state. Red dotted lines denote secondary orbital interactions, whereas black dotted lines denote primary orbital interactions.
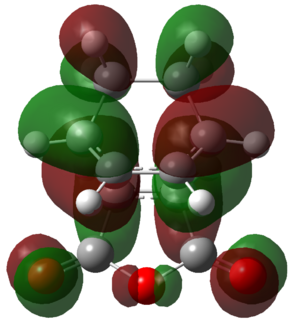
The molecular orbitals of the two transition states were generated in order to attempt to visualise this secondary orbital overlap effect. The HOMOs of the transition states are shown in Figure 47.
 |
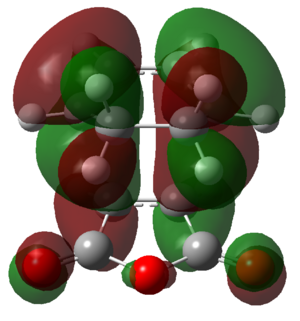 |
Figure 47: The HOMOs of the exo and endo transition states
Careful examination of the HOMOs shows that there is no contribution from the carbon based carbonyl pZ orbitals in the HOMOs of either transition state. Therefore, if the secondary orbital overlap effect does exist, it must exist in a different molecular orbital. Examination of the LUMO+2 of the endo transition state does show a secondary orbital overlap effect. This is shown in Figure 48.
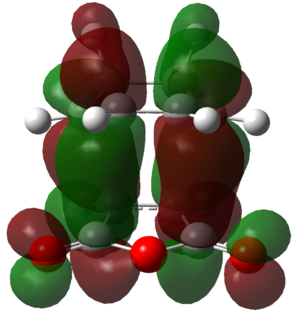 |
Figure 48: The LUMO+2 of the endo transition state
Overlap can be seen between the carbon based carbonyl pZ orbitals with the diene based carbon pZ orbitals. These secondary orbital overlaps are not present in the LUMO +2 of the exo transition state as shown in Figure 49.
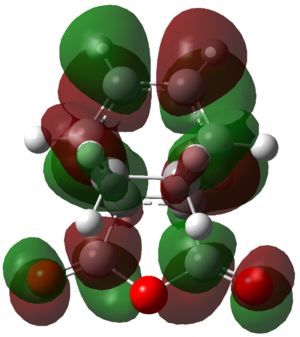 |
Figure 49: The LUMO+2 of the exo transition state
The secondary orbital overlap effect in the LUMO+2 appears to be stabilising the endo transition state significantly. This initially seems somewhat confusing. Molecular orbital theory tells us:
- The LUMO+2 is unfilled according to the Aufbau principle.
- Only the stabilisation of occupied orbitals confers electronic stability upon a molecule.
If statements 1 and 2 are correct, then stabilisation of the LUMO+2 should be irrelevant and there should be no electronic stabilisation of the endo transition state. However, this is not what is observed computationally, therefore one of the two statements must be incorrect, implying molecular orbital theory is a simplification of reality.
If we look again at the Aufbau principle, it implies that molecular orbitals are either filled, half filled or completely unfilled. In other words, the orbital occupancy is either 0, 1 or 2 electrons. This essentially gives a "black" or "white" picture of orbital occupancy. Things are very rarely "black" or "white" in reality and are more often than not one of the many shades of grey in between.
Molecular orbitals can be thought of as electronic degrees of freedom of the system that arise as solutions to Schrödinger's equation. An analogy can be drawn between molecular orbitals and normal modes of vibrations - they are both degrees of freedom of the system. Electrons are distributed amongst the degrees of electronic freedom, just as vibrational energy is distributed amongst the normal modes. The LUMO+2 is an electronic degree of freedom of the endo transition state. Therefore, there is a probability associated with the LUMO+2 degree of freedom being occupied - it may be large, but it is not necessarily zero. The LUMO+2 will therefore be partially occupied in both transition states. Orbital occupancy should therefore not be thought of digitally as either 0, 1 or 2.
This partial occupancy of the LUMO+2 must exist in both transition states for the endo TS to be electronically more stable than the exo TS. The LUMO+2 is more stable for the endo transition state because it puts electron density between the two fragments that are coming together.
Conclusions
There is a partial occupancy of molecular orbitals above the HOMO and orbital occupancy can not be thought of digitally. A secondary orbital overlap effect exists in the partially occupied LUMO+2 of the endo transition state, which stabilises the endo transition state electronically. The secondary orbital overlap effect does not exist in the LUMO+2 of the exo transition state. The difference in electronic stabilisation is greater than the difference in steric destabilisation. The endo transition state is more strained yet is overall more stable.
These calculations however have completely ignored the possibility of solvent stabilisation of the exo and endo transition states, as they have been performed in the gas phase.
| Transition State | Dipole moment ± 0.005 / Debye |
| Endo | 6.72 |
| Exo | 6.14 |
Figure 50: The dipole moment of the exo and endo transition states
The Hughes-Ingold rules [13] states that an increase in solvent polarity will accelerate the rates of reactions where there is a build up of charge in the activated complex. The endo transition state has a higher dipole moment than the exo transition state and is therefore possibly more polar. One might therefore expect the endo product to be favoured by polar solvents, whereas the exo product would be favoured by non polar solvents. Further calculations would be required in order to test this hypothesis however.
References
- ↑ W. von E. Doering and W.R. Roth, Angewandte Chemie 1963, 75, 27
- ↑ 2.0 2.1 2.2 2.3 2.4 M. Bearpark, Imperial College Computational Lab Materials 2011, https://wiki.ch.ic.ac.uk/wiki/index.php?title=Mod:phys3 accessed 22/03/11
- ↑ A.J. Kirby in Stereoelectronic Effects (Oxford Chemistry Primers), Oxford University Press, 1996
- ↑ I.V. Alabugin and T.A. Zeidan, Journal of the American Chemical Society 2002, 124, 3175 - 3185 DOI:10.1021/ja012633z
- ↑ H. Rzepa, Imperial College London Lecture Course Materials, Year 2: Conformational Analysis 2010, http://www.ch.ic.ac.uk/local/organic/conf/ accessed 22/03/11
- ↑ L.L. Thomas, T.J. Christakis and W.L. Jorgensen, Journal of Physical Chemistry B 2006, 110, 21198–21204 DOI:10.1021/jp064811m
- ↑ B.W. Gung, Z. Zhu and R.A. Fouch, Journal of the American Chemical Society 1995, 117, 1783-1788 DOI:10.1021/ja00111a016
- ↑ M.J. Goldstein and M.S. Benzon, Journal of the American Chemical Society 1972, 94, 7147 DOI:10.1021/ja00775a046
- ↑ 9.0 9.1 R.B. Woodward and R. Hoffmann, Angewandte Chemie International Edition 1969, 8, 781-853 DOI:10.1002/anie.196907811
- ↑ F.H. Allen, O. Kennard, D.G. Watson, L. Brammer, A.G. Orpen and R. Taylor, Journal of the Chemical Society, Perkin Transactions 1987, 2, S1-S19 DOI:10.1039/P298700000S1
- ↑ Wade, L.G. in Organic Chemistry, 2006, 6th edition, Pearson Prentice Hall, 279
- ↑ A. Bondi, Journal of Physical Chemistry 1964, 68, 441-451 DOI:10.1021/j100785a001
- ↑ C.K. Ingold in Structure and Mechanism in Organic Chemistry, 1953, Comell University: Ithaca, NY
