Rep:Ar3015TS
Transition Structures Wiki Report
Introduction
A potential energy surface describes the energy of a reaction using energy and distance between the different atoms involved in the reaction. The number of dimensions of the potential energy surface is 3N-6 where N is the number of atoms. On the lowest energy path between the reactants and products there is a saddle point. The structure at this point is defined as the transition state. As the transition state is a maximum in a minimum energy pathway, the transition state is actually only a maximum in one dimension and a minima in the others. This is the origin of the imaginary frequency that can be found in the transition states which implies a negative force constant. This imaginary frequency represents the vibrations of the bonds that are forming (this can be demonstrated in exercise 1). It can often be difficult to find the transition state in a reaction and computational chemistry advancements mean that this is now possible with simple systems. This is done using basis sets. The two basis sets used in this experiment were DFT and PM6. A basis set is a set of basis functions that represent the wave-functions of electrons. PM6 is a semi-empirical method meaning that it is based on the Hartree-Fock method. However, it also uses empirical information hence the name semi-empirical. It is useful for reducing the costs of calculations on large molecules but also faces the problem of not producing accurate data if there isn't data available for similar molecules. Density functional theorem builds upon the Hartree-Fock method. All of the reactions in this experiment are examples of pericyclic reactions, demonstrating Diels-Alder reactions and cheletropic reactions. Both of these reactions follow symmetry rules for the reaction to take place.
Nf710 (talk) 22:57, 29 November 2017 (UTC) This is a nice conside intro. Carefulll though basis sets are different to levels of theory such as PM6 or DFT. Basis sets are what we use to mould the orbitals with. where as level is theory is the maths behind how we do that. a higher basis mean it it able to get close to the exact orbital
Exercise 1
Reaction introduction and reaction scheme
This reaction shows the classic example of a Diels-Alder reaction with normal electron demand. Diels-Alder reactions are favourable due to the aromatic transition state. There is only one potential product in this reaction as both the exo and endo products are the same.

Cyclohexene Transition State MO Diagram
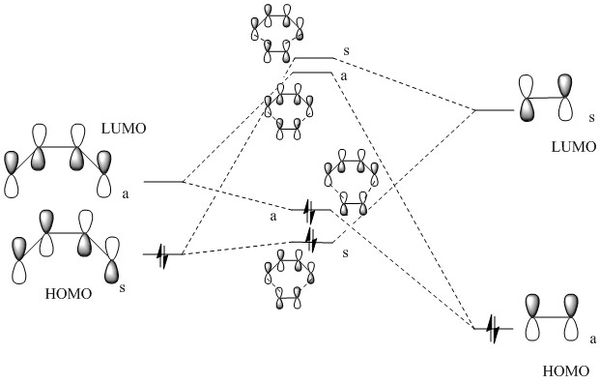
The MO diagram shows that there are only symmetric-symmetric interactions and antisymmetric-antisymmetric interactions. This is derived from group theory. For antisymmetric-symmetric reactions, the orbital overlap integral is 0. With A-A and S-S overlaps, the orbital overlap integral is non-zero so MOs can be formed producing 'bonding' and 'anti-bonding' orbitals. As the MO diagram shows the transition state instead of the product, even the bonding orbitals formed are higher in energy than the reactants. This is because the Transition State is the highest energy point of the reaction.
(Fv611 (talk) Your main mistake here is having symmetric and antisymmetric the wrong way around. Additionally, you have not paid close attention to the energy of your calculated MO. The energy gap between your butadiene HOMO and LUMO is 0.046, whereas the difference between the TS LUMO and the butadiene LUMO is only 0.006, but you have drawn the latter as larger than the former. Additionally, you have not correlated the TS MO in the table below with those in your diagram.)
Cyclohexene Transition State Corresponding MOs
| HOMO-1 | HOMO | LUMO | LUMO+1 | ||||||||
|---|---|---|---|---|---|---|---|---|---|---|---|
| Butadiene HOMO | Butadiene LUMO | Ethene HOMO | Ethene LUMO | ||||||||
|---|---|---|---|---|---|---|---|---|---|---|---|
Bond Lengths
| Products | Transition State | Ethene | Butadiene | Comments | |
|---|---|---|---|---|---|
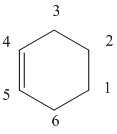
| C 1-2 | 1.50091 | 1.38175 | 1.32737 | - | The bond length for the product correlates with an sp2 bond length of 1.50 Å which agrees with the expected bond length. |
| C 2-3 | 1.5404 | 2.11469 | - | - | The transition state bond length is very long as there is new bond formation. |
| C 3-4 | 1.5009 | 1.37976 | - | 1.33539 | The bonds are going from sp2 to sp2-sp3 so the bond length increases. |
| C 4-5 | 1.33784 | 1.4111 | - | 1.46834 | Here the bond is longer than expected from an sp2-sp2 but this is because it is a single bond not a double bond. The bond length, however, still decreases as a double bond is formed. |
| C 5-6 | 1.5009 | 1.37976 | - | 1.33539 | The bonds once again are going from sp2-sp2 to sp2-sp3 so the bonds lengthen. |
| C 6-1 | 1.5404 | 2.11473 | - | - | The bonds during the transition state are one of the longest as new bonds are being formed. These then decrease when the new bonds have formed. |
According to literature, an average bond length for sp2-sp2 bonds is 1.34 Å and sp3-sp3 bond lengths have been stated as being 1.54 Å. The van der waals radius for a carbon atom is 1.7 Å. At 2.11 Å, the bond length for the partially formed C-C bond is even longer still than the van der waals radius.
(Fv611 (talk) The above doesn't make sense: you are saying that the length of the partially formed bonds at the TS is larger than the distance of two unbonded carbons. The VdW distance between two equal element atoms is twice the VdW of that element.)
Bond Formation Vibration
The vibration shown is imaginary as it is showing the bond formation (which hasn't fully formed yet). It can be seen that both imaginary bonds show the vibration at the same time meaning that the bond formation is synchronous.
The fact that the vibration is imaginary can be verified by looking at the plane of the vibration. The plane of the imaginary vibration is in a different plane to the real vibrations.
Exercise 2
Reaction introduction and reaction scheme
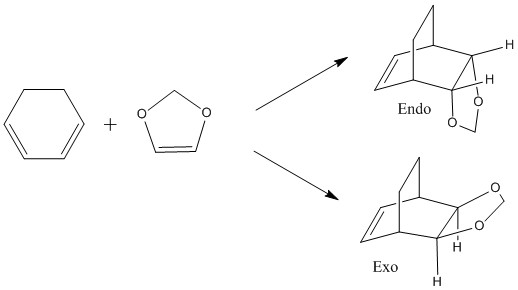
This reaction shows an inverse electron demand Diels-Alder reaction. In this case, an electron rich dienophile and electron poor diene participate in the reaction. It can be seen in the MO diagram below that the HOMO of the dienophile and the LUMO of the diene overlap. As they're at almost the same energy, there is a very strong splitting lowering the overall energy of the molecule.
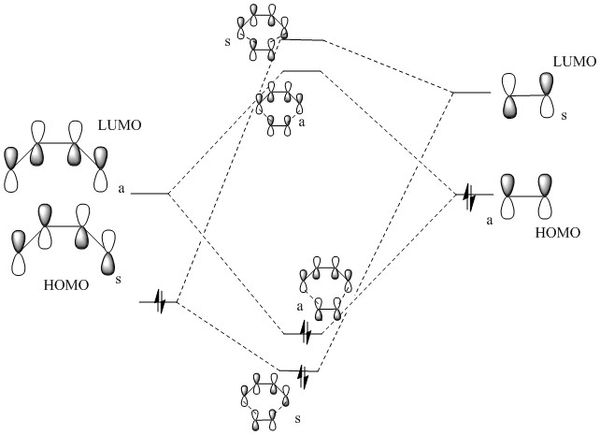
It can be seen that the MOs in the inverse electron demand Diels-Alder are reversed compared to the MO diagram in exercise one. All of the orbitals are still in the same order, however, there is much greater splitting between the dienophile HOMO and the diene LUMO. This is because the energy of the dienophile has been raised as it is no longer electron deficient and the electron density is higher, raising the energy of all of the dienophile MOs.
(Fv611 (talk) Again, you have the symmetries the wrong way around, and you haven't correlated the MOs in your table with your diagram. Additionally you have not placed the TS MOs according to their relative energies (both bonding TS MOs are higher in energy than the diene's HOMO, and both the antibonding MOs are lower in energy than the dienophile's LUMO). You also say that these orbitals are in the same order than in Exercise 1, but this isn't true: compare the lowest energy HOMO and the highest energy LUMO for both cases, and you will see that they are not the same.)
Orbitals involved in DA reaction
Endo TS
| HOMO-1 | HOMO | LUMO | LUMO+1 | ||||||||
|---|---|---|---|---|---|---|---|---|---|---|---|
Exo TS
| HOMO-1 | HOMO | LUMO | LUMO+1 | ||||||||
|---|---|---|---|---|---|---|---|---|---|---|---|
Thermochemistry values
| Reaction Barrier (kJmol-1) | Reaction Energy (kJmol-1) | |
|---|---|---|
| Endo | 149.7 | 77.5 |
| Exo | 157.5 | 73.9 |
By looking at the reaction energy (difference between the reactants and products energy) that there is a greater difference between the reactants and endo product as the endo product is now more negative than exo in energy meaning it is the thermodynamic product. It can also be shown that it is the kinetic product as there is a smaller difference between the reactants and endo transition state than between reactants and exo transition state. This means the transition state is lower in energy and therefore this product is more quickly formed, meaning the endo is the kinetic product.
Secondary orbital interactions in this reaction
Primary orbital overlaps are those seen where a bonding pair are formed (bonding orbital and antibonding orbital). Secondary orbital overlaps are extra interactions between orbitals of the same phase that stabilise the molecule overall. In this reaction, examples of secondary orbital overlaps can be seen between the O p orbitals and the alkene HOMO. This is seen in the endo product for the diels-alder reaction, and not the exo product. This is the kinetic product because of the secondary orbital interactions as the transition state is lower in energy so the product is formed faster.
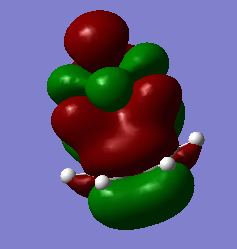
This MO is from the transition state. Here it can be seen that the oxygen P orbitals are overlapping with the alkene π orbital. This adds extra stabilisation, lowering the endo transition state. This agrees with the values in the thermochemistry section. It is possible to compare the endo and exo product thermochemical values as the B3LYP basis set was used.
Nf710 (talk) 23:10, 29 November 2017 (UTC) You havent said what level of theory you are using and you have missed out the minuses on the reation energy. You also could have gone into more detail about the electron demand of this reaction. But you have come to the correct conclusions and given some valid arguments aboout what is the kenetic or thrmo product.
Exercise 3
Reaction introduction and reaction scheme
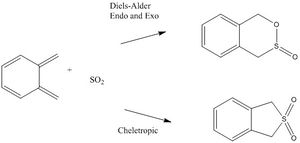
Examples of Diels-Alder with both the exo and endo products have been shown in the last two exercises. In this exercise, cheletropic reactions are explored as well. Cheletropic reactions are a separate sub section of pericyclic reactions where two single bonds are formed or broken at a single atom.
Thermochemistry
| Reaction Energy (kJmol-1) | Reaction Barrier (kJmol-1) | |
|---|---|---|
| Endo | -100.2 | 80.6 |
| Exo | -100.8 | 84.6 |
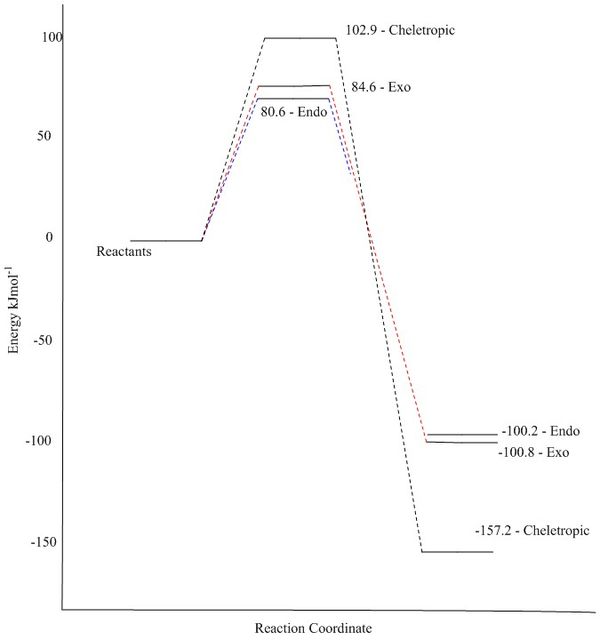
| Cheletropic | -157.2 | 102.9 |
As the PM6 basis set was used for this reaction, it is fairly accurate to compare the order of the different transition states and products. However, due to the semi-empirical nature of this basis set, these values are not absolute and are only relatively accurate to one another. The endo is once again the kinetic product, having the lowest transition state energy. The thermodynamic product is the cheletropic product.
(PM6 is not a basis set. It's a semi-empirical method with its own inbuilt basis set. It is also not very accurate for relative energies Tam10 (talk) 12:07, 24 November 2017 (UTC))
IRCs for 3 reactions
 |
 |
 |
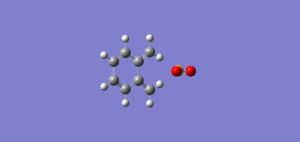
Click to see the animation of the IRC gifs It can be seen in the animation in Figure 8 that the aromatic ring forms before the two sigma bonds to the sulfur. This is because the o-Xylylene is highly unstable and it is favourable for o-Xylylene to aromatise to the very stable energy as quickly as possible.
Reaction profile
This is a graphical representation of the data shown in the Thermochemistry section above.
Files
File:SO2 NAPTH TS ENDO 1.LOG - Endo TS
File:SO2 NAPTH TS 2.LOG - Cheletropic TS
File:SO2 TS NAPTH DIELS 1.LOG - Exo TS
File:CHELOTROPIC PRODUCT.LOG - Cheletropic product
File:ENDO PRODUCT.LOG - Endo product
File:EXO PRODUCT.LOG - Exo product
Conclusion
After comparing the MOs produced from these calculations with the MO diagrams and the expected MOs, it can be seen that the Diels Alder reaction calculations are fairly reliable as there is a strong match between the two. This is also shown by the Thermochemistry values as the the endo product is expected to be the kinetic product in both cases which it is. As it can be shown for this reaction that the computational methods are reliable and so can be used to predict reactions in the lab, the kinetic product, thermodynamic product and therefore potential yields.
