Rep:Ar3015MgO
MgO Report - Antonia Reeves
Abstract
The thermal expansion coefficient for MgO was investigated using a quasi harmonic approximation and molecular dynamics methods. In the region 0-300 K, the QHA gave a value of and molecular dynamics gave a value of . In the region 300-1300 K, QHA gave a value of and molecular dynamics gave a value of . In the lower temperature region, the QHA was found to be a better approximation and closer to literature. In the higher region, molecular dynamics was found to be a better approximation.
Introduction
In chemistry, it is much easier to treat crystals as rigid structures with set lattice points in unit cells. This can often hold as a good approximation at very low temperatures. However, this is obviously not the case. There are many different vibrations happening throughout the lattice structure leading to thermal expansion. These vibrations can be quantified by using a wave vector - this gives the direction of the propagation of the wave in reciprocal space. To represent reciprocal space, the inverse of the lattice parameter, a, can simply be taken . This means that the x axis of dispersion plots (k) is simply multiples of a. As MgO is a cubic structure, the lattice parameter is the length of the side of a unit cell. This is calculated by taking the cube root of the volume of the conventional unit cell. This report investigates the effect of temperature on vibrations and size of the lattice structure of MgO. The lattice structure of MgO is face centred cubic.
Phonons and phonon dispersions
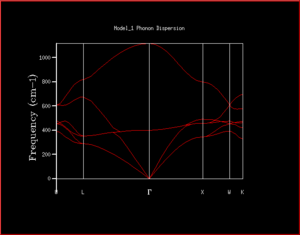
In quantum chemistry, vibrations can be treated as both particles and waves. When treating vibrations as particles - just as particles of light are photons - they are called phonons. This can be used and a plot of frequency against wave vector can be generated. This effectively gives a plot of the energy against the 'the way that vibrations move' which is the k vector. As the phonon dispersion plot investigates the different ways vibrations can take place in the same time, if there were for example only a few atoms, this would give rise to only a few different k points. However, as an infinite lattice is being used, instead of giving quantised k points, a continuous line of k points can be generated, giving rise to a band. One band is called a branch. The number of branches is dependent on the number of different atoms in the lattice. In MgO lattice there are 2 atoms. Using the equation 3N (not 3N-6 as this takes into account rotational and translation degeneracy for single molecules that don't need to be considered for crystal vibrations) where N is the number of different atoms, this gives 6 branches which can be seen in the phonon dispersion plot in Figure 1. Using the dispersion plots are useful for seeing the frequency vs k vector as a whole, however, makes it difficult to determine pieces of information such as how many states are at a given frequency, and whether there is a direct or indirect band gap. This is simply one way of displaying all of the data - the same data can be displayed as a density of states. Instead of simply giving the angular frequency as a function of the wave vector, a plot of density of states can also show how many states have a given energy at each k vector point. This can show the energy difference in the band gap, and the most densely populated k-states more easily. In order to visualise the density of states, the phonon dispersion is 'chopped up' into sections. The number of sections is determined by the grid size (these parameters can be changed in the GULP execution panel. In this, the frequencies at the edge of the grids are taken and plotted (only one side as not to repeat the counting of the frequencies). The higher the grid size, the greater the accuracy of the density of states as this allows a greater number of wave vectors to be sampled. The value of the grid size is called the shrinking factor.
Thermal Expansion Coefficient
Using the equation gives the thermal expansion coefficient. This value represents how much a given crystal expands with an increase in temperature. The term to normalises this value so it can be applied to a crystal of any size which is composed of the same crystal. Below, the different computational methods that can be used to investigate how these properties change with temperature are used.
Software used
DLVisualise is the programmed used for modelling crystals in simulations such as this and allows chemists to visualise properties of crystals such as vibrations, energy, volume and calculates these using wavefunctions of crystals. GULP lets the particular codes for the simulations to be accessed for running simulations. GULP is better for quantum based calculations such as lattice dynamics over molecular dynamics. However force fields for molecular dynamics can still be used and calculate values to output thermodynamic data.
Harmonic and Quasi-Harmonic approximations
The harmonic oscillator is simply a taylor expansion of the anhmarmonic potential. The harmonic oscillator takes the third term (quadratic term) giving the harmonic oscillator parabola. When looking at harmonic potential energies, as the temperature is changed, the average bond length stays at an equilibrium point and therefore the volume of the crystal doesn't change. This means that although this approximation works well at lower temperatures as there is little change in volume at low temperatures in reality, at higher temperatures, harmonic and anharmonic (which is a much more realistic model) deviate a lot, giving unreliable data for higher temperatures. The harmonic potential isn't a very useful approximation for this experiment as it only uses 3 terms from the taylor series expansion and doesn't consider bond extension but by comparison the anharmonic potential is expensive and time consuming. This leads to using a quasi-harmonic approximation as a compromise. In the helmholtz free energy equations, the differences in the equations for harmonic and quasi-harmonic plots are in the frequency term. In a harmonic system, equation 3 would be used as the potential. However as the quasi harmonic system is being examined, within the brillouin zone equation 1 can be used.
(Eq. 1)
(Eq. 2)
(Eq. 3)
Helmholtz Free Energy

A = U - TS
In order to look at the energy of the vibrational modes, the vibrational contribution to the entropy is used considering statistical thermodynamics and the partition coefficient. The first term of equation 4 is the internal energy, the second term is the zero point energy (energy at 0K) and the final term is the statistical thermodynamics contribution - the contribution to the energy from the different vibrations. This equation can be derived by using the partition function to derive the entropic term as shown in equation 5.

Molecular Dynamics
The molecular dynamics method takes the values from the ideal MgO crystal, then when the parameters are changed, random velocities are generated. This process is repeated at each time step (each a microstate) then all of the microstates are averaged. An average of all of the microstates is carried out, when enough microstates have been sampled, they start to converge and properties of the crystal can start to be measured such as energy and volume. One of the main differences between the quasi-harmonic approximation and molecular dynamics is that quasi-harmonics uses quantum mechanics to calculate the volumes (the change in bond length) and molecular dynamics uses classical mechanics. When sampling a configuration, there needs to be enough time for the values to converge. This is where the length of the timesteps come into play - getting a more accurate value means that the calculations will take much longer and therefore be more expensive.
Method
For all of the calculations, the GUI DLVisualise was used. For all calculations, the execute GULP panel was brought up and in the GULP potential parameters, ionic.lib was used and include shells was not included.
Lattice vibrations -Computing the phonons
Single point was selected, and then run was pressed. Once the job has completed, this shows in the job list and the files were recovered. The energy could be found in the log file under Total Free Energy.
Calculating the free energy in the Harmonic approximation
Single point was selected. Under General Opts, phonon dispersion was selected with N points set to 50 and calculate phonon eigenvectors was selected, so that specific points in k-space (relating to the origin, x direction vectors being in phase etc.) are represented with greek letters. The files were recovered and the phonon dispersion was displayed using the 1D data display.
Thermal expansion of MgO
The settings used for this calculation were, select phonon DOS, change shrinking factor to 20x20x20 and set the temperature from 0-3000 K in 100 K intervals. For each temperature, the free energy and lattice volume were taken from the log file. The volumes were multiplied by 4 as the volume given in the log file is the primitive cell volume. This is also required to calculate the lattice parameter which is simply the cube root of the volume of a conventional cell.
Molecular Dynamics
For Molecular dynamics, a super cell which is twice the length on every side of the cell was used. This is so the cell is larger and is more similar to 'an infinite lattice'. Molecular Dynamics option was selected on the execute panel, the NPT ensemble was chosen, the time step used was 1 femtosecond, equilibration steps of 500, production steps was set to 500 steps and sampling steps and trajectory write steps were set to 5. The temperature used went from 100-3000 K with 100 K interval steps. As the volume of the cell is different to the cell used in the quasi-harmonic approximation, the cell volume taken from the log file (the last average cell volume), the volume was divided by 8 to get the same volume as the conventional cell.
Results and discussion
Phonon Modes of MgO
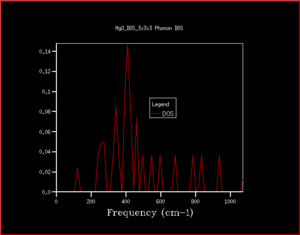
When the density of states are calculated for a single k point, it can be worked out by examining the phonon dispersion which k point this is. In this case, the 1x1x1 shows the k point L as there are only 4 peaks (2 that have double the intensity due to the double degeneracy) and at L there are only 4 branches where 6 would normally be expected (due to 3N to calculate number of vibrational branches expected). This can also be seen by comparing the frequencies of the peaks in the 1x1x1 DOS and the frequency of the 4 branches at L. This can be checked in the log file as although the character L is useful for helping us to determine the symmetry of the modes of vibrations, it's always useful to numerically quantify values. This is simply in the row 'K point' where the K point is 0.5. It's important that it can be viewed in the log file as on the phonon dispersion, only greek characters which represent different k points can be seen and it's not always obvious what numerical value goes with each character.
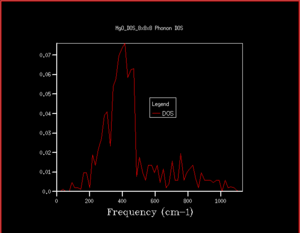
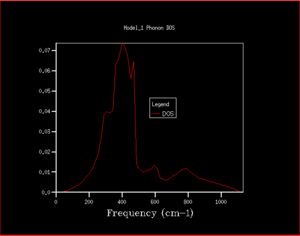
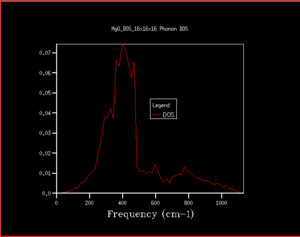
As can be seen from the progression in grid size that as the grid size increases, although the peaks with the greatest intensity stay in the same place, the shape of the density of states becomes much more defined and includes information on the states at k-points even where there is a lower number of states. When looking at the difference between grid sizes qualitatively, there isn't much of a difference between 8x8x8 and 32x32x32 apart from there is a more continuous curve with the same shape. It seems that a grid size of approximately 12x12x12 would be the minimum grid size as this is the grid size at which all k points are sampled and there aren't k-points with an angular frequency of 0 which then have non-zero values of angular frequencies at higher grid sizes. However, when deciding quantitatively, the convergence of the free energy can be used. At 20x20x20 and 6 decimal places, the free energy converges suggesting this is the optimum grid size to use. The density of states in terms of the phonon dispersion curve is basically plotting how many k points there are per value of angular frequency. This can be seen more easily by placing them side by side as seen in Figure 7

| Grid size | Free energy (eV) |
|---|---|
| 1 | -40.930301 |
| 2 | -40.926609 |
| 3 | -40.926432 |
| 4 | -40.92645 |
| 5 | -40.926463 |
| 6 | -40.926471 |
| 7 | -40.926475 |
| 8 | -40.926478 |
| 12 | -40.926481 |
| 16 | -40.926482 |
| 20 | -40.926483 |
| 32 | -40.926483 |
As having a higher shrinking factor takes longer and more processing power (leads to being more expensive), choosing the shrinking factor becomes a compromise between time and accuracy. As can be seen in table 2, after the grid size is 20x20x20, the values have converged and don't change (when looking at 6 decimal places, it may be changing beyond 6 decimal places). This is optimal as it reduces the computing power needed for a calculation whilst retaining almost the same level of accuracy. Using a grid size of 3x3x3 will gives a suitable energy for calculations accurate to 1 meV, grid size of 3x3x3 gives a suitable energy for calculations accurate for 0.5 meV and a grid size of 5x5x5 gives a suitable energy for calculations accurate to 0.1 meV. When deciding on a suitable shrinking factor, it can be useful to consider the lattice parameter. k is simply a function of the lattice parameter where it is represented as a. As the size of a increases, a decreases because of the inversely proportional relationship. In CaO, this lattice structure also has a face centred cubic structure and a similar lattice parameter meaning a similar shrinking factor would be suitable for CaO for the types of calculations carried out in this investigation. The lattice constants shown in this experiment for MgO are around 4 Å. For Faujasite, this has a lattice parameter of around 24-25 Å. As a is much larger, will be much smaller, meaning a smaller grid size is required. Lithium is the smallest metal in the periodic table. This suggests that it would also have a very small lattice parameter too. If a is small, then a will be large, meaning a large grid size.
Quasi-Harmonic Thermal expansion and Molecular Dynamics
 |
 |
|---|
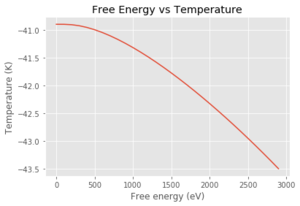
In Figure 9, it can be seen that the free energy is constant, then almost linearly decreases. At very low temperatures, the only main contribution to the free energy is the zero point energy as this is temperature independent. If it is assumed that the internal energy doesn't change much with temperature, then the TS term will increase in magnitude and decrease the overall free energy term. By looking at equation 4, the vibrational contribution term (also entropic term) is a ln term which will be negative, and again, decrease the overall free energy with an increase in temperature.
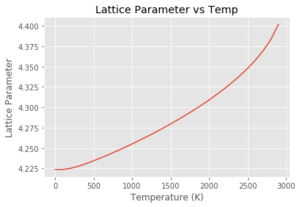
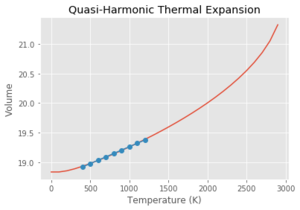
In the graph of lattice parameter vs temperature, the lattice parameter is initially constant and then increases linearly, then exponentially. Using the quasi-harmonic approximation, this gives the potential a 'quasi-anharmonic' shape, meaning that the bond length will actually change with temperature but will just never reach the point where it breaks. Although this doesn't allow phase transitions to be investigated, it does allow the lattice parameter as a function of temperature to be investigated. DLVisualise and GULP doesn't actually allow simulations past 3000 K because of the infinitely increasing potential.
| Temperature range (K) | Thermal expansion coefficient - Quasi-Harmonic | Thermal expansion coefficient - Molecular Dynamics | Thermal expansion coefficient - Literature |
|---|---|---|---|
| 0-300 | |||
| 300-1300 |
 |
 |
 |
 |
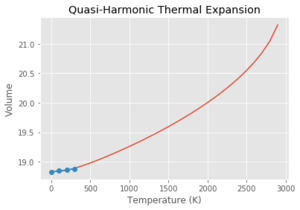
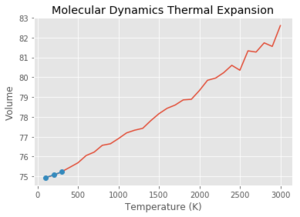
Using the Quasi Harmonic approximation, and fitting the data to get a line of best fit with a gradient of which is equivalent to . Multiplying by the reciprocal of the initial volume of the crystal, gives a thermal expansion coefficient for the region of 300-1300 K of . This process was then repeated with each of the graphs seen above. As can be seen from Table 3, at lower temperatures, the quasi-harmonic approximation gives a value closer to literature. This is because the quasi-harmonic approximation takes into account the zero point energy at lower temperatures which is the main contributing factor whereas molecular dynamics method doesn't, giving a linear line much like the second temperature region - it only considers classical mechanics and not quantum mechanics like quasi harmonic approximation which takes into account quantum effects such as the zero point energy. At lower temperatures, the molecular dynamics value had to be taken from the 100-300 K region as GULP gave an error at 0 K. This could be because molecular dynamics depends on the motion/velocity of the atoms. At 0 K, there is no motion meaning no information would be outputted, potentially giving an error. At higher temperatures, it can be seen that molecular dynamics gives a more accurate value compared to literature. This is because quasi harmonic has nearly a parabolic shape where the bond length increases exponentially with temperature. This means the bond length increases infinitely and the bond never breaks - the melting point can never be found using the quasi harmonic approximation. This can be demonstrated by using the thought experiment - what if this were carried out using a diatomic molecule with an exactly harmonic potential. An increase in temperature would cause more vibrations but the average bond length would remain the same due to the energy remaining in the potential well, with the internuclear separation remaining at the equilibrium position. Using the quasi harmonic potential is simply slightly skewed on one side meaning that an increase in temperature increases the bond length. Using the anharmonic potential, this can help to explain the 'physical origin' of thermal expansion. As temperature increases, there is more bond vibration leading to greater bond extension (the internuclear separation 'goes further up the anharmonic potential plot'. The longer the bonds in the crystal, the larger the volume.
Looking at the molecular dynamics data, it is a lot less stable at higher temperatures than the quasi harmonic approximation graph. This could be due to the fact that there are more potential states at higher temperatures and fewer of them are sampled within the given time frame. This would lead to the average being less stable than those at lower temperatures. This would give a less accurate value and could explain the larger spread of data.
Conclusion
This investigation found that the optimum grid size was 20x20x20 when looking at the phonon dispersion of MgO as this is where the free energy converged so gave very little difference between this value and higher values. The thermal expansion coefficient for MgO was investigated using a quasi harmonic approximation and molecular dynamics methods. In the region 0-300 K, the QHA gave a value of and molecular dynamics gave a value of . In the region 300-1300 K, QHA gave a value of and molecular dynamics gave a value of . In the lower temperature region, the QHA was found to be a better approximation and closer to literature as QHA includes the zero point energy which is the main contributing factor at that temperature. In the higher region, molecular dynamics was found to be a better approximation due to the quasi harmonic approximation not considering the anharmonic effects.
References
[1] - Rao, A. S. M., & Narender, K. (2014). Studies on thermophysical properties of CaO and MgO by γ -ray attenuation. Journal of Thermodynamics, 2014. http://doi.org/10.1155/2014/123478
[2] - Lecture 4: Vibrations and Free Energy N. M. Harrison Imperial College London
[3] - Atkins, P. W., 2014, Atkins' physical chemistry. Oxford: Oxford Univ. Press


