Rep:Al3714MgO
Thermal Expansion of MgO
Introduction
Thermal expansion plays a significant role in everyday life. For example, the longevity of infrastructure is dependent on the understanding of how materials behave when undergoing temperature changes. If a structure, for example a bridge, is not given the opportunity to dissipate heat, the material will expand (or contract, if cooled), which will eventually crack the material the structure is built out of. Hence, understanding and predicting thermal expansion is crucial to avoid such deficiencies and by understanding the origins of this phenomenon, it becomes possible to choose materials wisely depending on their characteristics, or even design materials with the necessary thermal properties.
During this investigation, the thermal expansion of an MgO crystal was computationally studied in order to examine its behavior with varying temperature. To understand the origins of this behavior, the crystal was examined on an atomic (i.e. unit cell) level, with the vibrations of phonons building the basis of most calculations.
Therefore, in a first step, the phonon dispersion curve was found to gain insight into the vibrational energy structure of the crystal. Secondly, the density of states of the vibrational energy levels was calculated to gain a basis, i.e. number of points at which the vibrations are sampled, that accurately reflects the system. This was evaluated both using the density of states as well as the Helmholtz free energy. Lastly, the variation of Helmholtz free energy, lattice parameter, and volume of the unit cell over a range of temperatures was computed and the thermal expansion coefficient calculated from that data.
All calculations described above were run using the quantum mechanical Quasi-Harmonic Approximation model. This model is closely related to the harmonic approximation model in that it assumes that vibrations are of harmonic nature. However, as an expansion of the harmonic approximation, it allows for a certain degree of anharmonicity by allowing variation in bond length upon thermal excitation.[1]
Additionally, the thermal expansion calculations were also performed using the Molecular Dynamics model. This classical model uses Newton's second law of motion () to calculate the force acting on an atom as it moves along its trajectory over a certain period of time.[2] The properties calculated in this way present a time average of the atomic behavior. It therefore presents a completely different approach to solving the problem in question than the Quasi-Harmonic Model.
In order to understand the discussion below, it is important to be comfortable with the concept of reciprocal space. The world, as apparent to the human eye, exists in real space. However, every system that exhibits periodicity can alternatively be expressed in reciprocal space, which is merely a Fourier transform of real space. The periodic nature of reciprocal space allows the visualisation of the wavelike properties of a system, for example the vibration of phonons as energy bands. The wave-vector k is the vector that describes the motion of the wave through space and thus uniquely identifies all molecular states.[3]
Results and discussion
Phonon Dispersion Curve
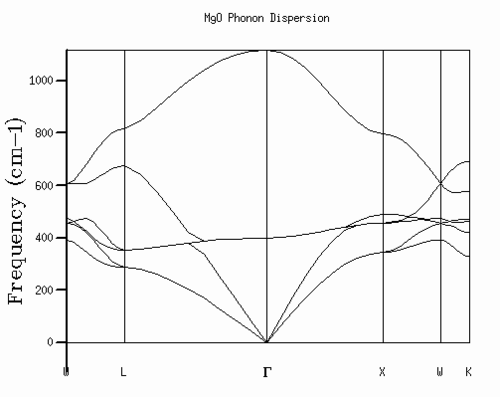
Phonon dispersion curves are a graphical representation of phonon vibration frequency as a function of the wave vector k, i.e. they represent the vibrational band structure. The number of bands is related to the number of atoms within primitive unit cell and the number of degrees of freedom. In the case of the MgO crystal, the system extends in 3D and the primitive unit cell contains two atoms. Therefore, the dispersion curve exhibits 6 bands [Fig. 1] with frequencies 329.38, 420.05, 462.69, 471.59, 576.87, and 693.07 cm-1 The calculation was performed using a 1x1x1 grid, i.e. using one k-point. Examination of the dispersion curve reveals that the k-point used for the calculation must be the L symmetry point, as it is the only point at which all 6 frequencies are apparent. The k-point chosen does not affect the outcome of the calculation for the dispersion curve, it merely gives a variation in the graphical outcome of the density of states, as it uses a different point of reference (further explanation in section Density of States).
Density of States (DOS)
The DOS defines the distribution of all energy states of the system. It is closely related to the phonon dispersion curve, as it identifies the number of states present at each band frequency observable in the dispersion curve. The overlay of the two curves [Fig. 2] nicely illustrates this relationship.

Each peak in the DOS represents a frequency of the energy band at the k-point used as the reference point (here: L). The DOS shows 4 peaks corresponding to the four bands, two of which are doubly degenerate, which explains why the corresponding peaks in the DOS have double the intensity of the other two.
The DOS discussed so far was generated using only one k-point. It serves well to illustrate the relationship to the distribution function, however, it does not accurately represent the distribution of states in the system. To accurately represent the DOS, a larger grid-size must be used, i.e. more k-points must be sampled in order to generate an accurate representation of the system. Increasing the grid-size comes with the trade-off of increased computational time and it is therefore necessary to find the grid-size that gives accurate results while still exhibiting reasonable computational speed.
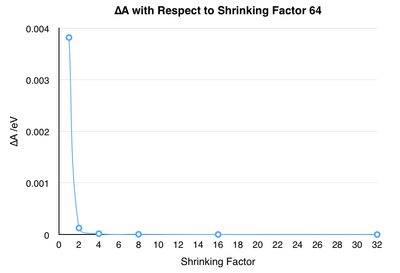
Before continuing on to thermal expansion calculations, it is therefore necessary to determine the optimal grid-size described above. In order to accomplish this, DOS calculations were performed with shrinking factors of 1-64 with the shrinking factor doubling at each step. The shrinking factor is a way of expressing the grid size by giving the number of points in the a, b, and c directions of the unit cell and were chosen to be equal in all three directions. Examination of the calculation output files reveals that the calculations are run with less points than expected. This is due to the fact that the high symmetry of the cubic system allows introduction of a diagonal symmetry axis, which effectively halves the points needed to sample the whole system, thereby drastically reducing computational time. The results of the calculations are summarised in Fig. 3. As the grid-size increases, the distribution becomes better resolved as more of the possible vibrations are taken into consideration. Once a shrinking factor of 32 is reached the improvement in quality is negligible compared to the increase in computational time necessary.

The optimal grid size varies with the type of material being examined. For a similar metal oxide to MgO, the grid size may be similar to the one presented here since the cell size and bonding interactions will be similar. In the case of a larger unit cell, eg. a zeolite, the grid size necessary will decrease. This, at the first glance slightly counter-intuitive notion, is due to the inverse relationship between unit cell vector a in real space and a* in reciprocal space:
If a unit cell becomes bigger in real space, its size decreases in reciprocal space and logically, less points are necessary to create an accurate picture of the system. In the case of a metal system, the grid size necessary would also be smaller than that of MgO, but for a different reason. The bonding in metals is different from the ionic bonding in the MgO crystal. A metal exists as a group of cations surrounded by a delocalised sea of electrons. This delocalisation enables the electrons to balance the repulsion between cations through a higher presence at points where nuclei are close. Due to this moderating effect of the electrons, less repulsion is felt overall and the energy band flattens compared to other materials. A narrower energy band means that less vibrations need to be sampled to gain an accurate impression, so again, a smaller grid-size is appropriate.
Helmholtz Free Energy
The discussion of grid-size above provides a very qualitative evaluation of the optimal number of k-values necessary to provide accurate calculations. In order to define a more quantitative evaluation, it is necessary to move away from the graphical and into the numerical description, which is achieved by using the Helmholtz free energy:
The equation above shows that the Helmholtz free energy is composed of the lattice energy, zero point energy and an entropic contribution to the energy. This entropic part incorporates a sum over all k-values, meaning that the Helmholtz energy, like the DOS, becomes more accurate with increasing grid-size. The Helmholtz free energy can therefore be regarded as a numerical representation of the DOS and can thus be used to make quantitative assertions about the grid-size accuracy.
Table 1 shows the calculated value for the Helmholtz free energy, as well as the free energy change both compared to the next larger grid-size and the most accurate value computed (shrinking factor 64). From the table it becomes clear that the free energy is minimized towards an optimal value. The graph of ∆A vs. shrinking factor nicely shows how this convergence towards this optimal value. A 1x1x1 grid has an accuracy of 3.8meV. Doubling the grid size vastly increases the accuracy to 0.1meV and by the time the shrinking factor reaches 32, the energy values have converged. Therefore, the accuracy investigation using the Helmholtz free energy confirms that a grid-size of 32x32x32 is sufficient for making the thermal expansion calculations.
Thermal Expansion
Quasi-Harmonic Model
As a first step in investigating the thermal expansion of MgO, the lattice parameters and Helmholtz free energy were calculated at various temperatures (0 to 1000 K at 100 K intervals).
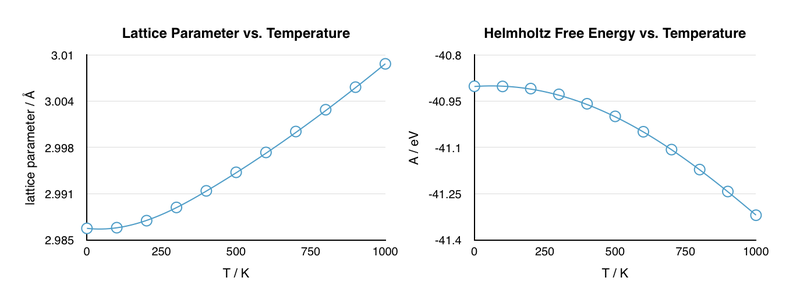
The curves show the expected behavior as the temperature is varied. As the temperature increases, the atoms undergo more movement and are, on average, further apart. Hence, the lattice parameter a, which gives the length of the unit cell, will increase with temperature. Since the lattice parameter and volume are related, it is clear that the volume must also increase with temperature. In contrast to the lattice parameter, the free energy decreases with increasing temperature. The explanation for this lies in the definition of the Helmholtz free energy:
Since entropy is proportional to temperature, the TS term becomes larger with increasing temperature. Thus, the free energy is expected to decrease, i.e. become more negative, with increasing temperature. The graph is curved due to the effect of zero-point energy. Zero-point energy is the residual vibrational energy at 0 K and therefore corresponds to the ground state energy of a harmonic oscillator. The origin of the zero-point energy lies in quantum mechanics. If, at 0 K, the atom becomes stagnant, determination of its velocity and position simultaneously becomes possible, which is a direct violation of the Uncertainty principle. Therefore, the atom must exhibit a residual velocity, and hence vibrational energy, at 0 K.[4] Since this value is a constant, it contributes a higher proportion to the total energy at low temperatures than at high temperatures. Thus, the energy (and related properties) approaches a constant value at low temperatures and varies linearly with temperature at high temperatures.
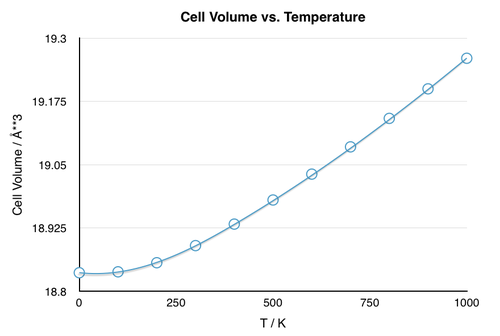
The thermal expansion coefficient can be calculated from the change in volume with temperature (Fig. 6) using the equation below:
The nonlinear dependence of the volume on temperature suggest that the thermal expansion coefficient, which is practically the gradient of the V vs. T plot, varies with temperature as well. Nevertheless, the coefficient could be calculated for the temperature region in which the volume varied linearly with temperature (300-1000 K) and the resulting calculation gave a value for the thermal expansion coefficient of = 2.80*10-5 K-1. The calculated value corresponds well with the literature value of = 3.16*10-5 K-1 (11.4% error) computed over a temperature range from 303-1273 K.[5]
The main approximation applied here is that the thermal expansion coefficient is independent of the temperature and that the Quasi-Harmonic method is a suitable model for the system at the temperatures investigated. Since the model loses accuracy as the melting point is approached (detailed discussion below), the upper temperature limit must lie sufficiently below this value, which is given here, since MgO has a melting point of 3125K.[6]
In the following the relationship between the thermal expansion coefficient and temperature will be examined. In order to do so, the volume vs. temperature data must be fitted according to a suitable function. Source 5 suggests:
Since the thermal expansion coefficient is the gradient of the volume-temperature plot, the dependence of volume on temperature may be given by:
The function was fitted to the data using python which returned the function coefficients as a=3.8732*10-4±1.12*10-5, b=2.446-7±1.59*10-8, c=-5.283±0.37, and d=18.746±4.25*10-3. Using this information, was computed using equation 5 pre-multiplied by the reciprocal of the original volume as suggested by equation 4. Plotted against temperature, the thermal expansion coefficient exhibits a radical increase followed by a stabilisation of the value as the volume dependence on temperature approaches linearity. The correlation to the previously estimated value is high, as the average over a temperature range of 300-1000 K is 2.79*10-5 K-1 .

Interestingly, the thermal expansion coefficient is negative at low temperatures. Although this may be a result of inaccuracy of the fitting, it is important to note that negative thermal expansion (NTE) exists for some materials, especially at low temperatures.[7] This phenomenon is mainly attributed to low frequency phonon vibrations called transverse vibrations.[7] This type of vibration of Metal-O-Metal arrangements decreases the Metal-O distance, effectively shrinking the crystal. Compared to longitudal vibrations, which increase the M-O distance, they have a low activation energy and therefore prevail at low temperatures, causing NTE.[7] The effect may also be caused by supramolecular effects, one of which is the ferromagnetic transition at the Curie Temperature TC, which identifies the temperature below which a substance exhibits ferromagnetic behavior.[7] This change in magnetism is accompanied by a change in spin (all dipole moments align), which leads to a change in symmetry of the system.[8] This change in symmetry can cause alterations in volume, leading to NTE.[7] Unfortunately no value for TC for MgO could be found to support this hypothesis.
The phenomenon of thermal expansion is a result of the anharmonicity and is illustrated in Fig. 8.
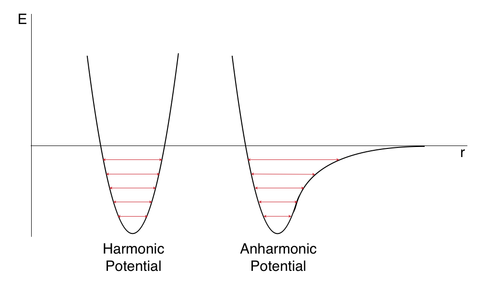
As the temperature is increased, excited energy states are populated. In the harmonic case, this does not have a great effect on the bond length since the interatomic distance r is very restricted. In the anharmonic potential case however, the population of higher states leads to a significant variance in the bond length. Therefore, at higher temperatures, the interatomic distance increases on average, which translates to an increase in volume.
This explanation uncovers a major shortcoming of the harmonic approximation model. Since it does not allow for variations in bond length with population of thermally excited states, it fails to predict thermal expansion of materials. To overcome this drawback, the quasi-harmonic approach was developed. As explained in the introduction, this method assumes harmonic vibrations, however it also takes into consideration the effect of temperature by allowing the frequency of vibrations to change with temperature, thus introducing the anharmonic element necessary for thermal expansion.[1]
Molecular Dynamics Model
To supplement the calculations performed using the Quasi-Harmonic model, thermal expansion was also investigated using Molecular Dynamics.
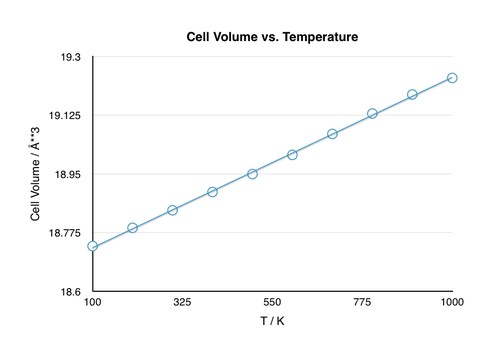
Using this model, the temperature dependence of the volume is purely linear. This effect arises since Molecular Dynamics, as a purely classical model, does not take the zero-point energy into consideration. Calculation of over the same temperature range as for the Quasi-Harmonic model of 300-1000 K gives a value of 2.99*10-5 K-1, which is only a 5.4% deviation from the literature value. The increased correlation to the literature value could be a result of the fact that the accuracy of Molecular Dynamics increases with temperature, while that of the Quasi-Harmonic model decreases (a more detailed explanation of this phenomenon follows below). If calculated over the entire temperature range of 100-1000 K, the coefficient is calculated at 2.97*10-5 K-1 which is a 6% difference to the literature value. The reduction in precision as lower temperatures are taken into consideration indicates the declining accuracy of the Molecular Dynamics model with decreasing temperature.
After optimisation, the symmetry of the unit cell seems to have changed, however, upon inspection, this change was revealed to be merely translational in nature.
In order to run reliably, the sample size must be large enough to accurately represent the interactions between the molecules as they travel along their trajectories. In order to achieve this, Molecular Dynamics uses a conventional unit cell based supercell. The conventional unit cell contains 8 atoms and a supercell is the conventional unit cell doubled in all three dimensions, yielding 64 atoms. Compared to the Quasi-Harmonic model, which utilised a 32x32x32 lattice to generate exact results, this is quite a small system. However, the computational power required for Molecular Dynamics is much higher, and therefore this smaller system is applicable.
Comparison of the Models
Figure 10 shows the comparison of change in unit cell volume with respect to temperature calculated using the Quasi-Harmonic Model and Molecular Dynamics. While the discrepancy between the results is significant at low temperatures, they converge at higher temperatures.
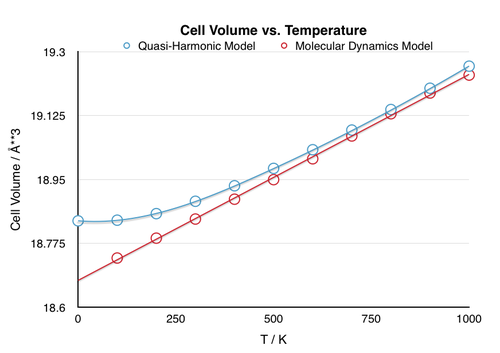
The difference in the models becomes especially prevalent upon approaching extremes. One such extreme would be the melting point. At this point, the ordered crystal vibrations cease, and the molecules succumb to random thermal motion. In a harmonic based model, this behavior is impossible as the model does not allow for bond dissociation [Fig. 8]. Therefore, at the melting point, the fundamental assumption of harmonic vibration no longer applies and the model breaks down. Conversely, the accuracy of the Molecular Dynamics model improves with increasing temperature as it is based on the random thermal motion of molecules, which is dominant at the melting point. Since this model accounts fully for anharmonicity, the volume would continue to rise with temperature as the solid becomes liquid and eventually gas, as expected from natural observation. The other extreme is approaching 0 K and in this case, the accuracy of the models is reversed. The assumptions of harmonicity on which the Quasi-Harmonic approximation is based becomes increasingly accurate as the phonons are confined to the ground vibrational state, which lies within the harmonic region of the anharmonic potential. Since this model takes into consideration the zero-point energy, it provides accurate results at low temperatures. In contrast, the random thermal motion on which the Molecular Dynamics model is based does not exist at 0 K and therefore, this model, which does not account for the zero-point energy, becomes inaccurate.
Calculation of the thermal expansion coefficients also exhibits a discrepancy. When calculated over the range of 300-1000 K, the two values show a 9.4% deviation, with the Molecular Dynamics value lying closer to the literature value. This variation may simply be due to the fact that the approximated linear trend-line for the Quasi-Harmonic model is inaccurate, however it may also indicate the improved accuracy of Molecular Dynamics at elevated temperatures. An indication that this is indeed the case, is given by the fact that the thermal coefficient calculated using Molecular Dynamics is closer to the literature value.
Conclusion
During this investigation, the thermal expansion of MgO was investigated using the Quasi-Harmonic method as well as Molecular Dynamics. In general, the data followed the expected trends, with the Quasi-Harmonic model producing more accurate results at lower temperatures, while the Molecular Dynamics model best functioned at elevated temperatures. The discrepancies between the models are therefore complimentary and are due to the differing fundamental assumptions they are based on. This example demonstrates the importance of understanding the basis of a model in order to choose the one best suitable to describe the scenario in question.
Additionally, it has been shown that investigation of the variation of the thermal expansion coefficient with temperature can uncover special behavior at low temperatures that would not be apparent when inspecting an average thermal coefficient.
For future studies, examination of further materials would be of interest, in order to compare the thermal properties and perhaps generate general guidelines to assess a material's behavior as a result of temperature change. In this sense, it would be particularly intriguing to investigate materials that exhibit NTE, as this property provides unique opportunities for material design.
References
- ↑ 1.0 1.1 B. Fultz, Vibrational Thermodynamics of Materials, CalTech, 2009.
- ↑ B. Alder, T. Wainwright, J. Phys. Chem., 1959, 31, 459-466.
- ↑ A. Sutton, Electronic Structure of Materials, Oxford Science Publications, 2nd edn., 1993.
- ↑ P. Atkins, J. de Paula, Atkin's Physical Chemistry, 10 edn., Oxford University Press, 2014.
- ↑ T. Ahrens (Ed.), Mineral Physics and Crystallography: a Handbook of Physical Constants, AGU Books Board, Washington DC, 2009.
- ↑ Chemistry World Podcasts, https://www.chemistryworld.com/podcasts/magnesium-oxide/7645.article, (accessed November 2016).
- ↑ 7.0 7.1 7.2 7.3 7.4 W. Miller, C. Smith, D. Mackenzie, K. Evans, J. Mater. Sci., 2009, 44, 5441-5451.
- ↑ S. Dan'kov, A. Tishin, Phys. Rev. B., 1998, 57, 3478-3490.

