Rep:Ac4515 MgO
Abstract
Two computational simulations were carried out on a MgO lattice to determine the thermal expansion coefficient,α, of the system. The computed coefficients for the techniques were 2.6x10⁻⁵ K-1and 3.07x10⁻⁵ K-1 at 400 K for the quasi-harmonic approximation and molecular dynamics respectively.
Introduction
The experiment aimed to compute the thermal expansion of an MgO lattice via quasi-harmonic approximation (QHA) and molecular dynamics simulations. The thermal expansion is modelled by :
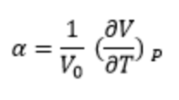
where α is thermal expansion coefficient and Vo is the initial volume.
The MgO lattice investigated in this experiment has a FFC structure in real-space but a BCC in reciprocal space (k-space), where an enlargement in real space leads to a subsequent contraction occurs in reciprocal space. Reciprocal space has a fundamental role in analytic studies of periodic structures, in this experiment it is used to compute properties of the infinite MgO lattice via a quasi-harmonic approximation. Computing the simulations in real space for an infinite lattice would be very time consuming and so simulations are done in reciprocal space to account for time constraints.
The program used in this experiment , GULP, works by transforming a real space lattice to a reciprocal lattice in k-space, in which the symmetries of the real and reciprocal lattice are related.1 In reciprocal space a k-vector describes the wavelength and vibration of a phonon and is defined as:

The QHA is an adaptation of the harmonic approximation- the assumption that interactions between atoms is harmonic and that all vibrations in a system lie in a symmetrical well. This is not a suitable approximation for computing thermal expansions as it also assumes constant volume. To account for this the QHA considers that phonon vibrations are very much dependent on volume. This approximation is much more appropriate to compute a thermal expansion.
The Molecular dynamics technique is centred on Newton's second law of classical mechanics. The simulation is based on classical theory rather than quantum theory and so doesn't consider the zero point energy, which is in contrast to QHA. The technique takes the perspective that the atoms in the lattice follow the paths that they would normally and thus the properties of the lattice (such as volume) are computed as time averages.
Results and discussion
DOS and phonon dispersion relationship
The DOS computed for a 1x1x1 grid size (seen in figure 2) results in a single k-point with associated vibrational frequencies. The single k-point from the DOS can be related to the dispersion curve (figure 1) by its frequencies and thus its position in reciprocal space can be found. There are six branches in total (two for each dimension, three acoustic branches and three optical branches), while there are only 4 peaks for the single k-point. This is a result of the two doubly degenerate branches at the k-point which corresponds to the two frequencies in the DOS which have double the density. Inspecting the log file of the DOS it indeed shows two doubly degenerate and two singly degenerate frequencies, with the k point coordinates of (0.5, 0.5, 0.5) corresponding to point L on the the dispersion curve.
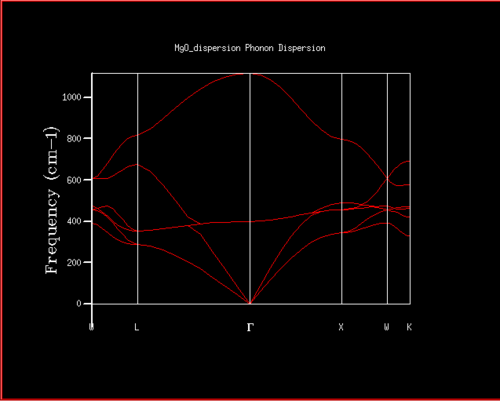 |
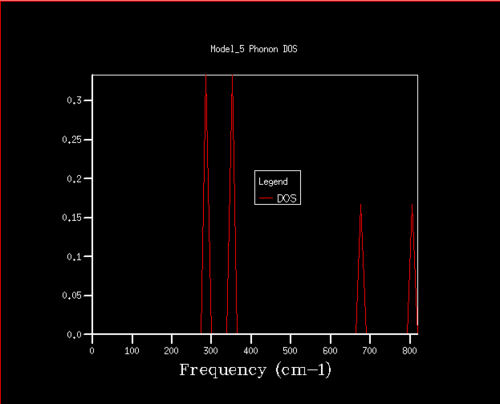 |
Optimising the k-space grid size
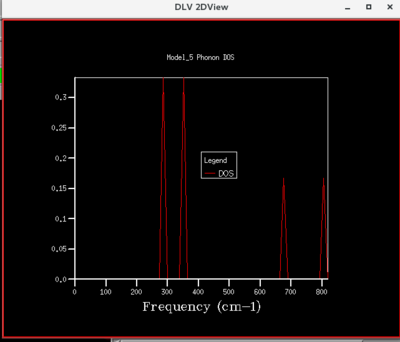
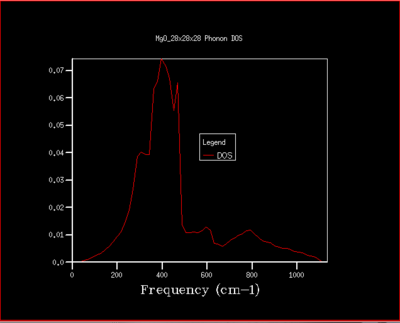
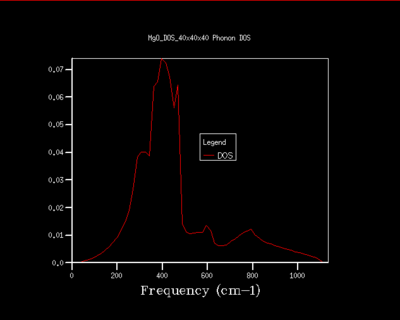
It can be seen from the figures below that by increasing the grid size, a higher resolution plot arises for the DOS of the phonons. A 28x28x28 grid size was found to be the point at which the plots converged to an appropriate accuracy. Inevitably a larger grid size gives a more accurate and representative result for the infinite MgO lattice due to more vibrations in the lattice being computed , however, a 28x28x28 grid gives a sufficient approximation of the lattice. Increasing the grid size above a 28x28x28 grid size does not improve the approximation significantly to be worth applying further calculations (seen by comparing figure 5 and 6) and only lengthens the CPU simulation time. Furthermore, a grid size below this is not an accurate representation of the vibrations in the lattice as it is too loose of an approximation. Ultimately, a grid size of 28x28x28 is able to approximate the vibrations of the lattice suitably and finds the balance between accuracy and CPU time.
Considering other systems, a crystal system of similar size (e.g CaO) would predictably have a similar sized optimal grid size. A larger crystal system such as Zeolite is smaller in k-space and so a smaller optimal grid size is needed for a high resolution DOS. This can be explained by having a scenario where the same grid size is used for a MgO and Zeolite system, Zeolite would be able to fit more phonon information (due to being smaller in k-space) into the grid and thus a smaller grid is needed for an accurate approximation. With the same reasoning a much smaller monoatomic lattice in real space, such as Lithium, would require a larger optimal grid size compared to MgO.
 |
 |
|---|---|
 |
 |
Convergence and computing of Helmholtz free energy at 300 K
GULP calculations, similar to the computing of the DOS, were carried out setting the temperature to 300 K and varying the k-space grid size using the quasi-harmonic approximation. Figure 7 below shows the free energy quickly plateaus at a value of -40.926483 eV and converges at a 14x14x14 grid size. The quasi-harmonic approximation of Helmholtz free energy (seen in eq 3) includes a sum over vibrational modes of the crystal, more accurately a sum over k-points in the grid. A larger grid increases the number of k-points for summation thus giving a more accurate reflection of the Helmholtz free energy for the lattice.

To gain calculations with accuracy of 1 meV, 0.5 meV and 0.1 meV: grid sizes of 2x2x2 (-40.926609), 4x4x4 (-40.926450 eV) and 14x14x14 (-40.926463 eV) are respectively suitable. It is again important to establish a shrinking factor that gives sufficient accuracy but also doesn't take too much CPU time to take forward for subsequent simulations.

Quasi-harmonic approximation simulation
 |
 |
 |
Figure 8 shows that at low temperatures there is a slow decrease in free energy and at subsequent higher temperatures the free energy decreases more rapidly. This can be explained by interpreting eq 3, at lower temperatures the zero point energy is the dominant contribution to the free energy and thus the effect of increasing temperature is minimal on the free energy. Contrastingly, at higher temperatures the entropic term dominates and the free energy decreases with a steeper gradient.
Similar reasoning can be given for the trend in figure 9: minimal change (almost linear) in volume at low temperatures (0 K to 300 K) with a subsequent steeper linear increase in volume at higher temperatures. Nevertheless, when the temperature approaches the 3250 melting point 2 of MgO the linear relationship is disrupted due to the breakdown of the approximation. Accurate anharmonic effects are not represented at larger inter-ionic separations and high temperatures resulting in over estimations of the volume.3,4 Another contribution to disruption of the linear region when approaching the melting point could be that the phonon travelling through the lattice breaks down as the substance turns into a liquid and thus giving invalid volumes for the lattice.
The computed thermal expansion coefficients from figure 10 show that the coefficient is not independent of temperature, but in fact increases with it. The increase is very steady (almost plateau like) up until 2000 K, above this temperature the thermal expansion coefficient increases rapidly. With comparison to experimental literature 5, it can be seen the initial trends are similar in that for both plots the thermal expansion coefficient increases steadily with temperature. When comparing a specific coefficient value, such as at 400 K 1.12x10⁻⁵ K-1 and 2.62x10⁻⁵ K-1 for the literature and computational results respectively it suggests the QHA has computed a relatively accurate result. Deviations could be due to the approximations made in the QHA, approximations include: regardless of the temperature the model assumes the system is a lattice (above the melting point it is not) and that only small oscillations occur (why the QHA model breaks down at large inter-ionic separations).
There are a number of phenomena that cannot be explained within the harmonic approximation, these include thermal expansions (useful for this investigation) and temperature dependence of elastic constants (e.g a chemical bond). In a diatomic, assuming a harmonic system, regardless of the temperature increase (and thus energy increase) the system will always fall back into the harmonic potential well resulting in a bond length which on average represents the equilibrium bond length. These phenomena result from anharmonic interactions, which the QHA take into account. For a diatomic system, using a QHA, the bond length would increase with increasing temperature. This is due to the unsymmetrical nature of an anharmonic system, vibrations aren't confined to a symmetrical well like in a harmonic approximation. 4
Molecular dynamics simulation
 |
 |
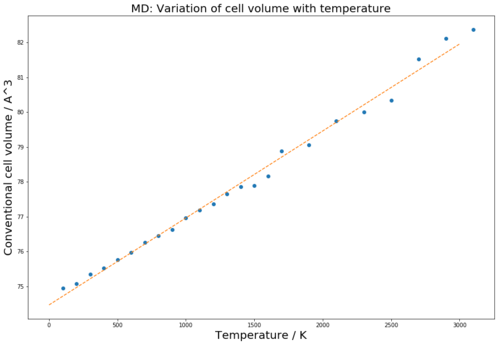
Seen in figure 11 the volume increases linearly with temperature up until approximately 1500 K where deviations from linearity occur. At high temperatures there are high fluctuations and noise which is a result of the high kinetic energy of the atoms which make it difficult to attain an accurate picture of the volume of the system. The simulation is stepwise and attains an average volume for each time interval, at these fluctuating high temperatures the movement of the atoms is much too quick to gain an accurate volume and so the noise behaviour is seen. A shorter interval time would be need to be computed to give a more valid average volume.
Figure 12 shows how the regions with greatest linearity for both simulations are very similar. This is also the region in which both simulations are most in conjunction with the trend of literature experimental 5 values for the thermal expansion coefficient. At higher temperatures MD is more consistent with respect to the literature values but QHA is at lower temperatures. At 400 K the thermal expansion for an MD simulation was computed to be 3.07x10⁻⁵ K-1 this is somewhat accurate when compared to literature 5: 1.12x10⁻⁵ K-1but not as accurate as for the QHA due to being at a relatively low temperature.
MD simulation is weaker with regard to validity at lower temperatures due to being a classical simulation and therefore its disregard for the zero-point energy which is a dominant competent of the free energy and ultimately the volume of the lattice at low temperatures. 6 However, at higher temperatures the simulation excels when compared to the QHA, MD does not assume that a lattice remains at high temperatures and so can better evaluate the characteristics of the lattice with its real time simulation.
Conclusion
Both simulations showed reasonable accuracy in computing the thermal expansion coefficient when compared with literature. Another feature which was apparent for both simulations was that at very high temperatures they both broke linearity when computing the volume of the lattice. Furthermore, both simulations gave similar volumes and thermal expansion coefficients for the MgO lattice at moderate temperatures(the apparent linear region for both simulations). Where the two differed was their validity at high and low temperatures, MD gave a better representation of the properties of the lattice at higher temperatures compared to QHA, which gave better results at lower temperatures. To improve the MD calculation shorter time intervals could be used to reduce the amount of noise at very high temperatures, however, this would take greater computational power and the MD simulation is already very time consuming at high temperatures.
References
- Gale, J.D., 1997. Journal of the Chemical Society, Faraday Transactions, 93(4), pp.629-637.
- Ronchi, C. and Sheindlin, M., 2001. Journal of Applied Physics, 90(7), pp.3325-3331.
- Matsui, M., Price, G.D. and Patel, A., 1994.Geophysical research letters, 21(15), pp.1659-1662.
- Dove, M.T., 1993. Cambridge university press, 76(8), pp.659-662
- A. S. Madhusudhan Rao and K. Narender., 2014. Journal of Thermodynamics, 72(18), pp.532-567
- Milonni, P. W., 1994. Boston: Academic Press, 84(5), pp.432-453
