Rep:AL1913 MgO
Introduction to statistical mechanics lab: The Free Energy and Thermal Expansion of MgO
Introduction
In this experiment, the thermal expansion of a MgO lattice will be investigated using computational means. In this experiment, GULP (General Utility Lattice Program) was used for the investigation. A quasi-harmonic approximation and a molecular dynamic model were used to investigate the effects of temperature on the crystal structure. The aim of the experiment is to compare these methods, to each other and to the literature, in order to understand how MgO undergoes thermal expansion.
Thermal Expansion
The thermal expansion is caused by the increase in potential energy when the temperature increases. This increase in potential energy leads to an increase in the average intermolecular separation in the quasi-harmonic system. A purely harmonic system is not able to be used as the equilibrium distance between atoms in such a model is independent of temperature and so there would be no thermal expansion.
Methods
Quasi-harmonic approximation
The quasi-harmonic approximation uses the phonon harmonic model as its basis where all inter-atomic forces are purely harmonic. However, it contains an additional anharmonic factor to ensure that the phonon frequency is dependent on the volume of the molecule.[1] This means the potential energy, with respect to intermolecular distance, is no longer a perfect quadratic, but rather resembles that of the Morse Potential graph more closely. This improvement means that thermal expansion can be considered.
The model uses phonons, which are vibrational motions which are coupled so that the lattice of atoms uniformly oscillate at a single frequency. The amplitude of the phonon is proportional to the energy which the molecule has. The energy can be found by calculating the energy over all the vibrational modes of the crystal.
Molecular Dynamics
Molecular dynamics relies on Newton's second law: .
Using this law, the model computes trajectories for the atoms and time averages are found. Initial conditions, such as temperature, are required, then the program assigns atoms with random velocities that are scaled to achieve a similar starting temperature. The program can compute the force, and so acceleration, experiences by the atoms and use this data to produce the new velocity and position. This process is repeated until properties, such as the time averaged- energy and temperature, settle to a value, which can then be used for analysis.
Increasing the cell size allows more atoms to be considered leads to more atoms being sampled and so a more accurate value would be expected. However, a longer computational time, with a reasonable time-step between measurements so that a good proportion the atoms are sampled, would be required. This would be harder to do for larger systems and molecular dynamics is much more expensive to do.
Programs
This experiment utilities Redhat Linux, General Utility Lattice Program (GULP) and DL Visualize (DLV) to model and run simulations, as well as have a graphical interface to example and interact with the results obtained.
Redhat Linux is the operating system used for the experiment as Linux provides the opportunity to run numerical calculations and simulations more easily, which is essential for this investigation.
Results and Discussion
Initial Calculations on MgO
An initial calculation was completed on the MgO model at zero Kelvin and zero pascals. The primitive cell, which is a rhombohedron, has a lattice constant of 2.9783 Angstroms. This can be shown that this is equivalent to the cubic length of 4.212 Angstroms; this is good correlation to the literature value which is 4.211 Angstroms.[2] This is expected as the calculations at 0 K so does not take into account anharmonic factors, which could lead to inaccuracy during this section as there can be difficulties in modelling anharmonic properties.
Phonon Curves

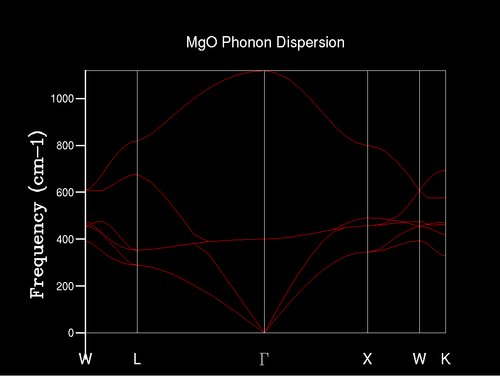
The phonon dispersion graph shows how the phonon modes changes with different k values, which represents different structural wavelengths. For example, Γ represents the k value (0,0,0). For each axis, there is an optical branch and an acoustical branch, which describe phonons as lattice vibrations. The optical branch describes a pair of phonons moving in opposite directions whereas the acoustical branch describes them moving in the same direction. This leads to two branches on the graph per axis and as there are three axes (x,y and z) there are six high symmetry points for the k values seen on the graph.
Phonon Density of States
Initially, a 1x1x1 grid was used to find the density of states (DOS); this is shown in Figure 2. There would be one point examined for the DOS and this point is L [L has the k value of (0.5, 0.5, 0.5)] in k space, as there are four peaks which correspond to four crossings in k space in the phonon dispersion graph (Figure 1). Furthermore, the ratio of the size of the peaks is approximately 2:2:1:1 due to their being four phonon modes with two of these comprising of two degenerate phonon modes. Figure 3 contains graphs with multiple DOS for different grid sizes indicated.
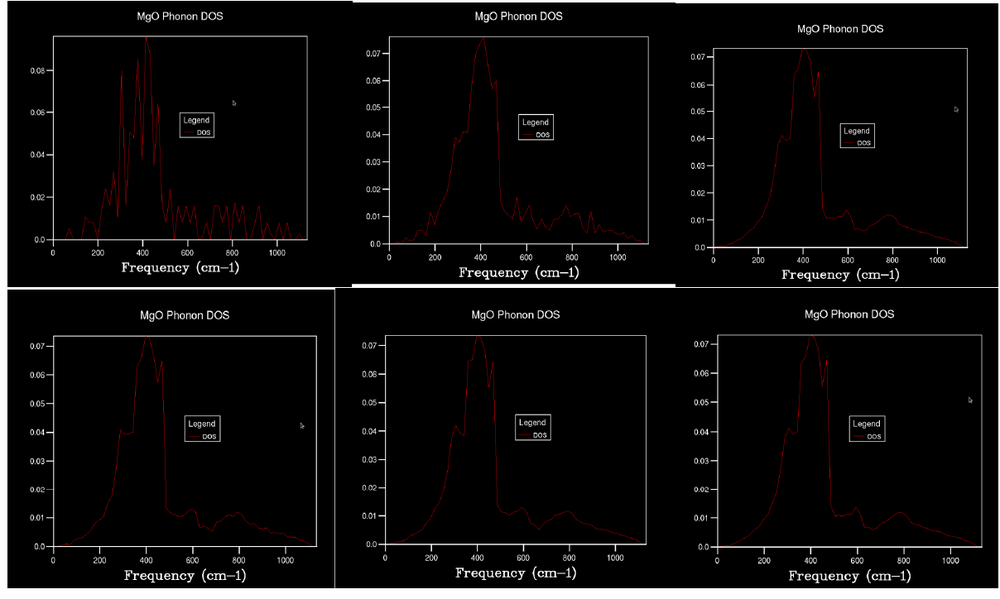
As the grid size increases, more detail about the density of states can be obtained due to the increased amount of sample points in reciprocal space. Calculations are run with increasing size until a continuous curve is formed with a small amount of noise was produced. This was found to be 20x20x20. At lower grid values, there are regions with no phonon modes which would not be plausible. As more sample points are taken these regions are found to contain phonon modes and so the graph gets smoother with a continuum between the frequencies measured.
Free Energy using Quasi-harmonic approximation
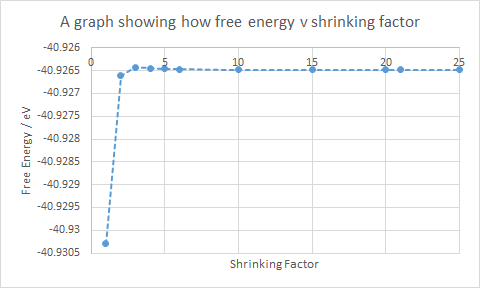
The results from the calculation for the Helmholtz free energy of MgO at 300 K using quasi-harmonic approximation can be used to estimate the Helmholtz free energy, which is -40.9265 eV. Literature values record the free energy at 300 K to be 6.2341 eV. This is a large difference as the model is over simplified, and is a poor model at high temperatures. The anharmonic properties become significant at higher temperatures leading to the large difference in Helmholtz free energy.
In Table 1, the relationship between free energy and grid size is that the larger the grid size, the greater the degree of accuracy. The same ideology from the phonon DOS graph indicates that a larger grid size increases accuracy but also increases time for the calculation.
For different compounds, there are different optimal grid size. For example, the 10x10x10 grid would be appropriate for CaO as the crystal lattice constant of CaO is very similar (CaO: 4.800 Angstrom[3], MgO: 4.211 Angstrom). This means the reciprocal space for the same grid size, contains a similar volume of sampling between the crystals. Larger compounds, such as zeolites, have a larger lattice constant (for zeolites, it is in the region of 24-25 Angstroms[4]), which leads to a smaller reciprocal space, meaning for the same grid size, the zeolite will have a larger percentage of its points being sampled. Therefore, to get a similar degree of sampling for a zeolite a smaller grid is required. If a small metal, such as lithium, was tested instead, the grid size would be larger, as lithium has a smaller lattice constant at 3.44 Angstroms.[5] Lithium will have a larger size in k space hence requiring a larger grid size to obtain the same percentage of measurements as that made with MgO. Also, lithium crystals do not contain charged ions; electrons are dispersed throughout the structure. This results in the dispersion curve for lithium to have fewer variations in frequency across values of k. Due to the electrons adapting to the changes in charge density with the vibrations of the lithium, the electrons maintain a similar Coulombic force acting on them. This leads to less measurements required across k values.
Thermal Expansion of MgO
αV = thermal coefficient
V = volume
∂V = partial derivative of volume
∂T = partial derivative of temperature
subscript p meaning the experiment is conducted at constant pressure
The volumetric coefficient of thermal expansion equation describes how a material expands due to the temperature of the molecule at a constant pressure. A larger volumetric coefficient of thermal expansion relates to a compound undergoes a large thermal expansion during heating. As MgO is a solid with ionic interactions, it is expected that a low volumetric coefficient of thermal expansion is calculated from the simulations due to the strong intermolecular bonds, which are ionic in nature, present in the crystal.
Quasi-harmonic model

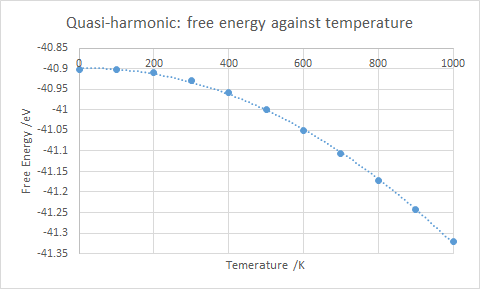
Figure 5 shows a positive curve due to the thermal expansion causing enlargement of the crystal structure, thereby increasing the lattice constant as expected.
When using the quasi-harmonic model, the free energy is calculated using the Helmholtz free energy definition.
A = Helmholtz free energy;
U = internal energy;
T = temperature;
S = entropy.
If U and S are independent of the temperature, then it would be expected that the free energy would be proportional the temperature in a negative fashion. The volumetric coefficient of thermal expansion can be calculated using Figure 4. If the whole range of 0 - 1000 K is used, αV is found to be 2.26 x 10 -5 K-1. The literature value is 1.04 x 10⁻⁵ K-1[6] However, this does not take into account the shape of the graph. The quasi-harmonic is a simple model which leads to a curve which is best described as a quadratic. However the equation for thermal coefficient of expansion shows a linear relationship. This difference could be due to the limitations of the model as the gradient change occurs at higher temperatures.
The program uses approximations for the calculations by using the phonon harmonic model with an addition of anharmonic factor of the frequency being volume dependent. This is a simpler way of computing anharmonic factors and as such, calculations at higher temperature will have a larger anharmonic factor therefore a variation form literature values. Since the model is mainly based around a model that treats intermolecular forces as harmonic, this means the basis of the model is of a harmonic quadratic equation. There are other approximations that limit the precision of the quasi-harmonic model, such as the Born-Oppenheimer approximation where the nuclei are assumed as point charges and electrons "react" to changes to the environment relative to the nuclei whereas the nuclei do not move. These approximations limit the validity of the model at high temperatures. From this, the volumetric coefficient of the thermal expansion should be considered at lower temperatures, hence by finding the gradient of the graph for a range of 0 to 400 K, αV is found to be 7.38 x 10 -6 K-1, which is considerably closer to the literature value.
At even higher temperatures such around the melting point of MgO (3125 K), the quasi-harmonic approximation assumes that the amplitude of molecules will increase with temperature even as it reaches melting point. However this leads to adjacent molecules to collide as the model only permits one dimensional movement. This leads to the quasi-harmonic approximation breaking down at high temperatures and particularly near the melting point. As the model prevents free form movement similar to the movement present in liquids, results in a method not adequate to model MgO near to the melting point.
Molecular Dynamics Model
For the molecular dynamics model, a supercell containing 32 MgO cells is required; a primitive cell would lead to every cell of the crystal to be moving in phase.
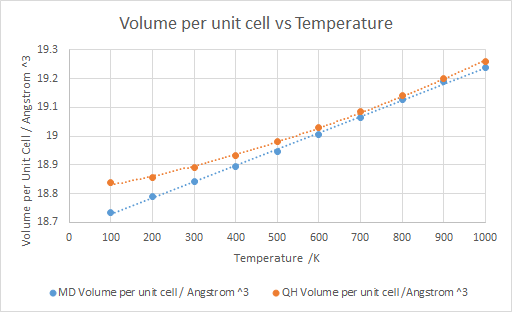
Both calculations using quasi-harmonics and molecular dynamics show a general increase in volume with increasing temperature, which is in line with thermal expansion. Due to the nature of the calculations used for the molecular dynamic model, the results are more erratic when compared to quasi-harmonics. While very similar results were obtained for both models, quasi-harmonics consistently produced results that were larger in volume. Due to the modelling differences, the molecular dynamics model's results are closer to a linear fit. This is different to the quasi-harmonic model which has more of a quadratic appearance, due to its basis on a harmonic model.
The results are sporadic due to the nature of the model which computes averages for the molecules present in the cell. Therefore, a larger cell will produce a more accurate result due to the larger sample size for the results. The model also allows the molecules to undergo three dimensional movement, causing disruption of the primitive cell, unlike the quasi-harmonic model which only allows one dimensional movement. This is visualised by “lost” atoms in the crystal, due to the deformation of the cell due to the thermal expansion causing a change in the geometry of the cell. The central structure of the crystal still has a regular arrangement whilst at the edges there is less of a regular arrangement and more of a jagged edge. This is how the model simulates the expansion which causes a change in the lattice structure due to the random movement of the atoms and the thermal expansion of the crystal.
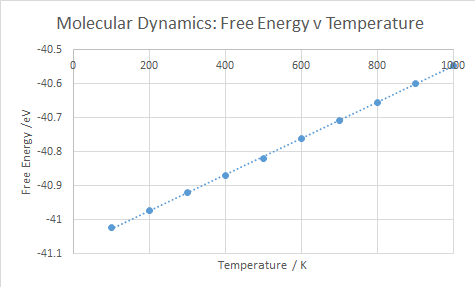
For the free energy, shown in Figure 8, the free energy increases linearly with temperature. This is due to and from this . Hence, the relationship is easily understood. αV can be found, as like before, and it has a value of 2.824 x10⁻⁵ K-1, which is a similar value to the quasi-harmonic value over the full range (0-1000 K).
Comparing the models
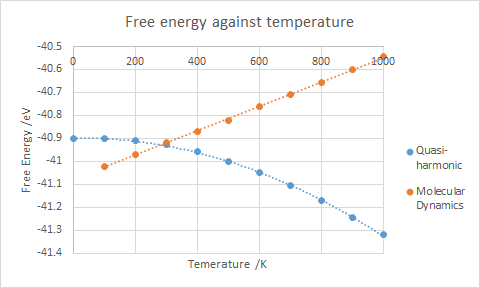
From 0-300 K, molecular dynamics does not contain a curved section for the volume (seen in figure 6), which the quasi-harmonic method has; in this region the anharmonicity isn't as prevalent as the higher temperature regime so the quasi-harmonic method is more accurate. The molecular dynamics model on the other hand doesn't accurately reproduce how the MgO crystal reacts at lower temperatures.
There are limitations for both models. One such limitation is the hard "sphere" approximation. Both models describe atoms as hard, charged "spheres" that interact in a solely classical manner, therefore there is no consideration of the atom overlap that could be considered in a quantum mechanical approach, with the tunnelling phenomena[7] not being considered. This mean the accuracy of both models which can be achieved is not perfect.
Conclusion
In conclusion, the aim of studying the thermal expansion of MgO and phonon dispersion, and comparing the quasi-harmonic approximation and a molecular dynamics approach was achieved.
At lower temperatures the quasi-harmonic model was more accurate than the molecular dynamics model as anharmonic effects were less relevant to the vibrations. The quasi-harmonic approximation does not describe the thermal expansion of MgO efficiently at higher temperatures due to the approximations used in the model to allow for easier calculations. This can be improved by using another model which uses fewer approximations, such as the molecular dynamics model.
The molecular dynamics model uses a larger cell (the 32 unit cell) in the experiment to enable more accurate calculations. A larger cell could be used but this would mean the calculations would take more time for a small amount of accuracy. The reason for requiring a larger cell is due to the nature of the model that calculates averages of the properties of the molecules. The molecular dynamics model was found to be more accurate, of the two models used, for higher temperatures because the quasi-harmonic approximation assumes that the amplitude of molecules will increase with temperature even as it reaches melting point.
References
- ↑ Dove M. (2005). Introduction to Lattice Dynamics. Cambridge: Cambridge University Press.
- ↑ Rössler U., Madelung O., Schulz M., (1999), II-VI and I-VII compounds; semimagnetic compounds. , Springer, Berlin, chapter 197: II-VI compounds crystal structure, space group and lattice parameters of IIA-VIB compounds.
- ↑ Demkov A.A., Navrotsky A., (2005) Materials fundamentals of gate dielectrics. The Netherlands: Springer
- ↑ Weitkamp J., Puppe L. (1999), Catalysis and Zeolites, Springer Berlin Heidelberg, Berlin, Heidelberg, pg 311
- ↑ Hermann K., (2011), Crystallography and Surface Structure: An Introduction for Surface Scientists and Nanoscientists. Wiley-VCH
- ↑ Ho C., Taylor R. (1998), Thermal expansion of solids, ASM International, Materials Park, Ohio, pg 280.
- ↑ Meller J., (2001) Molecular Dynamics. Nature Publishing group
Appendix: Calculations
Volumetric Thermal expansion coefficient:
Using the graphs shown in Figures 6 and 8:
For QH 0-1000 K:
= 2.26 x 10 -5 K-1
For QH 0-300 K:
= 7.38 x 10 -6 K-1
For MD 0-1000 K:
= 2.824 x 10 -5 K-1

