Rep:3rd Year Computational Chemistry: Module 3 (gc2109)
By Gen Cross
In the previous modules it has been seen that computational methods are sophisticated enough to calculate optimised geometries, predict spectra and molecular orbitals for a range of simple organic and inorganic molecules to a satisfactory accuracy. In this module the computationally techniques will be used quite differently since transition states will be modelled and predicted as opposed to low energy products. For this reason the Schrõdinger equation is solved using a molecular orbital approach so that a potential energy surface can be predicted. By finding the global maximum of this potential energy surface a transition state can be predicted. In this way for the first, an insight can be gained into the kinetic properties of reactions, as opposed to the thermodynamic properties studied in Modules 1 and 2. Throughout this Module structures were drawn and manually modified when required on GaussView 5.0, and the calculations made by Guassian 09W using SCAN. The relevant LOG (output) files are shown next to the corresponding data.
The Cope Rearrangement
Introduction
In this part of the Module the mechanism of a very simple pericyclic reaction: the Cope rearrangement of 1,5-Hexadiene, will be investigated. The advantage of looking at this reaction over other sigmatropic rearrangements is that the structure of the products and reactants is exactly the same making the transition state calculations far simpler.
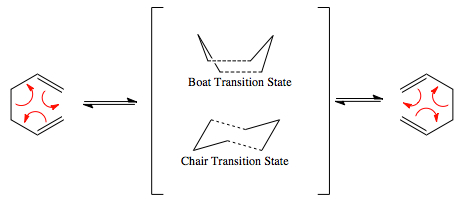
First the 1,5-Hexadiene was geometry optimised using a low level basis set and method (Hartree-Fock/ 3-21G). This is used to quickly ascertain which geometries were the most thermodynamically stable and are therefore the most likely to be the conformations actually involved in the reaction. The 3 most stable conformations from this initial optimisation will then be re-optimised using a higher level basis set and method (DFT/631-G(*)), this new optimisation provides a more accurate result for the most stable conformer. Frequency analysis was carried out to confirm a global energy minimum has been found and Thermochemical Data was looked at to see where the biggest differences in energy between the conformers is.
Having optimised the structure of the starting material, the energies and structures of the transition state were investigated to determine what transition state is the preferred route to the product. It was assumed since the transition state resembles a 6-membered ring (like cyclohexane) that its lowest energy transition states would resemble the lowest energy conformers of a cyclohexane molecule which are chair and boat, therefore only these 2 structures were analysed. [1]
Optimisation of 1,5-Hexadiene
Due to the free rotation around the central C-C bond in 1,5-Hexadiene there are several conformations possible. In total 6 guache and 4 anti-periplanar conformers were drawn in GuassView 5.0 using the edit Dihedral Driver function to manually create a rough optimisation for each of the conformers. The geometries were then 'Cleaned' in GuassView before being sent to SCAN (HF/3-21G), with a % memory = 250MB. The resulting conformers and there relative energies can be seen in the table below, each of their point groups were checked using the Symmetrize function.
| Conformer (with LOG File) | Total Energy (Hartrees) | Relative Energy (Kcal mol-1) | Point Group | Jmol Diagram |
|---|---|---|---|---|
| Anti 1 [2] | -231.69260 | +0.04 | C2 | |
| Anti 2 [3] | -231.69254 | +0.08 | Ci | |
| Anti 3 [4] | -231.68907 | +2.25 | C2h | |
| Anti 4 [5] | -231.69097 | +1.06 | C1 | |
| Guache 1 [6] | -231.68722 | +3.10 | C2 | |
| Guache 2 [7] | -231.69167 | +0.62 | C2 | |
| Guache 3 [8] | -231.69266 | 0.00 | C1 | |
| Guache 4 [9] | -231.69153 | +0.71 | C2 | |
| Guache 5 [10] | -231.68962 | +1.91 | C1 | |
| Guache 6 [11] | -231.68916 | +2.20 | C1 |
It can be seen from the data above that the 3 most stable conformers are Anti-1, Anti-2 and Guache-3, with the latest of these being the most stable. This is somewhat surprising since it was expected that an anti-periplanar conformation would be the most stable. These 3 conformers were re-optimised (DFT/ 631-G*), to improve accuracy. The results are seen below.
| Conformer (with LOG File) | Total Energy (Hartrees) | Relative Energy (Kcal mol-1) | Point Group | Newman Projection | Jmol Diagram |
|---|---|---|---|---|---|
| Anti 1 [12] | -234.61179 | 0.00 | C2 | 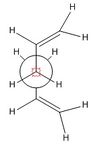 |
|
| Anti 2 [13] | -234.61171 | +0.05 | Ci | 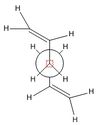 |
|
| Guache 3 [14] | -234.61133 | +0.29 | C1 |  |
It can be seen by comparison of the data in the 2 tables above that using the DFT/ B3LYP method and the higher 631-G(*) basis set leads to a lower energies for each of the conformations, all by around 3 Ha. This is a significant difference in energy, however importantly it can also be seen from the Jmol diagrams that the structures of each of the conformers actually show little difference in bond angle and length.
This higher level basis set predicts the anti conformer is more stable due to the stabilising antiperiplanar relationship e.g σ C-H into σ* C-C, although these interactions are also present in the Guache-3 conformer the geometries are not as well optimised since the dihedral angles are not as close to 180 degrees which would allow for ideal overlap. [15]
Another interaction to take into consideration is the long range Van der Waals interactions between Hydrogen atoms which generally favours Guache conformations.
Frequency Analysis
Frequency analysis was also run on the 3 DFT optimised conformers to check that true global minima had been found, indicated by the absence of imaginary negative frequency absorptions. From the vibrational results it is clear that all the typical absorptions for a linear hydrocarbon are present in each of the spectra. However the most important C=C stretches have been selectively noted in the table below. It is known experimentally [16] that a symmetric C=C stretch is typically at 1630-1680cm-1 and asymmetric C=C stretch absorbs at 1900-2000cm-1.
| Conformer (with LOG File) | Symmetric C=C Stretch | Asymmetric C=C Stretch (cm-1) | Full IR Spectrum | ||||
|---|---|---|---|---|---|---|---|
| Frequency (cm-1) | Intensity | 3D animation | Frequency (cm-1) | Intensity | 3D animation | ||
| Anti 1 [17] | 1732 | 5 |  |
1735 | 14 | 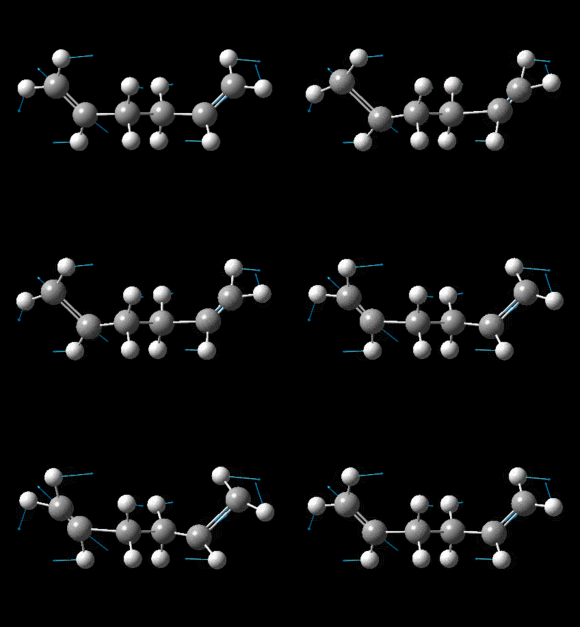 |
 |
| Anti 2 [18] | 1731 | 0 | 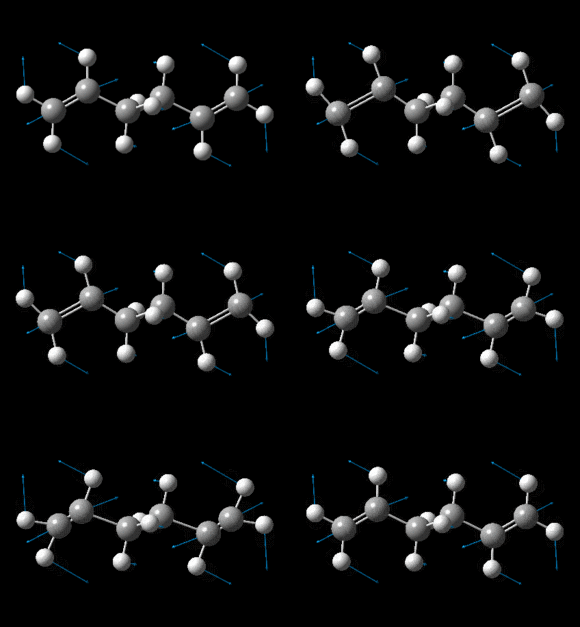 |
1734 | 18 | 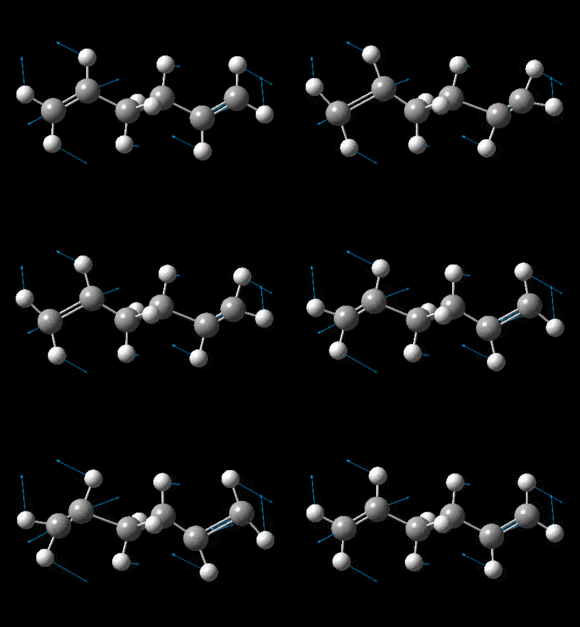 |
 |
| Guache 3 [19] | 1732 | 7 | 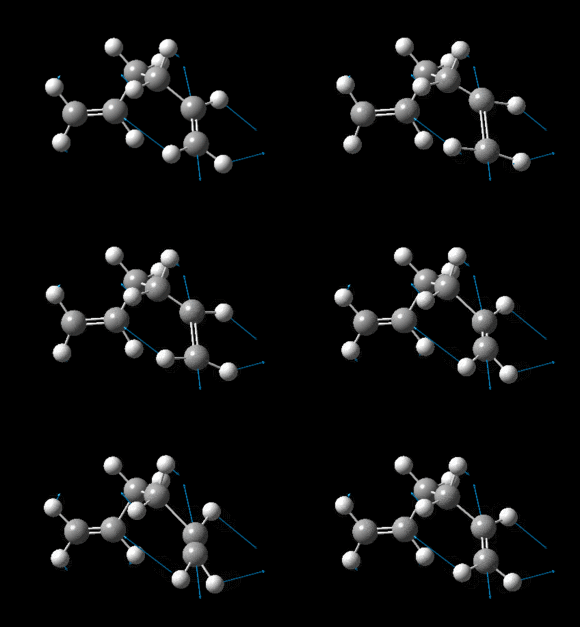 |
1733 | 6 |  |
 |
It is clear from the data above that there is some error in the computational calculations, the symmetric stretches are around 5% lower than the typical literature, while the asymmetric stretches are around 11% higher. In spite of this error it can be seen that as expected the asymmetric stretches are all at a higher frequencies than their symmetric partners. Further it is worth noting that in the anti conformers the intensity of the asymmetric stretch is greater by 8-10 units compared to the same stretch in the guache 3 conformer. This large difference is due to the point groups of the conformers, the guache 3 conformation has no symmetry (C1), and therefore leads to more intense absorptions. The higher symmetry in the anti-1 and anti-2 conformers means an asymmetric stretch of the C=C bond leads to a far smaller change in the overall dipole moment, this is reflected in the intensity seen on the IR spectrum.
Thermochemical Data Analysis
| Conformer | File |
|---|---|
| Anti 1 | [20] |
| Anti 2 | [21] |
| Guache 3 | [22] |
The Thermochemical Data at 298.15K was found in the original LOG file from the vibrational analysis. The results for 0K were obtained by creating a new input file from the original geometry optimisation of each of the conformers, with the words 'Freq=ReadIsotopes' added into key words. This was done so that the new information for the temperature was read when the calculation was carried out on SCAN. The temperature was in reality inouted as 0.00001K, the reason for this was practical one since Gaussian does not recognise 0K. The pressure was consistant for both sets of calculations at 1.0atm.
The meaning of the values from the LOG file is as follows: [23]
(1)the sum of potential energy at 0K + zero-point vibrational energy (E= Eelec + ZPE)
(2)Energy including translation, rotational and vibrational contributions (E= E + Etrans + Erot + Evib)
(3)Includes correction to enthalpy due to internal energy (H= E + RT)
(4)Includes correction to free energy due to entropy (G= H - TS)
Thermochemical Data at 298.15K

Conformer Anti 1:
 Sum of electronic and zero-point Energies=           -234.469298
 Sum of electronic and thermal Energies=              -234.461966
 Sum of electronic and thermal Enthalpies=            -234.461022
 Sum of electronic and thermal Free Energies=         -234.500862

Conformer Anti 2:
 Sum of electronic and zero-point Energies=           -234.469204
 Sum of electronic and thermal Energies=              -234.461857
 Sum of electronic and thermal Enthalpies=            -234.460913
 Sum of electronic and thermal Free Energies=         -234.500777

Conformer Guache 3:
 Sum of electronic and zero-point Energies=           -234.468693
 Sum of electronic and thermal Energies=              -234.461464
 Sum of electronic and thermal Enthalpies=            -234.460520
 Sum of electronic and thermal Free Energies=         -234.500105
Thermochemical Data at 0K

Conformer Anti 1:
 Sum of electronic and zero-point Energies=           -234.468861
 Sum of electronic and thermal Energies=              -234.468861
 Sum of electronic and thermal Enthalpies=            -234.468861
 Sum of electronic and thermal Free Energies=         -234.468861

Conformer Anti 2:
 Sum of electronic and zero-point Energies=           -234.468766
 Sum of electronic and thermal Energies=              -234.468766
 Sum of electronic and thermal Enthalpies=            -234.468766
 Sum of electronic and thermal Free Energies=         -234.468766

Conformer Guache 3:
 Sum of electronic and zero-point Energies=           -234.468256
 Sum of electronic and thermal Energies=              -234.468256
 Sum of electronic and thermal Enthalpies=            -234.468256
 Sum of electronic and thermal Free Energies=         -234.468256
From the above data that at 298K there is a large difference in energy when the contribution from entropy is included, this is seen in all the conformers. By comparison with the data at 0K, it is clear that increasing the temperature causes the sum of electronic and thermal energies to beo come more negative, this is inline with Gibbs free energy equation (G= H - TS) as temperature is increased the entropic term becomes more significant. The difference in the entropic contribution between 0K and 298.15K is around 0.32 Ha which is significant.
It can also be seen that the as temperature is increased the thermal contributions to energy and enthalpy both increase, meaning the second and third values in the data above are less negative at 298.15K compared with 0K. This difference is significantly smaller than the previously discussed entropic contribution.
Finally, it can be seen that all the terms for the 0K are exactly the same, this to be expected since at absolute zero there would be no contributions from thermal energy, and as its name suggests only the zero-point energy remains.
Optimising the Transition States
For reasons discussed in the introduction the 2 transition state structures to be analysed are the chair and boat, which can be seen in the reaction scheme.
Optimising the Chair TS
There are 2 possible methods for the optimisation of the Chiar transition state, one involves calculating the force constant matrix at every step of the optimisation, the other involves freezing the coordinates of some of the atom, both were carried out. Both methods have the first step in common.
First an allyl molecule was drawn in GuassView and optimised (HF/ 3-21G)[24]. This optimised geometry was then copied using the 'Append Molecule' function in GuassView so that two identical allyl fragment were in the same window. These two fragments were then spatially arranged in a 'guessed' chair transition state with terminal carbons roughly 2.2 Angstroms apart. This was used as the start point for both methods detailed below.
Computing the Force Constant Matrix
The advantage of using this method is that it is quick and is complete in one calculation. The disadvantage is that it can only really be applied to simple transition states, this is because if the original 'guess' is not close enough to the true optimised structure the optimisation will fail and a false maximum will be found. Fortunately since the transition state in this case is indeed very simple this method should work.
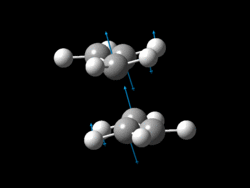
The allyl fragments were sent to SCAN with a new calculation: Opt+Freq with HF/3-21G method and basis set. For the optimisation the 'TS Berny' option was selected rather than a minimum so that a transition state (maximum) rather than a product (minimum) was found, force constants were set to be calculated once. Importantly 'Opt=NoEigen' was added to the Additional Keywords so that a true global maximum is found. Without these additional keywords the calculation will stop/fail when more than one maximum is found on the way to the highest global maximum (corresponding to the desired TS geometry) is found. This means that one imaginary negative vibrational frequency should be found if the optimisation is successful. [25]
| Imaginary Vibration (TOP VIEW) | Imaginary Vibration (SIDE VIEW) | Frequency of Absorption (cm-1) | Energy (Ha) |
|---|---|---|---|
 |
 |
-818 | -231.61932 |
Freezing Reaction Coordinates
Using this method the the 'Freeze Coordinate' function is GuassView was used to force and hold the terminal carbons between each of the allyl fragments 2.2 Angstroms apart. This new geometry was then sent to be optimised to a minimum (HF/ 3-21G). This Formatted Checkpoint File of this first optimisation was then opened in GuassView 5.0 and the previously frozen distances were allowed to altered. This was then sent back to SCAN for another optimisation (Opt/Freq, TS Berny, HF/ 3-21G) but with no force constants calculated during the optimisation. [26]
| Imaginary Vibration (TOP VIEW) | Imaginary Vibration (SIDE VIEW) | Frequency of Absorption (cm-1) | Energy (Ha) |
|---|---|---|---|
 |
 |
-818 | -231.61932 |
Optimising the Boat TS
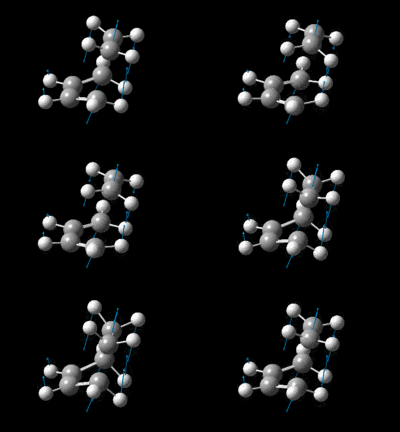
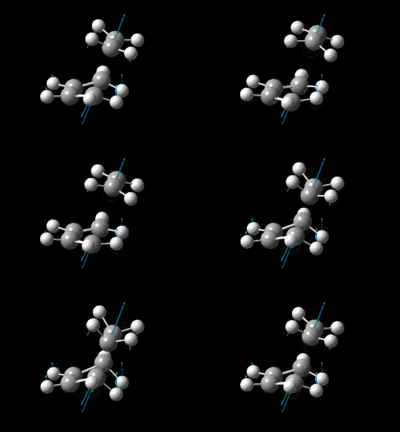
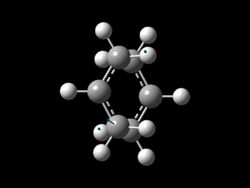
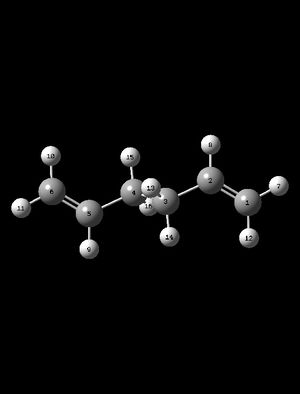
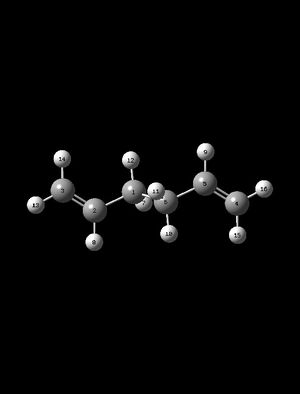
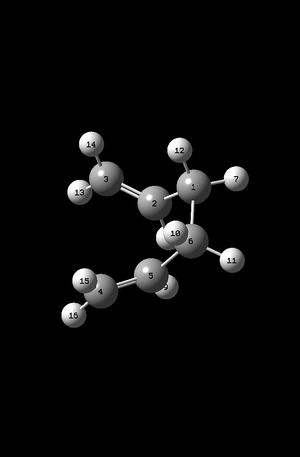
The method used to produce the Boat transition state is quite different to those used to find the Chair TS. In this section the QST2 method is used, this works by interpolating between a defined reactant and product to produce a transition state geometry. As a result of the way QST2 carried out this calculation the labelling and orientation of the reactant and product molecules is very important if a successful optimisation is to be gained. This is demonstrated below. First the Anti-2 conformer with symmetry point group Ci was copied twice into the same GaussView file (since the product and reactant are exactly the same). Using the 'Edit - Atom List' function in GuassView, the atoms were labeled exactly as seen in the diagram below:
|
|---|
QST2 without manual optimisation of Reactant and Product
The calculation was sent with the TS(QST2) method (Opt+Freq, HF/3-21G) and again with additional keywords, Opt=NoEigen. It can be seen from the Jmol above that without the manual any manual changes made the orientations of the reactant and product the optimisation fails. The reason for this is that the calculations does take account of the fact that in reality there is a large amount of rotation around the C-C single bonds. Therefore the starting geometries need to be altered as seen below
QST2 with manual optimisation of Reactant and Product
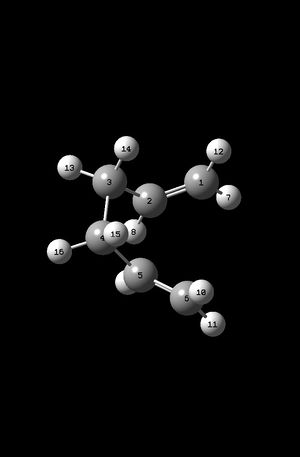
The central dihedral angle (C2-C3-C4-C5) was made to be 0 degrees, and the (C2-C3-C4) and (C3-C4-C5) bond angles were set to 100 degrees, producing the structures below.
|
|---|
When this was sent to SCAN with the same parameters and options as the above with no manual alterations, the optimisation was successful, indicated by a single imaginary negative vibrational absorption.
| Imaginary Vibration (TOP VIEW) | Imaginary Vibration (SIDE VIEW) | Frequency of Absorption (cm-1) | Energy (Ha) |
|---|---|---|---|
 |
 |
840 | -231.60280 |
Summary of Results from the Optimisation of the Chair and Boat Transition States
It can be seen from the above optimisation that having successfully optimised both transition states, the Chair TS is more stable than the Boat TS, this is discussed in detail in the activation energy section.
Intrinsic Reaction Coordinate
To determine the geometry of the product of the Cope reaction the IRC is used to optimise the transition states to a minimum. This procedure is necessary because although it is likely particularly in the case of endothermic reactions in accordance with Hammonds Postulate that the transition state may resemble the end product(s) it still almost impossible to say with certainty which conformer will be produced. The IRC is the best way to predict the product computationally.
IRC for the Chair Transition State
Initially the IRC was run over the Chair transition state by creating a new calculation: (IRC, HF/3-21G)[27], with the maximum steps set to 50 and force constant to be calculated only once. The IRC was also only run in the forward direction because in this case the reactant is the same as the product, therefore running the IRC in both direction would simply produce an energy graph that is symmetrical in the y-axis.
It can be seen from the Figures below that the calculation stopped in 23 steps, and produced the following structure. It can be seen from the energy graph the optimisation had not been run to completion since the line was not completely flat, i.e. the condition that dy/dx=0 was not fulfilled. With this being the case there are 3 further options to take the optimisation completion, these are detailed below.
| Energy and RMS Graphs | Energy (Ha) | Animation |
|---|---|---|
 |
-231.68682 | 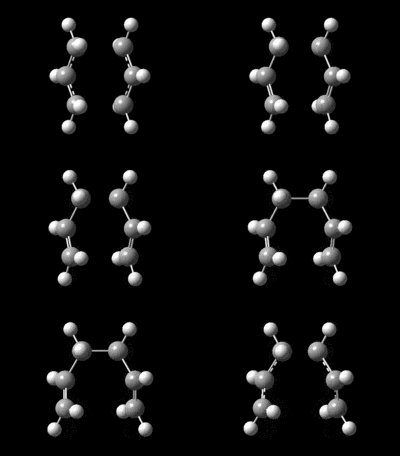
|

|
(1)New Optimisation on the Final IRC geometry
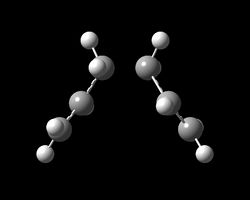
The first method is very simple and has the advantage that it is quick and has a low computational cost. This method is simply to reoptimise the structure obtained from the final iteration of the IRC calculations [28]. This was carried out with HF/3-21G and produced the following conformer. It can immediately be seen that the resulting geometry resembles the Guache-2 conformer. This is supported by the fact that the point group of the optimised product is C2 and has the same energy as the Gauche-2 conformer optimisation carried out previously. The disadvantage of this method is that if the geometry of a the final stage of the IRC is not close enough to that of the product, the optimisation will fail.
| Final Optimised Product | Energy (Ha) |
|---|---|
 |
-231.69167 |
(2)Re-run the IRC calculation with a higher maximum number of steps
It can be seen from the graphs and diagram below that re-running the IRC with 300 [29] maximum steps rather than 50 was fairly pointless because the calculation continues to stop after 23 interactions regardless, thus producing the exactly same results. It seems it can be concluded that increasing the maximum number of steps in the calculation set up is only worthwhile if this factor is actually limiting the calculation, i.e. if the number of iterations at the first attempt reached 50 and so stopped prematurely.
| Energy and RMS Graphs | Energy (Ha) | Animation |
|---|---|---|
 |
-231.68682 | 
|

|
(3)Re-run the IRC calculation with Force Constants calculated at each step
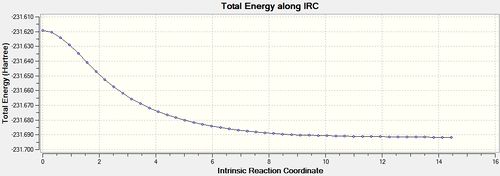
Re-running the IRC calculation with calculate Force Constants 'Always' [30] was far more fruitful and produced some interesting results. First it is very clear from the energy graph below that the optimisation was actually run to completion from the long flat line produced with 0 gradient. The results of the optimisation can be seen below and are in agreement with method (1). The only disadvantage of this method is that is far more computationally costly than the previous 2 methods, while this is not a problem in a simple system such as this, if the transition state being studied was complex then this long computational time would have to be accounted for.
| Energy and RMS Graphs | Energy (Ha) | Animation |
|---|---|---|
 |
-231.69166 | 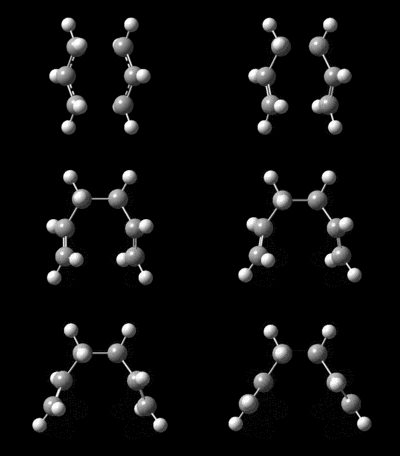
|

|
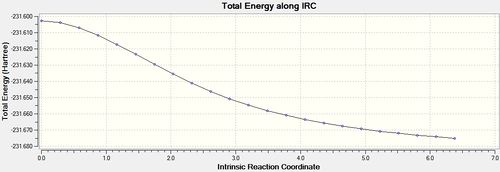
IRC for the Boat Transition State
The same procedures carried out on the Chair transition state were repeated for the Boat TS.
| Energy and RMS Graphs | Energy (Ha) | Animation |
|---|---|---|
 |
-231.67507 | 
|

|
(1)New Optimisation on the Final IRC geometry
The geometry of the optimisation suggests the product when the reaction goes through the Boat TS is the Guache-3 conformer. This is seen below.
| Final Optimised Product | Energy (Ha) |
|---|---|
 |
-231.60280 |
(2)Re-run the IRC calculation with a higher maximum number of steps
As for the Chiar TS, there was no difference seen when the maximum number of steps was increased. All the diagrams for the IRC are the same as those seen in the first attempt above.
(3)Re-run the IRC calculation with Force Constants calculated at each step
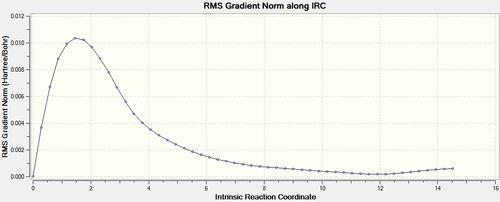
Once again when the Force Constant was calculated for each step the optimisation was run to completion. [31]
| Energy and RMS Graphs | Energy (Ha) | Animation |
|---|---|---|
 |
-231.68557 | 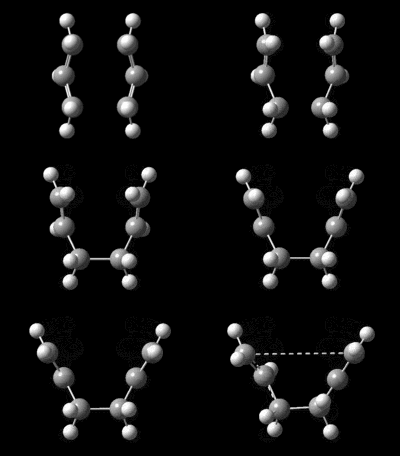
|
|
Analyses of Activation Energies
Clearly to calculate an activation energy, an energy for the reactant must be decided upon so that it can be subtracted from the energy of the transition state. The activation energy will be calculated at 2 different basis sets and methods: (1) HF/3-21G, (2)DFT/ 631-G(*). The second is a higher level basis set and method, carrying both calculation will allow a comparison to be made. [32][33]
For the HF calculation the reactant energy will be assumed to be that which corresponds to the Guache-3 conformation since this was the most stable 1,5-Hexadiene conformer at this level basis set and method. Whereas at the DFT/631-G(*) level the Anti-1 conformer was found to be the most stable, and so the Anti-1 conformers energy will be taken to be the energy of the reactant in this higher level calculation.
| HF/3-21G | B3LYP/6-31G* | Literature Activation Energy (kcal/mol) | |||||||
|---|---|---|---|---|---|---|---|---|---|
| Transition State | Gauche 3 Energy (Hartrees) | Energy (Hartrees) | Activation Energy (Hartrees) | Activation Energy (kcal/mol) | Anti 1 (Hartrees) | Energy (Hartrees) | Activation Energy (Hartrees) | Activation Energy (kcal/mol) | |
| Chair | -231.69266 | -231.61932 | 0.07334 | 46.0 | -234.61179 | -234.55698 | 0.06092 | 38.2 | 33.5±0.5 |
| Boat | -231.69266 | -231.60280 | 0.08986 | 56.4 | -234.61179 | -234.54309 | 0.0687 | 43.1 | 44.7±2.0 |
It can be seen from the activation energies above that there is good agreement with the literature. It is also evident that the activation energy for the Boat transition state is larger than that of the Chair TS. This suggests that under kinetic conditions the reaction would proceed via the Chair TS and so the major product would be the Gauche-2 conformer.
Conclusions from Cope rearrangement
It can be concluded from the analysis above that the most stable conformers of 1,5-hexadiene are the Anti-1 and Guache-3 confomers, with the higher level calculation suggesting the former. In addition it has been seen that the Chair TS is lower in energy than the Boat TS, and from the IRC the Chair TS produces the Guache-2 conformer, whereas the Boat TS produces the Guache-3 conformer.
Overall the computational techniques above have proved both accurate and reliable on a simple cycloaddition. These same techniques will now be applied to more complex Diels-Alder reactions.
The Diels-Alder Cycloaddition
The Diels-Alder reaction is a very famous and synthetically useful [4π+2π] cycloaddition [34] between a dienophile (electron rich) and diene (electron deficient) which earned its discovers the Nobel Prize in 1950. It has been well researched and it is well known that the reaction is regioselective proceeding either through an Exo or Endo transition. In this section of the Module computational techniques will be used to investigate the structures of both transition states in 2 different Diels-Alder reactions. This will hopefully reveal the why the Endo transition state is favoured over the Exo one, and the consequences of this.
Introduction
The first Diels-Alder to be investigated is the reaction between Butadiene and Ethene (reaction scheme seen below) this is possibly the simplest Diels-Alder reaction possible and since the ethene molecule is not functionalised there will be no difference between an Endo and Exo approach to the dienophile. This reaction will though clearly show the basic priciples of the Diels-Alder reaction and the orbitals involved in the reaction.

The second reaction of the same class to be looked at is that between Cyclohexadiene and Maleic Anhydride (reaction scheme seen below), this is a classic example of Diels Alder reaction and is made more favourable by the fact that the dienophile (Maleic Anhydride) has a very electron deficient double bond due to its electron withdrawing carbon moieties. This lowering of energy of the LUMO orbital of Maleic Anhydride make it closer in energy to the HOMO of the diene, this makes the reaction more kinetically favourable. This second example is more complex than the first one because selectivity will be present between the Endo and Exo transition states, this will be investigated in detail. [35]
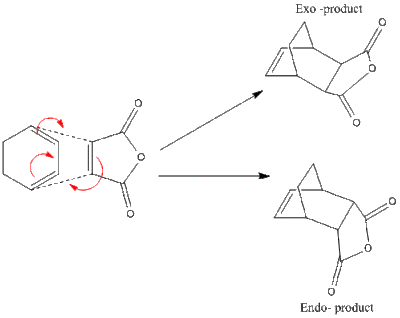
In each of the reactions above the calculations will first be run using the semi-empirical AM1 method, and then reoptimised at the higher level DFT-B3LYP/ 6-31(*) level. In this way a comparison between the results given by the different methods and basis sets can be seen.
Optimisation of the Reactants, Ethene and Butadiene
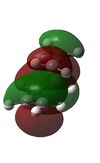
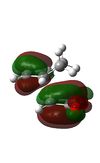
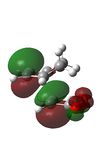
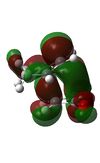
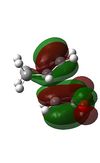
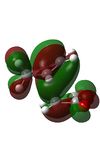
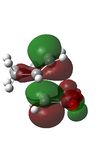
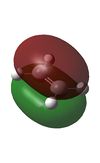
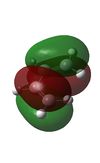
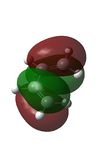
Having drawn and run the optimisation calculations over both Ethene and Butadiene reactant molecules their Molecular orbitals were visualised on GuassView 5.0. [36][37][38][39]
| Method | LUMO | HOMO | Energy of Optimised Structure |
|---|---|---|---|
| AM1 Optimised | 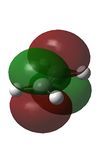 |
 |
0.02619 |
| DFT Optimised | 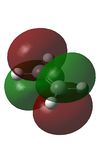 |
 |
-78.58746 |
| Method | LUMO | HOMO | Energy of Optimised Structure |
|---|---|---|---|
| AM1 Optimised |  |
 |
0.04880 |
| DFT Optimised | 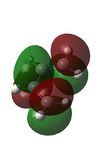 |
 |
-153.98596 |
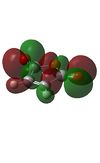
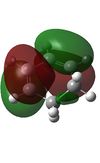
It can be seen very clearly from the tables above that although the energies for each of the reactants is very different when analysed with the AM1 method compared to DFT-B3LYP/631-G(*) the molecular orbtitals and geometries are almost identical.
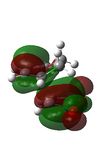
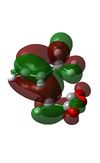
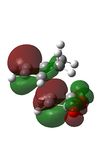
It is important to note that the Diels-Alder is not possible if it is symmetry forbidden. That is to say that the molecular orbitals involves in bond formation must have the same symmetry. It can be seen that the HOMO of Butadiene has the same symmetry as the LUMO of Ethene, antisymmetric. And the HOMO of Ethene has the same symmetry as the LUMO of Butadiene, symmetric. The cis-butadiene molecule and indeed the transition state has C2 axis and σv plane of symmetry giving them a C2v symmetry point group, this makes the cycloaddition possible.
Optimisation of the Transition State for the Ethene + Butadiene Cycloaddition
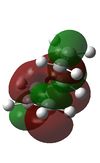
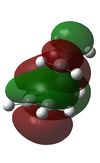
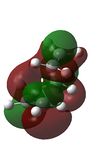
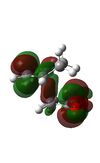
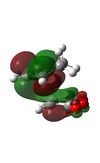
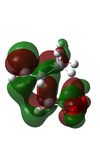
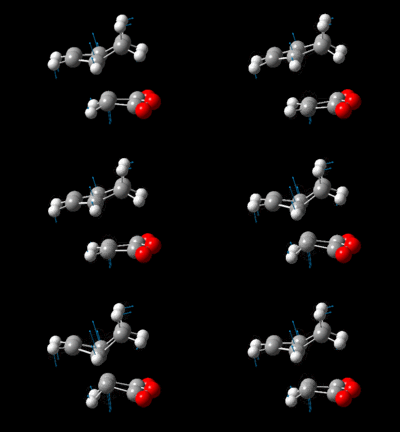
The transition state for this reaction was optimised using the Freeze Coordinate method discussed in the Cope rearrangement section. This was then optimised to TS Berny using both the AM1 and DFT methods. The resulting structures can be seen in the Jmol diagrams in the table below, along with the Molecular orbital interactions. Finally the single imaginary vibrations show that a true transition state was found in each of the optimisations.[40][41]
It can be seen from the above that the imaginary IR absorptions calculated by the different methods are very different, this is perhaps not surprising considering how different the parameters which each of the methods uses is. It should also be noted that more importantly the order of the Molecular orbitals is different between the methods with the HOMO and HOMO-1 MOs switching positions. This is most likely because they are simple so close together in energy. The AM1 method has predicted the HOMO is bonding (antisymmetric) orbital, and the LUMO is an antibonding (symmetric) orbital, whereas the DFT method has predicted both the HOMO and LUMO are bonding (symmetric).
The bond lengths in the transition states can be seen above in the Jmol diagrams and will be discussed in detail in the 'Comparison of Transition States' section.
IRC Analysis of the Butadiene + Ethene Cycloaddition
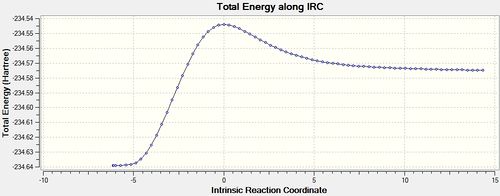
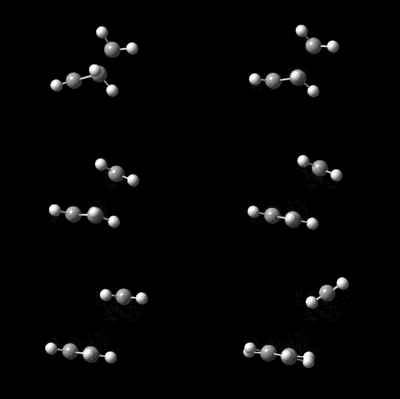
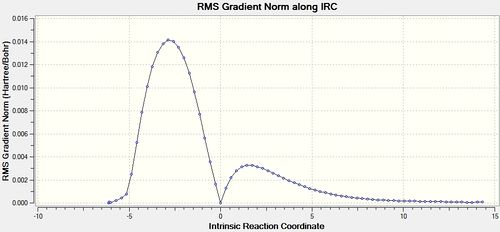
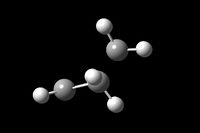
Having seen the advantages of calculating force constants at every step of the calculation in the Cope rearrangement it was decided this would be the best method to use in this reaction as well. Therefore the IRC was using DFT-B3LYP/ 631-G(*) [42], this gave good reliable results but to a higher computational cost than using an AM1 calculation.
| Energy and RMS Graphs | Reactant/ Product Structures | Animation | Energy of Product |
|---|---|---|---|
 |
 |
 |
-234.63915 |
 |
|
It can be seen from the above graphs that the IRC was run in both the forward and backward directions, although it is more normal for the forward direction to produce the product this was found not to be the case. In fact the reactants were reformed in the forward direction and the product in the backward direction. This is not a problem it simply indicates that the optimised transition state structure comes early in the potential energy curve and resembles the reactants more than the products.
Optimisation of the Reactants, Cyclohexadiene and Maleic Anhydride
As in the first Diels-Alder reaction each of the reactants was optimised first using the AM1 method then to the DFT level. [43][44][45][46]
| Method | LUMO | HOMO | Energy of Optimised Structure |
|---|---|---|---|
| AM1 Optimised |  |
 |
-0.12182 |
| DFT Optimised | 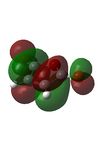 |
 |
-379.28954 |
| Method | LUMO | HOMO | Energy of Optimised Structure |
|---|---|---|---|
| AM1 Optimised | 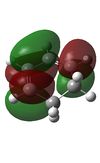 |
 |
0.03553 |
| DFT Optimised |  |
 |
-233.41894 |
Once again it can be seen from the above that the symmetries of the reactants allows the molecular orbitals to overlap to form attractive interactions and the reaction to proceed successfully.
Optimisation of the Transition State for the Cyclohexadiene and Maleic Anhydride Cycloaddition
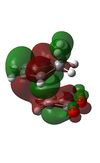
It was first attempted to use the same Freeze coordinate method to produce the optimised transition state structures however it seemed the added complexity of this transtion state meant that without some manual changes to the preoptimised orientation of the reactant molecules the optimisation would continue to fail. This initial failure without alteration of the structures of the reactants was most likely due to steric repulsions between the CH2-CH2 fragment on cyclohexadiene and the -C(C=O)-O-(C=O)- fragment on maleic anhydride for the exo TS, and the same maleic anhydride moeity with the CH=CH fragment of the cyclohexadiene in the endo case. The dihedral angles of the structures were therefore adapted to make the approach of the maleic anhydride dienophile more favourable. Optimising these new structures proved far more effective and the single imaginary IR frequencies prove the optimisation was successful.[47][48][49][50]
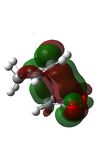
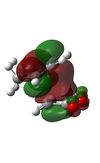
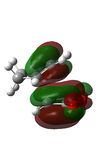
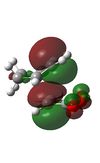
The first thing that should be noted is that the optimisation of the 2 transition states suggests it is the Endo one that is lower in energy, as was expected. Looking at the MO diagrams for the endo and exo transition states it is difficult to justify this difference in energy on the grounds of electronics. When looking at the most important orbital (the HOMO) it can be seen that there is little to no stabilising overlap between the -(C=O)-C-(C=O)- fragment of maleic anhydride and the cyclopentadiene in either of the transition states. This was not expected for the Exo TS but was expected for the Endo TS. It can actually be seen very clearly that there is good secondary orbital overlap in the LUMO+1 and LUMO+2 of the Endo TS which is not present in the Exo form. However since both these orbitals are unoccupied non-bonding orbitals the stabilisation gained from this overlap would be little to none. As a result of this analysis it can be concluded that the difference in energy seen between the 2 transition states must be justified almost solely on steric grounds. This being the case the important interaction is the destabilising steric clash between the cyclohexadiene bridge and maleic anhydride. This is discussed in more detail in the structural comparision between the 2 transition states seen below.
IRC Analysis of the Cyclohexadiene and Maleic Anhydride Cycloaddition
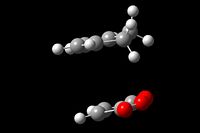
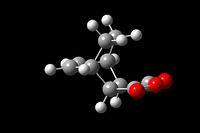
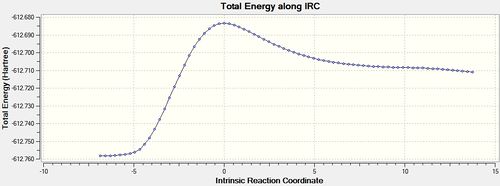
IRC analysis was run at the DFT-B3LYP/ 6-31G(*) level as this is more reliable than the AM1 method. Force Constants were calculated at each step.[51][52]
| Energy and RMS Graphs | Reactant/ Product Structures | Animation | Energy of Product |
|---|---|---|---|
 |
 |
 |
-612.75576 |
 |
|
| Energy and RMS Graphs | Reactant/ Product Structures | Animation | Energy of Product |
|---|---|---|---|
 |
 |
 |
-612.75829 |
 |
|
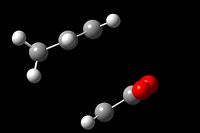
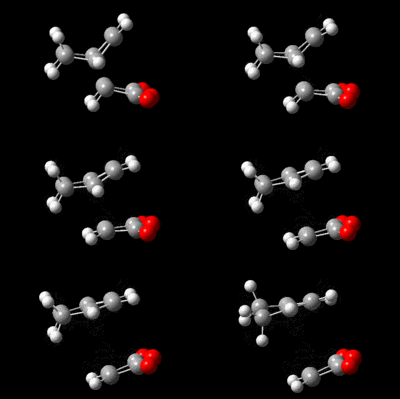
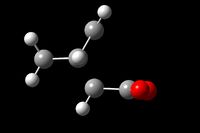
It can be seen from the above table that the Exo IRC ran in the expected direction with the product being formed in the forward direction and the reactant in the backward. The Endo IRC however ran in the same way as the first Diels-Alder reaction. The IRCs were both successful in producing the products from each of the transition states.
Comparison of Transition State Structures
When using the second table, CY= Cyclohexadiene, MA= Maleic Anhydride. All bond distances are quoted in Angstroms.
| Method | diene (C=C) | diene (C-C) | ethene (C=C) | Forming C-C |
|---|---|---|---|---|
| AM1 | 1.38 | 1.40 | 1.38 | 2.12 |
| DFT | 1.38 | 1.41 | 1.39 | 2.27 |
The first thing to be noted from the data above for the first Diels-Alder reaction is that the bond lengths in the reactants using both methods are very similar. The only real difference in the length of the forming C-C bond. This can be seen to be longer when using the DFT method, this is because the DFT method places a large emphasis on steric repulsions as discussed previously. The length of the forming C-C bond, compared to the Van der Waals radius of a Carbon atom is discussed in detail later in this section.
| Method | Transition State | CY (C=C) | CY (C-C) | MA (C=C) | Forming C-C | Repulsive MA Carbon - CY Carbon | Forming C-C bond angle (see JMol) |
|---|---|---|---|---|---|---|---|
| AM1 | exo | 1.39 | 1.52 | 1.41 | 2.17 | 2.95 | 99.8 degrees |
| endo | 1.39 | 1.52 | 1.41 | 2.16 | 2.89 | 94.8 degrees | |
| DFT | exo | 1.39 | 1.56 | 1.40 | 2.29 | 3.03 | 99.1 degrees |
| endo | 1.39 | 1.56 | 1.39 | 2.27 | 2.99 | 94.3 degrees |
Once again in the case of the second Diels-Alder reaction the two methods are in agreement. In addition it can be seen that the bond lengths in the reactants is very similar suggesting a delocalisation of electrons. There are though some differences between the Endo and Exo transition states; the Forming C-C bond is shorter in the Endo case suggesting the Endo transition state is more favourable. This shorter bond distance is due to the secondary orbital overlap effect discussed in the Molecular orbital sections (can be seen very clearly in the LUMO+1 and LUMO+2). It can also be seen however that the sterically repulsive interaction between the maleic anhydride and cyclohexadiene in the Exo transition state making it less stable, since this interaction is unfavourable for the Exo TS but favourable for the Endo TS the distance is longer in the Exo form. An interesting consequence of this difference is the angle at which the maleic anhydride approaches the diene, there is a 5 degree difference between the 2 transition states and this is most likely due to the Exo TS trying to avoid steric clashing as much as possible.
From this analysis it is quite clear that the steric clashing in the Exo TS between maleic anhydride and the cyclohexadiene bridge, and the electronic effect in the Endo TS, means the Endo TS is more favourable and lower energy. To quantify this difference the activation energies will be looked at.
From the bond length data above, one thing is clear, since the distance for the forming C-C bond is shorter than 3.4 Angstroms the interaction must be an attractive one. This distance comes from doubling the Van der Waals radius of Carbon which is 1.7 Angstroms. The equilibrium bond distance for a C-C bond is 1.54 Angstroms [53], if the distance between carbons was shorter than this in the transition state, the repulsive arm on the Lennard-Jones potential would be entered. Since the distance seen above are around 2.1 Angstroms this interaction is somewhere inbetween the non-bonding distance of 3.4 Angstrom and the most favourable equilibrium distance of 2.1 Angstroms.
It can also be seen that there is a delocalisation of across the C=C bonds because the bond length found is around 1.39 Angstroms which is longer than a typical sp2-sp2 carbon bond which is 1.34 Angstroms.
Comparison of Activation Energies
The activation energy for the reaction of Maleic Anhydride with Cyclohexadiene can be found for both the Exo and Endo pathways simply by subtracting the sum of the energies of the separate optimised reactants from the energy of the optimised transition state. All these calculations have been completed previously so the relevant data simply need to be retrieved.
AM1
Energy of Reactants = (-0.12182Ha + 0.03553Ha) = -0.08629Ha
Activation Energy (Exo) = -0.05042 - (-0.08629) = 0.03587Ha = 22.5kcal/mol
Activation Energy (Endo) = -0.05150 - (-0.08629) = 0.03479Ha = 21.8kcal/mol
DFT
Energy of Reactants = (-379.28954Ha - 233.41894Ha) = -612.70848Ha
Activation Energy (Exo) = -612.67931 - (-612.70848) = 0.02917Ha = 18.3kcal/mol
Activation Energy (Endo) = -612.68340 - (-612.70848) = 0.02508Ha = 15.7kcal/mol
Therefore the relative energy for the exo transition state is:
AM1: +0.7kcal/mol
DFT: +2.6kcal/mol
This clearly suggests that the Endo transition state is the kinetically favoured pathway for the reaction, since it has a lower activation energy using both methods.
Comparison of Product Energies
It was expected that the exo product would be the more stable thermodynamic product. Computationally this does not seem to be the case. The relative energy of the exo product is +0.00253 Ha = +1.6kcal/mol. This is an unexpected result and may simply due to the level or error present in the computational calculations.
Conclusions of the Diels-Alder reactions
It can be concluded from this section that in the case of the reaction between butadiene and ethene, the symmetry of the molecular orbitals in both reactions allows the reaction to take place. In addition analyses of the structure of the transition state shows there is an attractive interaction between the ethene and butadiene.
The reaction between Maleic anhydride and cyclohexadiene has backed the theory that the Endo transition state is more favourable than the Exo one. However it is most commonly thought that the reason for this is due to favourable pi orbital overlap between the reactants, i.e. electronic effects, this study has suggested instead that it is the steric effects that are more important.
Finally the result that the Exo product was not more stable than the Endo one was surprising and maybe have been different if a higher level of calculation was carried out.
Possible Improvements to the Experiment
There were many possible improvements that could have been made throughout the module:
- It would be possible to investigate the effect of pressure and temperature on the activation energies of each of the reactions in the module.
- It would also be interesting to see how the different activation energies actually correlate to the predicted yield of each of teh possible isomers.
Future Work
For future work I would be interested in seeing how the functionalisation of the cyclohexadiene molecule to make the diene more electron rich would effect the energy of the transition states and the MO structures. In addition funtionalisation of the cyclohexadiene bridge with a sterically bulky group would be interesting to see if there was a point at which the exo transition state became so hindered that the reaction would be 100% selective for the Endo product.
Conclusion
In conclusion it is easy to see that computational methods are accurate and reliable enough to be used to predict transition state structures and their energies. Although the reactions studied in this module have been fairly simple it is easy to see that the tools used have great potential and as the basis sets and computational power continue to get higher more complex transition states will be modeled accurately.
References
- ↑ http://pubs.acs.org/doi/pdf/10.1021/ed084p2001
- ↑ http://hdl.handle.net/10042/to-12207
- ↑ http://hdl.handle.net/10042/to-12208
- ↑ http://hdl.handle.net/10042/to-12211
- ↑ http://hdl.handle.net/10042/to-12210
- ↑ http://hdl.handle.net/10042/to-12212
- ↑ http://hdl.handle.net/10042/to-12213
- ↑ http://hdl.handle.net/10042/to-12214
- ↑ http://hdl.handle.net/10042/to-12215
- ↑ http://hdl.handle.net/10042/to-12216
- ↑ http://hdl.handle.net/10042/to-12217
- ↑ http://hdl.handle.net/10042/to-12218
- ↑ http://hdl.handle.net/10042/to-12219
- ↑ http://hdl.handle.net/10042/to-12220
- ↑ Henry Rzepa - Second Year Conformational Analysis: http://www.ch.ic.ac.uk/local/organic/conf/c1_alkanes.html
- ↑ http://www2.chemistry.msu.edu/faculty/reusch/VirtTxtJml/Spectrpy/InfraRed/infrared.htm
- ↑ http://hdl.handle.net/10042/to-12221
- ↑ http://hdl.handle.net/10042/to-12222
- ↑ http://hdl.handle.net/10042/to-12223
- ↑ http://hdl.handle.net/10042/to-12231
- ↑ http://hdl.handle.net/10042/to-12232
- ↑ http://hdl.handle.net/10042/to-12233
- ↑ https://wiki.ch.ic.ac.uk/wiki/index.php?title=Mod:phys3
- ↑ http://hdl.handle.net/10042/to-12615
- ↑ http://hdl.handle.net/10042/to-12617
- ↑ http://hdl.handle.net/10042/to-12616
- ↑ http://hdl.handle.net/10042/to-12621
- ↑ http://hdl.handle.net/10042/to-12626
- ↑ http://hdl.handle.net/10042/to-12623
- ↑ http://hdl.handle.net/10042/to-12624
- ↑ http://hdl.handle.net/10042/to-12629
- ↑ http://hdl.handle.net/10042/to-12631
- ↑ http://hdl.handle.net/10042/to-12633
- ↑ Clayden J., Greeves N., Warren S., Wothers P., Organic Chemistry, 2001
- ↑ http://pubs.acs.org/doi/pdf/10.1021/ed086p199
- ↑ http://hdl.handle.net/10042/to-12634
- ↑ http://hdl.handle.net/10042/to-12635
- ↑ http://hdl.handle.net/10042/to-12636
- ↑ http://hdl.handle.net/10042/to-12637
- ↑ http://hdl.handle.net/10042/to-12640
- ↑ http://hdl.handle.net/10042/to-12639
- ↑ http://hdl.handle.net/10042/to-12641
- ↑ http://hdl.handle.net/10042/to-12642
- ↑ http://hdl.handle.net/10042/to-12643
- ↑ http://hdl.handle.net/10042/to-12644
- ↑ http://hdl.handle.net/10042/to-12645
- ↑ http://hdl.handle.net/10042/to-12646
- ↑ http://hdl.handle.net/10042/to-12647
- ↑ http://hdl.handle.net/10042/to-12648
- ↑ http://hdl.handle.net/10042/to-12649
- ↑ http://hdl.handle.net/10042/to-12650
- ↑ http://hdl.handle.net/10042/to-12651
- ↑ http://en.wikipedia.org/wiki/Bond_length


