Reaction Dynamics lp1916
Exercise one
Question one
Q: What value do the different components of the gradient of the potential energy surface have at a minimum and at a transition structure? Briefly explain how minima and transition structures can be distinguished using the curvature of the potential energy surface.
Answer:
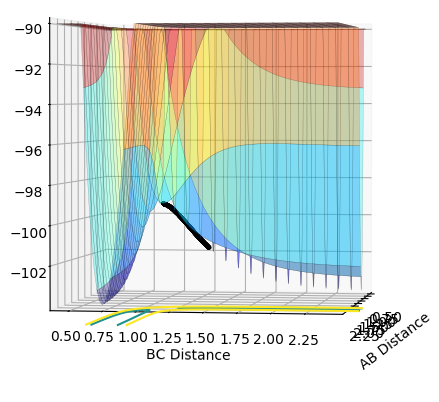
First of all, let r1 be the distance between HA-HB where HC is approaching with an initial momentum, and r2 be the distance between HB-HC where HA has left. The gradient of potential energy is comprised of two components which are the partial derivative of r1, = Vr1, and the partial derivative of r2, = Vr2, respectively in a 3D space. At minimum trajectory , both components equal ZERO. Whereas for the transition structure(i.e. saddle point), which is defined as the local maximum point ON THE MINIMA PATH, both components equal ZERO as well. As the values for different component of potential energy cannot be used as a reference to distinguish between minima and transition structure, curvature can be used. Curvature can be approximised to be the secondary partial derivatives of both r1 and r2. For the minima, Vr1r1 is greater than zero while the determinant (curvature), Vr1r1•Vr2r2 - V2r1r2, is greater than zero as well. However for the saddle point, the determinant is less than zero.
Question 2
Q: Report your best estimate of the transition state position (rts) and explain your reasoning illustrating it with a “Internuclear Distances vs Time” plot for a relevant trajectory.
Answer:
• Transition state position: 0.90775
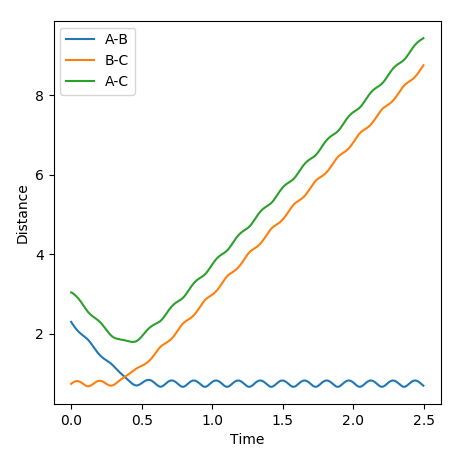
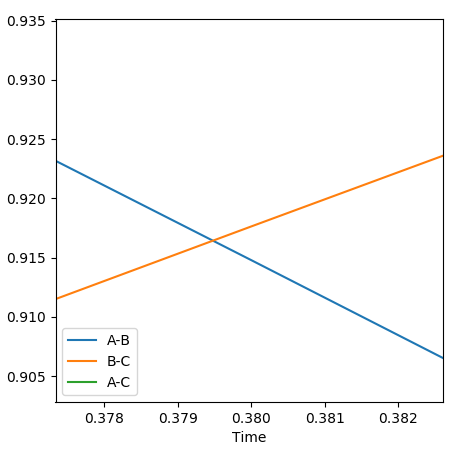
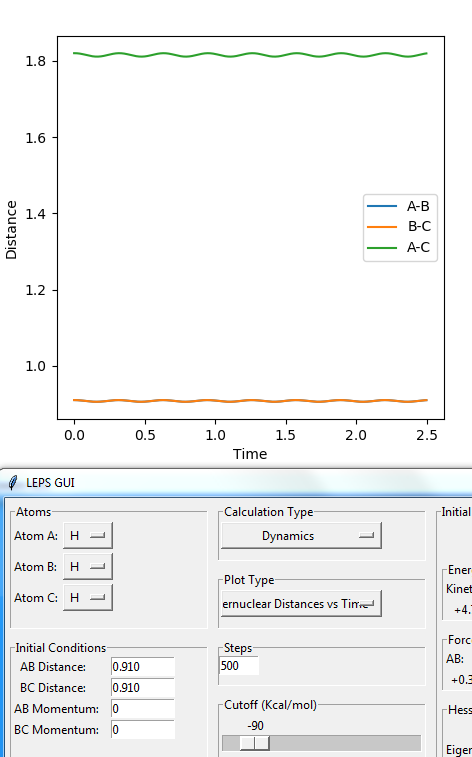
• Reasoning: According to Figure 1 and 2, the curve showing the distance between HA and HB crosses the one showing the distance between HB and HC. The interception point represents the transition state and the y-axis therefore can be used as a reference in determining the position of transition state. Therefore, according to Figure 3, by setting the initial momenta as zero, the triatomic structure should remain stationary and there should not be any oscillation of distances between HA, HB and HB, HC. By approximating different values of the distances between HA and HB, two straight lines has shown up in the D vs. t plot which indicate the absence of oscillation and thereby proves that this approximated distance is indeed where the transition state locates.
Question 3
Q: Comment on how the mep and the trajectory you just calculated differ.
Answer:
• Difference in surface plot:
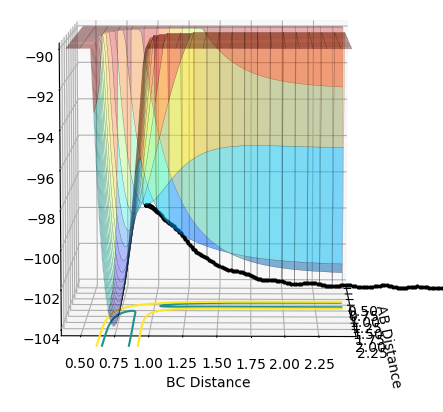
As shown in Figure 5 and 6, mep follows the lowest energy path and gives a smooth, linear trajectory without any observable oscillations. The Dynamics method, however, shows the real reaction pathway and there are visible oscillations in distance. Also, mep has a much shorter trajectory while Dynamics has a full

